Abstract
Acalabrutinib, a highly selective Bruton’s tyrosine kinase inhibitor, is associated with high overall response rates and durable remission in previously treated chronic lymphocytic leukemia (CLL), however, complete remissions were limited. To elucidate on-target and pharmacodynamic effects of acalabrutinib, we evaluated several laboratory endpoints, including proteomic changes, chemokine modulation, and impact on cell migration. Pharmacological profiling of samples from acalabrutinib-treated CLL patients was used to identify strategies for achieving deeper responses, and to identify additive/synergistic combination regimens. Peripheral blood samples from 21 patients with relapsed/refractory CLL in acalabrutinib phase I (100–400 mg/day) and II (100 mg BID) clinical trials were collected prior to and on days 8 and 28 after treatment initiation and evaluated for plasma chemokines, reverse phase protein array, immunoblotting, and pseudoemperipolesis. The on-target pharmacodynamic profile of acalabrutinib in CLL lymphocytes was comparable to ibrutinib in measures of acalabrutinib-mediated changes in CCL3/CCL4 chemokine production, migration assays, and changes in B cell receptor signaling pathway proteins and other downstream survival proteins. Among several CLL-targeted agents, venetoclax, when combined with acalabrutinib, showed optimal complementary activity in vitro, ex vivo, and in vivo in TCL-1 adoptive transfer mouse model system of CLL. These findings support selective targeting and combinatorial potential of acalabrutinib.
Keywords: Acalabrutinib, venetoclax, chronic lymphocytic leukemia, BTK inhibitor
Introduction
Bruton’s tyrosine kinase (BTK) is a member of the Tec family of kinases that play a critical role in normal and malignant B cells. It is a vital element in the B cell receptor (BCR) pathway that is important in maintenance, survival, proliferation, and migration of chronic lymphocytic leukemia (CLL) cells (1, 2). Ibrutinib is a potent irreversible inhibitor of BTK that covalently binds to the Cys-481 residue of the enzyme (3, 4). Acalabrutinib also binds irreversibly to Cys-481 residue of BTK but is more selective BTK inhibitor in clinical development for the treatment of hematologic malignancies, solid tumors, and autoimmune diseases. It was designed to elicit critically important on-target effects of ibrutinib on BTK (5), while reducing or abrogating off-target influence on other kinases that contain cysteine residues that align with Cys-481 of BTK (6).
Consistent with their expected functionality, in vitro investigations in CLL cells suggested that acalabrutinib and ibrutinib have similar CLL cytotoxicity, effect on adhesion and motility, inhibition of chemokine production, and attenuation of the BCR signaling pathway (7, 8). In contrast, when comparing effects in healthy T cells, ibrutinib inhibited the T cell receptor pathway, while acalabrutinib had a sparing effect (8). Ibrutinib’s effect on T cells was mediated through ITK, which has functional similarity to BTK (9). In addition to T cells, ibrutinib showed antitumor activity in nonhematologic cancers by inhibiting other cysteine-containing kinases, such as epidermal growth factor receptor (EGFR) (10).
Clinically, ibrutinib showed dramatic and stable overall and progression-free survival in previously treated CLL (11), in elderly patients (12), in CLL patients that harbor del17p (13), and in treatment-naïve disease (14). While the overall response rate was consistently high, these clinical responses consisted mostly of partial remissions.
Acalabrutinib was designed to be a potent BTK inhibitor with improved selectivity toward other kinases compared to ibrutinib. Phase I and II clinical trial results with acalabrutinib further validated its on-target effects on CLL cells, as observed through pharmacodynamic endpoints such as lymph node reduction, blood lymphocytosis and its resolution, and inhibition of several cytokines and chemokines (5). The effect of acalabrutinib on T cells, natural killer (NK) cells, and monocytes, as well as drug-driven toxicity profiles, have suggested minimal off-target impact (5). These clinical, pharmacokinetic, and pharmacodynamic investigations on target malignant B cells and non-target hematological cells suggest mechanistic similarities and differences between the activity of ibrutinib and acalabrutinib.
Laboratory endpoints, such as the effect on BCR signaling in malignant CLL cells, impact on adhesion and motility, and other pharmacodynamics parameters during therapy, have not previously been reported. Additionally, in the clinic, while an overall response rate of 95% was observed, there were no complete remissions in patients with CLL with a median follow up of less than 15 months (5). These data strongly underscore the need for identification of currently used drugs that can be paired with acalabrutinib to achieve deeper responses which may translate to complete remissions.
In the current report, we describe several pharmacodynamic and proteomic endpoints during acalabrutinib therapy in patients with CLL. We also utilize pre- and post-treatment CLL cells to conduct pharmacological profiling of several targeted and non-targeted agents currently used in CLL. Finally, using various in vitro, ex vivo, and mouse model approaches, we provide evidence for combination with venetoclax to enhance acalabrutinib’s activity in CLL cells.
Materials and Methods
Patient sample collection and culture
Samples were collected from two cohorts. The first consisted of patients enrolled in acalabrutinib clinical trials (NCT02029443 and NCT02157324). Patients received oral acalabrutinib 100–400 mg daily or 100 mg twice daily (BID). Blood samples were obtained from 21 patients. For 11 patients, samples were generally obtained prior to therapy and on days 8 and 28 after treatment initiation. The second group consisted of CLL patients not enrolled in any clinical trials. These samples were used for in vitro incubation assays for drug combination experiments.
For all blood sample collections, patients provided written informed consent for protocols approved by the Institutional Review Board of The UT MD Anderson Cancer Center, in accordance with the Declaration of Helsinki. CLL cells were collected in green-top blood collection tubes and were isolated by Ficoll-Hypaque density centrifugation (Atlanta Biologicals, Norcross, GA), suspended in RPMI-1640 medium with 10% human serum (Sigma Aldrich, St. Louis, MO), and were freshly used.
Drugs
For in vitro drug combination studies, acalabrutinib was provided by Acerta (Redwood City, CA), and venetoclax was purchased from Xcessbio (San Diego, CA). For mouse studies, acalabrutinib and venetoclax were purchased from ChemieTek Inc (Indianapolis, IN).
Endogenous cell death assays
CLL cells were isolated from blood samples pre- and post-acalabrutinib therapy, suspended in medium, then incubated with dimethylsulfoxide (DMSO) for 24 hours and stained with Annexin/propidium iodide and spontaneous apoptosis was measured (8).
BTK target occupancy ELISA
Blood samples prior to and after start of therapy were collected and PBMC were analyzed to determine occupancy of BTK by acalabrutinib as described in detail in the Supplemental Information section.
Chemokine assays
CCL3 (Mip-1α) and CCL4 (Mip-1β) levels were measured in plasma of patients before and after acalabrutinib therapy using a Quantikine enzyme-linked immunosorbent assay (R&D Systems, Minneapolis, MN) (8).
Transwell migration assays
CLL lymphocytes isolated from peripheral blood obtained pre- and post-acalabrutinib therapy were suspended in RPMI + 10% autologous plasma. Chemotaxis assays were done as described previously (15). Briefly, cells were added to top chamber of transwell culture inserts (Costar), with a diameter of 6.5 mm and a pore size of 5 μm. Filters were placed onto wells containing medium (control) or medium with 200 ng/mL CXCL12 (SDF-1α) (R&D Systems), and CLL cells were allowed to migrate for 3 hours at 37°C. The migrated cells in the lower chamber were collected and counted (16).
RPPA assay
Protein extracts, obtained from CLL cells pre- and post-acalabrutinib, were prepared and analyzed for reverse phase protein array (RPPA) at The MD Anderson RPPA Core facility (n=10 patients). The RPPA set included ~300 proteins.
Immunoblot analyses
Protein extracts from cells were tested for immunoblot assays using the Odyssey Infrared Imaging System (LI-COR Biosciences, Lincoln, NE) (16). Antibodies for specific proteins are listed (Supplementary Table 1).
Pharmacological profiling and cytotoxicity assays
CLL cells were obtained before and after therapy and incubated with different drugs to assess cell death (Supplementary Information).
Preclinical studies in the TCL1-192 mouse model
All mouse studies were done in a TCL1-192 adoptive transfer mouse model (CB17 SCID, females, 6-weeks-old) and experimental details are provided in the Supplementary Information. These experiments were approved by The University of Texas MD Anderson Cancer Center’s Institutional Animal care and Use Committee. Although randomization was not done, 10 or 15 mice were used per group.
Statistical analysis
Paired 2-tailed Student t-tests were performed using Prism-6 software (GraphPad Software, Inc., La Jolla, CA).
Results
Acalabrutinib triggers lymphocytosis and these cells are primed for apoptosis
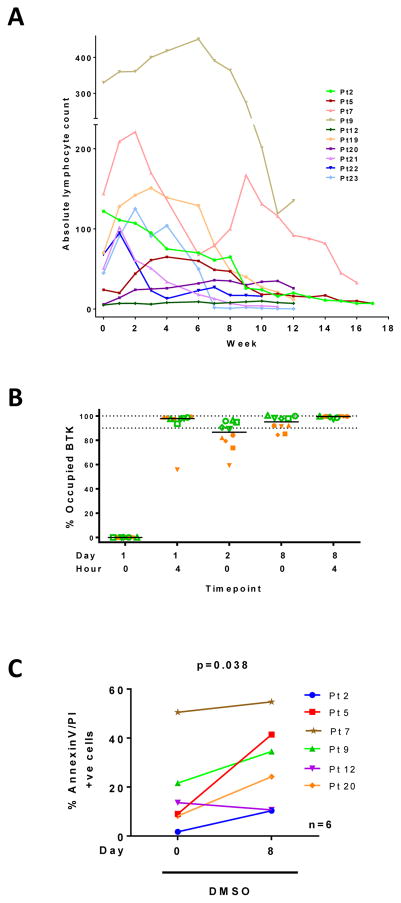
Clinical studies with ibrutinib and acalabrutinib have shown onset of lymphocytosis, where a dramatic decrease in lymph node size is accompanied by an increase in CLL cell count in the peripheral blood. Absolute lymphocyte count was charted from patient samples used in pharmacodynamic assays. As shown in Figure 1A, the lymphocytosis profile varied among patients. At 4 hours post-dose at steady state (day 8) there is full BTK occupancy both for daily and BID cohorts. However at trough, patients who received bid dosing showed higher BTK occupancy (Figure 1B), which resulted in bid as the recommended schedule. To determine if circulating cells were sensitized after acalabrutinib therapy, PBMCs isolated at baseline (day 0) or after 8 days of therapy were incubated in culture for 24 hours. Cells at baseline showed heterogeneous levels of spontaneous apoptosis, which was generally increased in the day 8 sample (P = 0.038; Figure 1C). These data suggest that acalabrutinib therapy may prime CLL cells for apoptosis.
Figure 1. Biological changes in circulating lymphocytes pre and post-acalabrutinib therapy.
(A) Profile of lymphocytosis in ten patients with CLL on acalabrutinib. Cell numbers from peripheral blood were counted during therapy to obtain ALC. (B) BTK occupancy assay in ten subjects shown in 1A. Blood samples were obtained at indicated times and analyzed for BTK occupancy as described in the Methods. Green symbols represent twice a day administration while orange symbols are from patients who took the drug once daily. (C) Endogenous cell death in six patients prior to and after a week on acalabrutinib. CLL cells were isolated from peripheral blood samples obtained pre- and post-acalabrutinib and incubated in vitro in DMSO (vehicle only control) for 24 hours, stained with annexinV/PI, and positive cells counted using flow cytometer.
Acalabrutinib therapy is associated with decline in plasma chemokines CCL3 and CCL4
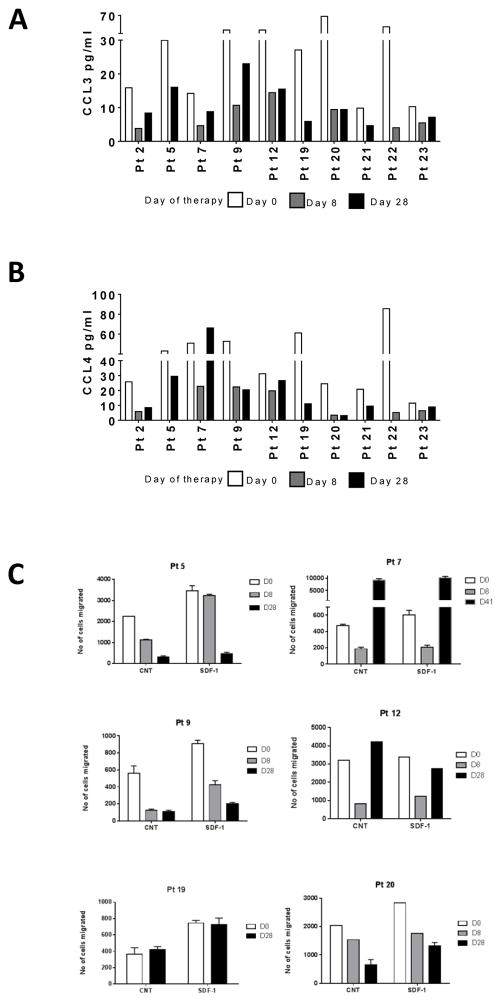
In response to BCR stimulation, CLL and other cells in the microenvironment secrete chemokines, and, conversely, inhibition of this pathway results in a decline in these chemo-attractants (17). The baseline plasma CCL3 and CCL4 levels in day 0 samples ranged between 10–68 pg/mL and 11–86 pg/mL, respectively (n = 10; Figure 2A–B). Acalabrutinib therapy generally decreased circulating plasma chemokines levels to 3–10 pg/mL and 4–22 pg/mL for CCL3, days 8 and 28, respectively, and 3–22 pg/mL and 3–29 pg/mL for CCL4, days 8 and 28, respectively. These data demonstrated that acalabrutinib therapy lowers circulating CCL3 and CCL4 levels.
Figure 2. Changes in chemokine levels and inhibition of chemotaxis during acalabrutinib therapy.
(A) Levels of CCL3 in plasma at baseline (day 0) and 8 and 28 days of therapy. (B) Levels of CCL4 in plasma at baseline and 8 and 28 days of therapy. Levels of chemokines were measured using ELISA assay as described in the Methods. (C) Changes in chemotaxis after acalabrutinib therapy. Lymphocytes were isolated from 6 patients before (day 0) and after days 8 and 28 of acalabrutinib therapy. Cells were incubated without (control [CNT]) or with chemokine (SDF-1) for 3 hours, and migration of cells was accessed as described in the Methods.
Acalabrutinib therapy is associated with inhibition of migration towards SDF-1
CXCR4 is highly expressed on the surface of CLL cells and mediates chemotaxis and migration towards SDF1 (CXCL12), which is secreted in a lymphatic microenvironment that promotes B cell homing within lymph tissue. CLL cells isolated at baseline exhibited increased migration towards SDF-1 in transwell migration experiments, compared with control (white bars; n = 6; Figure 2C). Interestingly, the migratory properties of CLL cells with or without SDF-1 were significantly reduced after therapy on day 8 compared with baseline (D0) samples (white bar versus grey bars in control and SDF-1 samples). This either continued or was reversed at day 28. In summary, acalabrutinib therapy mitigated CLL cell migratory capacity towards tissue-homing chemokines.
Proteomics after acalabrutinib therapy
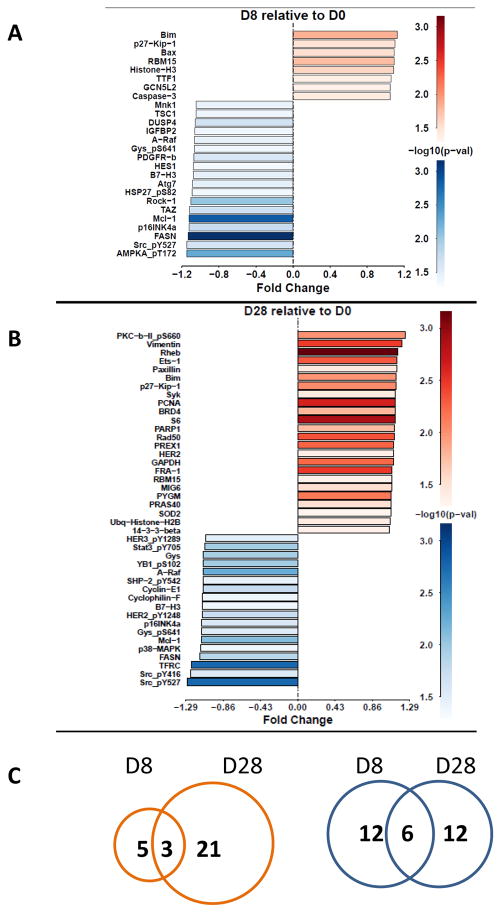
Among ~300 proteins from circulating CLL lymphocytes analyzed by the RPPA assay, acalabrutinib treatment significantly modified levels of 26 proteins after 1 week (Figure 3A), and 42 proteins after 4 weeks (Figure 3B). Changes were generally modest. The number of proteins showing elevated expression increased from 8 on day 8 of acalabrutinib therapy to 24 at 4 weeks of therapy; 3 of these showed increased expression at both time points (Figure 3C). Protein expression was decreased for 18 proteins on day 8 and 18 proteins on day 28, but only 6 of these overlapped at both time points (Figure 3C). In general, changes were observed in signaling molecules, cell cycle-related proteins, proteins involved in transcription, translation and metabolism, and Bcl-2 family proteins (Figure 3A–B). Some of these were upregulated (Supplementary Figure 1) while several others were decreased (Supplementary Figure 2).
Figure 3. Protein profiling in CLL cells before and after acalabrutinib therapy.
CLL lymphocytes were isolated at baseline (day 0) [D0] and after 8, 28, or 41 days (D8, D28, or D41), and protein extracts were prepared and analyzed for protein levels by the RPPA assay. (A–B) Protein expression profile after D8 and D28, respectively; statistically significant increases are shown in red while decreases are shown in blue. (C) Venn diagram depicts number of proteins that were increased on D8 and D28 shown in red and number of proteins that were decreased are shown in blue.
Acalabrutinib treatment inhibits the activation of BTK and decreases total BTK protein
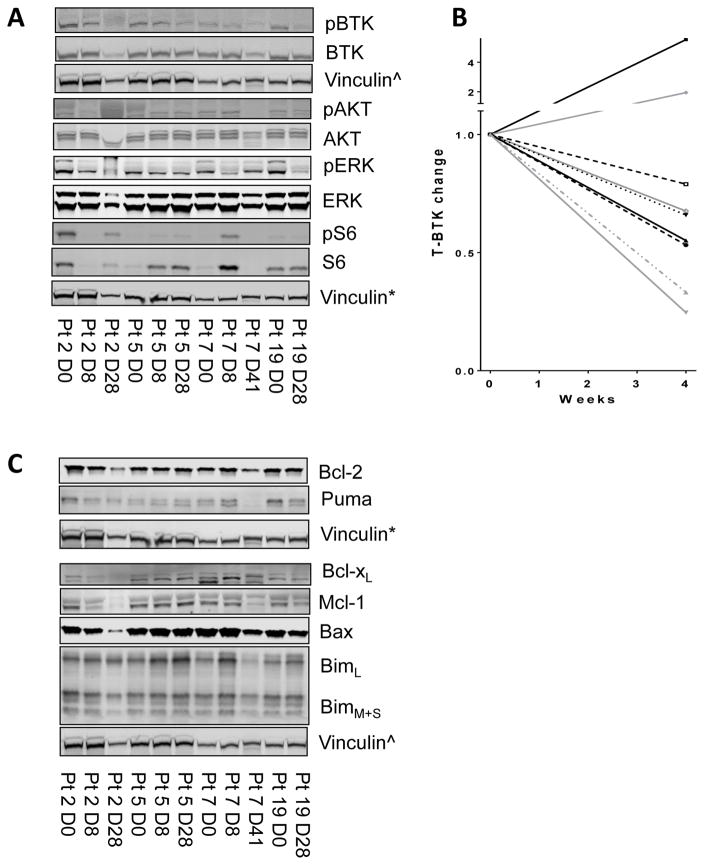
Among 15 proteins from the RPPA assay that were in the BCR axis, levels of total S6 were increased while phospho-S6 was decreased. Levels of p38-MAPK were significantly decreased while phospho-ERK showed a trend toward decline after 4 weeks of acalabrutinib (Supplementary Figure 3). BCR-associated kinases (BTK, AKT, ERK, and S6) and their activation were further evaluated using immunoblotting (n = 10; Figure 4A; Supplementary Figure 4). Quantitation data (ratio of phosphorylated protein to total) in day 8 and day 28 samples indicated significant inhibition of pBTK (Y223) (n = 8; P = 0.00006 and 0.001, respectively) and pS6 (S235/236) (n = 6; P = 0.007 and 0.95, respectively) (Supplementary Figure 5); however, no significant changes were seen in pAKT (Thr 308) (n = 6; P = 0.21 and 0.42, respectively) or pERK (T202/Y204) (n = 8; P = 0.26 and 0.67, respectively) (data not shown). In line with previous studies suggesting decrease in total BTK protein after ibrutinib therapy, 7 of 9 samples also showed decline after 4 weeks of acalabrutinib (Figure 4B).
Figure 4. Changes in BCR pathway protein levels and signaling in CLL cells before and after acalabrutinib therapy.
CLL lymphocytes were isolated at start (day 0) [D0] and after 8, 28, or 41 days (D8, D28, or D41), and protein extracts were prepared for immunoblots. (A) BCR signaling proteins in CLL cells before (D0) and post-acalabrutinib (D8, 28, or 41). (B) Quantitation of total BTK protein from patient samples (n = 9), normalized to vinculin. (C) Effect of acalabrutinib therapy on Bcl-2 family proteins. CLL cells were obtained before (D0) and post-therapy (D8, 28, or 41), and cell lysates were prepared for immunoblot assays in which expression levels of Bcl-2 family anti-apoptotic proteins Bcl-2, Mcl-1, Bcl-xL, Bax and Bim proteins were measured. The immunoblots presented in figure 4 (A and C) were obtained by running two gels. First one had total and phospho BTK and Bcl-xL, Mcl-1, Bax, Bim, and vinculin^. Second gel provided Bcl-2, Puma, total and phospho AKT, ERK, and S6, and vinculin*.
Acalabrutinib treatment modulates Bcl-2 family proteins
Our previous data with ibrutinib therapy showed changes in Bcl-2 family protein levels in CLL cells. We evaluated modulation of Bcl-2 family protein expression during acalabrutinib therapy using the RPPA assay (Supplementary Figure 6). Statistically significant changes were observed only in Mcl-1 and Bim proteins, with anti-apoptotic protein Mcl-1 decreased at both time points (Supplementary Figure 2, 7) and pro-apoptotic protein Bim increased at both time points (Supplementary Figure 1, 7). Quantitative immunoblot assays suggested a trend toward Mcl-1 decline on day 8 that did not reach statistical significance (n = 7; P = 0.137). There was an increase in Bim protein at both day 8 and day 28 time points (n = 8 and 9; P = 0.003 and 0.049, respectively) (Supplementary Figure 8). Bcl-2, the target protein for venetoclax, showed minor increases that were not statistically significant in both RPPA and immunoblot assays.
Pharmacological screening of acalabrutinib–treated CLL cells for potential combinations
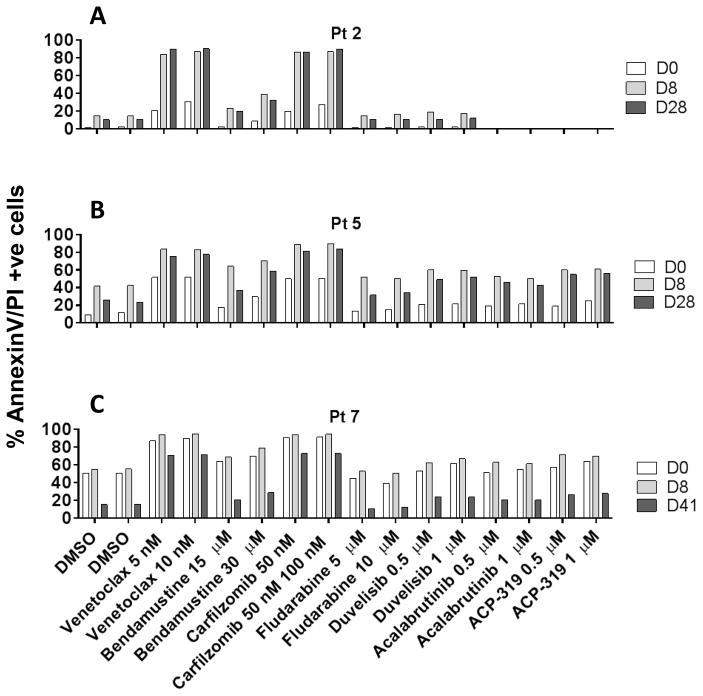
Acalabrutinib clinical trial data showed an overall response rate of 95% without any complete remissions at the less than 15 months follow-up time. This observation underscores a need for a second agent to achieve deeper responses which ultimately may lead to complete remission. We performed pharmacological profiling to identify suitable combination partners for acalabrutinib. CLL cells obtained from days 0, 8, and 28 were incubated with agents, such as venetoclax (Bcl-2 inhibitor), bendamustine (alkylating agent), carfilzomib (proteasome inhibitor), fludarabine (nucleoside analog), duvelisib (PI3K inhibitor), ACP-319 (PI3K delta inhibitor), or additional acalabrutinib for 24 hours. Of all agents screened, venetoclax and carfilzomib demonstrated enhanced apoptosis in day 8 and day 28 samples in comparison to day 0 samples (Figure 5A–C).
Figure 5. Pharmacological profile of CLL cells before and after acalabrutinib therapy.
(A–C). CLL lymphocytes were isolated from 3 patients at baseline (D0) and after 8 and 28 or 41 days (D8, D28 and D41) of acalabrutinib therapy. These cells were incubated with vehicle (DMSO) alone, or with drugs at indicated concentrations for 24 hours. Cells were stained with annexinV/PI and counted using a flow cytometer.
Venetoclax complements acalabrutinib–mediated apoptosis in CLL cells
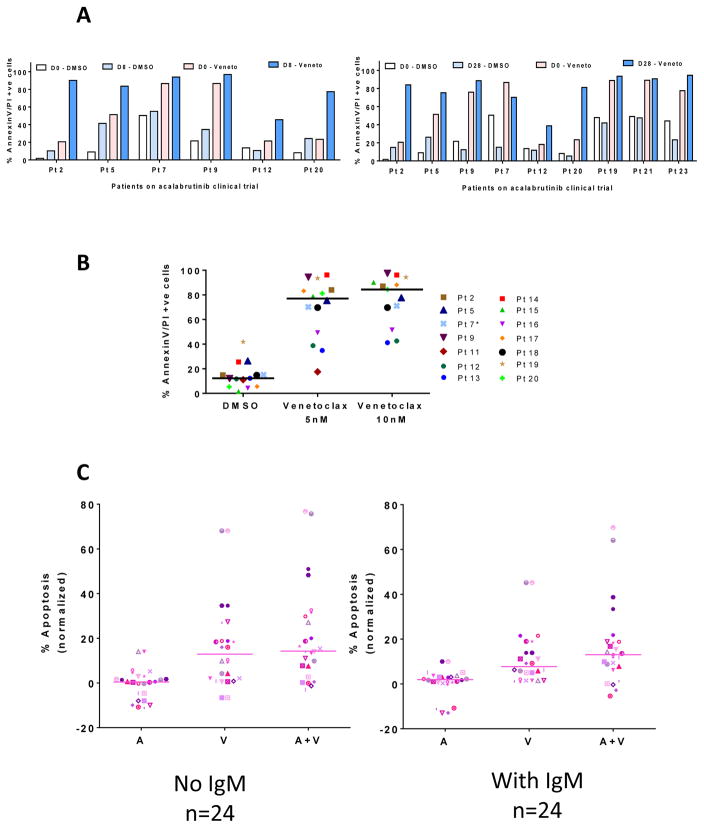
Data from pharmacological profiling indicated that venetoclax complements acalabrutinib–mediated apoptosis in CLL cells. Hence, additional samples were screened with venetoclax. Samples from patients treated with acalabrutinib for 8 days (n = 6; Figure 6A) or 28 days (n=9; Figure 6A) were incubated with 10 nM venetoclax. Venetoclax treatment resulted in similar or higher rates of apoptosis in acalabrutinib-treated samples, compared to pretreatment samples (Figure 6A). Additional samples obtained during day 28 (n=14) incubated with either 5 nM or 10 nM venetoclax also indicated considerable augmentation of apoptosis in these samples (Figure 6B).
Figure 6. Effect of venetoclax on cell death in CLL lymphocytes before and after acalabrutinib therapy.
CLL lymphocytes isolated from patients receiving acalabrutinib were incubated with vehicle (DMSO) or with venetoclax (Veneto) for 24 hours. Cells were stained with annexinV/PI and counted with a flow cytometer. (A) Patient samples after 8 (n = 6) or 28 days (n = 9) of acalabrutinib followed by ex vivo incubation with venetoclax. (B) Patient samples after 28 days of acalabrutinib, following subsequent incubation with vehicle (DMSO) or venetoclax. (C) In vitro cytotoxicity of nonstimulated or IgM-stimulated CLL lymphocytes treated with either single agent acalabrutinib (A), venetoclax (V), or both (A+V) for 24 hours; apoptosis measured by annexinV/PI binding assay (n = 24).
In vitro combination of acalabrutinib and venetoclax
To further test this combination, in vitro studies were conducted in patient samples (n = 24) before and after BCR activation with IgM. Acalabrutinib alone did not induce much cytotoxicity. Compared to either agent alone, combination of acalabrutinib with venetoclax resulted in higher rates of cell death (Figure 6C). Similar results were observed with ibrutinib (Supplemental Figure 9).
Preclinical studies in the TCL1-192 mouse model
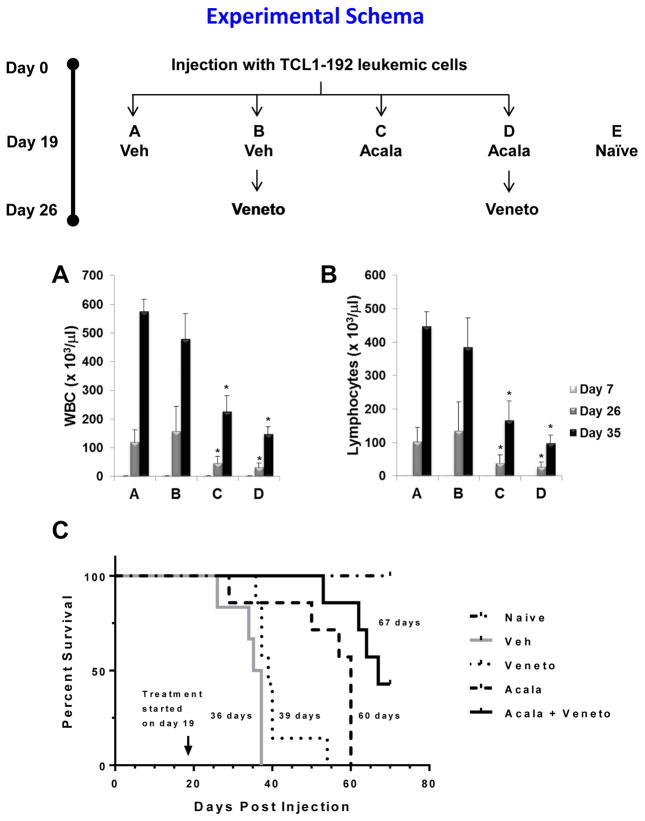
To evaluate the in vivo potency of acalabrutinib and venetoclax as single agents or in combination, we used the CLL TCL1-192 adoptive transfer mouse model (18). In the initial experiment, single agent and sequential combination (acalabrutinib followed by venetoclax) were tested. SCID mice injected with TCL1-192 leukemic cells received treatment with acalabrutinib on day 19 post-injection then venetoclax as a single agent or in combination with acalabrutinib on day 26 post-injection (see Schema, Figure 7). Mice were assessed for expansion of leukemic cells by evaluating white blood cell count and lymphocytes count in the peripheral blood. Mice treated with vehicle only were used as negative controls. Acalabrutinib as a single agent administered twice daily by gavage resulted in significant decrease in both white blood cell and lymphocyte counts (Figure 7A and B). Venetoclax alone had minor impact in leukemic expansion, but boosted the anti-leukemic effect of acalabrutinib (Figure 7A and B). Spleen weight had minor yet significant change with the acalabrutinib and venetoclax couplet (Supplemental Figure 10). Liver weight evaluation showed that attenuation of hepatomegaly was evident with single agent acalabrutinib but was further augmented with addition of venetoclax (Supplemental Figure 10). Other organs’ weight such as heart and kidney had minor or no change (Supplemental Figure 10). Histopathology evaluation of the liver by hematoxylin and eosin staining confirmed attenuation of leukemic cells infiltration in the liver of mice treated with acalabrutinib alone or in combination with venetoclax, despite reduced activity with single agent venetoclax (Supplemental Figure 11). Treatment with acalabrutinib increased survival (median survival was 60 days with acalabrutinib vs. 36 days for vehicle only) indicating in vivo therapeutic effectiveness of this BTK inhibitor (Figure 7C). Venetoclax alone, at this dose and schedule, had only marginal benefit (median survival was 39 days) (Figure 7C). Survival showed greatest prolongation when acalabrutinib was combined with venetoclax (median survival was 67 days with the combination) (Figure 7C) suggesting intensification of therapeutic response with this couplet treatment.
Figure 7. Acalabrutinib and venetoclax combination in the TCL1 adoptive transfer mouse model.
Experimental schema depicts that SCID mice (n = 40) were injected with CLL TCL1-192 leukemic cells on day 0. Post-injection of cells, the mice were randomly divided in 4 groups (n = 10 per group). On day 19 post-injection, the mice were treated with vehicle (Veh) or acalabrutinib (Acala) and on day 26 venetoclax (Veneto) was administrated as indicated. (A–B) Peripheral blood was drawn before and during treatment on day 7, day 26 and day 35 post-injection, and white blood cells (WBC; A) and lymphocytes (B) counts were assessed with an automated counter. (C) Kaplan-Meier survival curve analysis. Veh, vehicle; Acala, acalabrutinib; Veneto, venetoclax. Indicated days represent median survival. *P < 0.05 compared to vehicle.
Concurrent versus sequential in vivo combination in the TCL1-192 mouse model
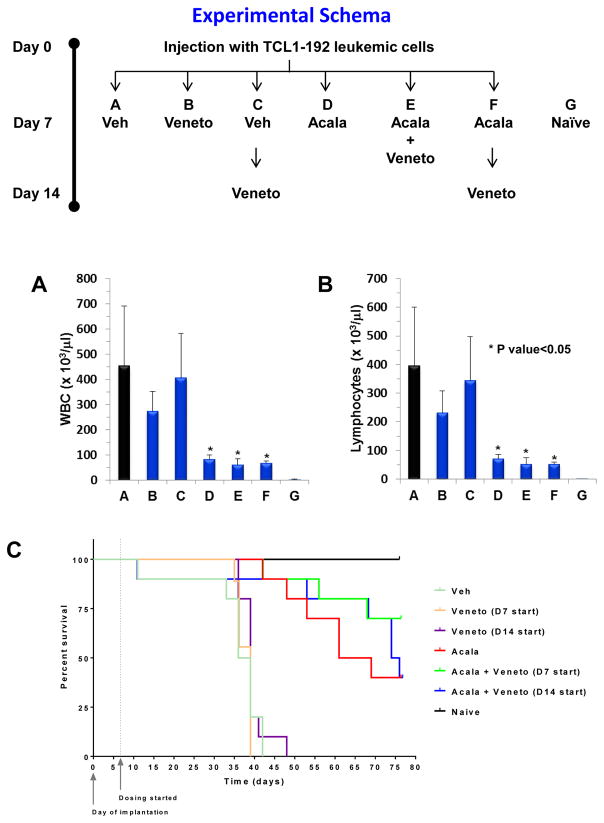
We next investigated the therapeutic benefit to administer acalabrutinib and venetoclax combination simultaneously versus sequentially in the TCL1-192 mouse model (see Schema, Figure 8). Additionally, in this experiment, treatment was started at day 7 and/or day 14 (see Schema, Figure 8) versus day 19 and day 26 (See Schema, Figure 7) post cell injection. Early treatment resulted in improved therapeutic benefit on leukemic expansion with acalabrutinib as a single agent or in combination with venetoclax both in sequential and simultaneous administration (Figure 8A–B vs Figure 7A–B). As compared to the first experiment (Supplemental Figure 10), early treatment resulted in significant attenuation of spleen weight with all agents (Supplemental Figure 12). However, only treatment with acalabrutinib as a single agent or in combination with venetoclax resulted in significant diminution of liver weight independently of venetoclax scheduling (Supplemental Figure 12). Early treatment did not improve survival of diseased mice with single agent (median survival was 39 days with venetoclax independent of sequential or simultaneous scheduling; 65 days with acalabrutinib) (Figure 8C). However, on day 77 post cell injection, end point of the study, simultaneously versus sequential combination therapy showed improved survival (Figure 8C). Correspondingly, 4 of 10 mice survived with acalabrutinib, 4 of 10 mice survived with sequential administration of acalabrutinib and venetoclax (D14 start), and 7 of 10 mice survived with simultaneous therapy of acalabrutinib and venetoclax (D7 start). These results confirmed the therapeutic advantages of combining acalabrutinib and venetoclax.
Figure 8. Acalabrutinib and venetoclax combination in the TCL1 adoptive transfer mouse model following different scheduling treatments.
Experimental schema depicts that SCID mice (n=90) were injected with CLL TCL1-192 on day 0 then divided into 6 groups (n=15). On day 7 and/or day 14, the indicated groups received vehicle (Veh), acalabrutinib (Acala), and/or venetoclax (Veneto). (A–B) On day 35, 2 SCID (naïve, G) mice, and 5 mice from each treatment group were sacrificed. Peripheral blood was drawn and white blood cells (WBC; A) and lymphocytes (B) counts were assessed with an automated counter. (C) Kaplan-Meier survival curve analysis of the 10 remaining mice for each group. Veh, vehicle; Acala, acalabrutinib; Veneto, venetoclax. *P < 0.05 compared to vehicle.
Discussion
Ibrutinib is a potent irreversible inhibitor of BTK with an IC50 value of 1.5 nM (Supplementary figure in ref 6). However, it also blunts the activity of 9 other kinases that have cysteine residues aligning with Cys481 of BTK, with IC50 < 8 nM (except Jak3, IC50 = 32 nM). Furthermore, it impedes several other enzymes, such as FGR, FYN, LCK, HCK, LYN, SRC and YES1, with IC50 < 30 nM (6). Compared to ibrutinib, acalabrutinib was less potent for inhibiting BTK (IC50 = 5.1 nM), but inhibited only ERBB4 and BMX at IC50 < 50 nM. The differences in kinase selectivity between ibrutinib and acalabrutinib are expected to impact their off-target and on-target effects.
Off- and on-target effects were analyzed in our previous investigations in primary CLL cells treated in vitro with the two agents (8). Data suggested modest yet comparable rates of cell death, accompanied by cleavage of PARP and caspase-3. Induction of cytokines, such as CCL3 and CCL4, and pseudoemperipolesis, were inhibited by both agents to a similar extent. BCR pathway signaling, including phosphorylation of BTK and downstream S6 and ERK kinases, were inhibited at parity by these agents when examined using immunoblot (8) or flow cytometry (19).
The recommended phase 2 dose of acalabrutinib is 100 mg BID. At this dose, the Cmax is around 825 ng/mL or 1.8 μM (n = 26), which was achieved approximately 1 hour after start of therapy. While the drug is eliminated with a half-life of 1 hour, the recommended BID dosing ensures maintenance of plasma concentrations that result in more than 95% BTK occupancy over the treatment interval and inhibition of BTK phosphorylation and activity in peripheral blood circulating CLL cells (5). This was also observed in samples used in the current study (Figure 1B).
Acalabrutinib therapy lowered CCL3 levels from 10–68 to 3–10 pg/mL by day 8. As reported previously, the corresponding values for ibrutinib are from 75 pg/mL to 5 pg/mL after 1 week of therapy. Similarly, CCL4 levels dropped from 25–50 pg/mL at baseline to 3–22 pg/mL after acalabrutinib. For ibrutinib, these values were 140 pg/mL at start and 17 pg/mL after 1 week. In general, the decline in both these chemokines by acalabrutinib was comparable to that of ibrutinib (20).
While on-target effects of both drugs were on par, off-target effects were dissimilar. For example, impairment of SRC-family kinases was more pronounced with ibrutinib than acalabrutinib in healthy T lymphocytes (8). With acalabrutinib, the number of T lymphocytes, NK cells, and monocytes were either not changed, fell only after 15 cycles, or decreased but reverted back to baseline during subsequent cycles (5). In contrast, ibrutinib either decreased the number or function of circulating T cells (21), NK cells (22), and monocytes (23, 24).
In the present work, we have provided comparison of on-target and off-target effects of ibrutinib and acalabrutinib in CLL cells and patients with CLL. It is important to mention that these evaluations and data are derived from different investigations. A true assessment in semblances of these two drugs can only occur with a two-arm randomized clinical trial where all other parameters are normalized. In fact, such clinical protocol is currently ongoing (NCT02477696) for patients with CLL.
Phase I and phase II clinical trials in CLL patients suggested that acalabrutinib was well tolerated and resulted in 95% overall response rate, but without complete remissions after a median follow-up of 14.3 months (5). High response rates with limited or no complete remissions have also been observed with ibrutinib (11). Failure of acalabrutinib or ibrutinib to induce complete remissions in patients with CLL without any BTK or downstream targets (such as PLC-γ) mutations indicate that other survival pathways may play a role in maintenance of CLL cells in body compartments, such as lymph node, bone marrow, and blood. Hence, approaches to blunt other survival nexuses represent a viable strategy.
Overexpression of Bcl-2 family pro-survival proteins is related to the most common cytogenetic abnormality in CLL, i.e., 13q deletions which result in loss of miR15-a and miR16-1, suppressors of Bcl-2 and Mcl-1 expression (25, 26). Bcl-2 family proteins, especially 3 anti-apoptotic members, Bcl-2, Mcl-1, and Bcl-xl, are established molecules that have been associated with survival of CLL cells (27). Further, these proteins are induced when CLL cells interact with signals from the microenvironment (28), which varies among different tissue homing niches (29). Such association of Bcl-2 proteins with CLL pathogenesis was the primary reason for development and design of small molecule antagonists to these proteins. Navitoclax targets both Bcl-2 and Bcl-XL (30) while venetoclax selectively neutralizes Bcl-2 (31).
Various approaches in the current paper have suggested that venetoclax complements acalabrutinib’s actions. In vitro incubations of both drugs in 24 samples suggested additive advantage of the combination (Figure 6C). Ex vivo incubation before and after acalabrutinib therapy was consistent with these data and showed benefit with venetoclax, compared to other agents (Figures 6A and 6B). Comparison of ex vivo cell death in vehicle-only treated cells further demonstrated that after acalabrutinib, CLL cells were sensitized to undergo apoptosis (Figure 1C). Finally, in vivo investigations in a TCL-1 adoptive transfer mouse model (Figure 7 and 8 and Supplemental Figures 10–12) showed a survival advantage with the combination, as well as reduction in disease burden in blood, liver, and spleen. Survival benefit along with a decline in proliferation and NF-κB signaling were also reported in these mice with acalabrutinib and ACP-319, a PI3K inhibitor (32) but not with acalabrutinib alone. Our data suggest that single agent acalabrutinib was also effective; the discrepancy may be due to the differences in drug administration routes. While we used twice a day gavage to apply acalabrutinib (15 mg/kg/administration), the previous work used ad lib approach of 25 mg/kg/d acalabrutinib in drinking water (32).
Although in general, the number of subjects per treatment was limited, our data from mice suggest that combination is more effective than single agent and early start to therapy results in better benefits. Finally, our in vivo data suggest that simultaneous and sequential combinations were both effective, however, a strong conclusion between these two sequences is difficult as number of days on therapy is different between sequential and simultaneous drug administration. Furthermore, in the clinic for humans, sequential drug therapy may be preferred to reduce potential tumor lysis syndrome from massive leukemia cell death.
While a detailed mechanism was beyond the scope of this investigation, proteomics array suggested that maintained or increased Bcl-2 with a concomitant dissipation of Mcl-1 protein may be partly responsible for the increase in venetoclax-induced cell death after acalabrutinib therapy. Our prior investigations during therapy of CLL with ibrutinib (33), idelalisib (34), or duvelisib (35) showed similar modulation in the levels of these two pro-survival proteins, further demonstrating that this alteration in protein levels may be a common feature of BCR pathway inhibitors. Our observations are in line with dynamic BH3 profiling data, which suggested Bcl-2 dependence of in vitro and in vivo ibrutinib- and acalabrutinib-treated CLL cells (36). PI3K/AKT cassette results in phosphorylation and inactivation of GSK3 enzyme, which is involved in phosphorylation of Mcl-1, priming it for proteasomal degradation (37, 38). The activity of GSK3 beta is high in quiescent cells (39). GSK3 also phosphorylates glycogen synthase (GYS) at S641 residue, which was decreased after acalabrutinib therapy (40). The changes in phospho-GYS levels as well as fatty acid synthase (FASN) further indicate modulation of CLL cell metabolomics after acalabrutinib therapy (Supplemental Figure 2).
In contrast to Mcl-1 and similar to our prior reports (33–35), an increase in Bim, a pro-apoptotic BH3 only protein, was observed after acalabrutinib therapy, a finding corroborated by Deng et al. (36). It is likely that this increase in Bim is mediated through transcription activation by the FOXO transcription factor, which is phosphorylated by Akt and results in its cytosolic sequestration. In line with this postulate, other FOXO targets, such as SOD2, p27, Ets-1, etc (41), were also significantly induced after acalabrutinib treatment (Figure 3B).
Decline in Mcl-1 and induction of Bim with acalabrutinib therapy may prime CLL cells for endogenous apoptosis, as well as apoptosis induced by neutralizing Bcl-2 protein by venetoclax. Since venetoclax is an already approved agent for treatment of CLL, this complementary effect is already being tested for ibrutinib and venetoclax in a clinical trial for patients with CLL (NCT02756897) and the differentiated safety profile of acalabrutinib warrants testing this BTK inhibitor with venetoclax.
Supplementary Material
Acknowledgments
Funding Source: This work was supported by a Sponsored Research Agreement from Acerta and philanthropic funds from the MD Anderson’s CLL Moon Shot program. MD Anderson Cancer Center is supported in part by the National Institutes of Health through Cancer Center Support Grant P30CA016672.
Authors are thankful to Ingrid Chou Koo, PhD, Team 9, for critically editing the manuscript and for her help with references; and to Ningping Feng, Xiaoyan Ma, Andy Zuniga and the in vivo pharmacology team at the Center for Co-Clinical Trials at MD Anderson Cancer Center for their expert assistance for in vivo experiments. Authors are grateful to Todd Covey and Allard Kaptein, Acerta Pharma for critically reviewing the manuscript and providing constructive scientific comments.
Footnotes
Conflict of Interest: V.G. and W.G.W. received research and clinical trial funding from Acerta. J.C. is an employee of Acerta. Other authors do not have a conflict of interest.
Author Contributions
V.K.P. designed and performed the experiments, analyzed the results, and wrote portion of the manuscript. B.L. established adoptive transfer mouse model and performed mice in vivo experiments and assays, wrote portion of the manuscript. M.L.A. assisted in experimental planning and performing immunoblots. J.G. performed in vivo experiments. J.C. did BTK occupancy assays at Acerta Pharma. K.B. directed CCL3/4 assays and wrote parts of the manuscript. C.I. analyzed RPPA data. J.M. as a summer student performed in vitro combination experiments. M.N. identified patient samples for in vitro studies and provided patient characteristics. M.J.K. and W.G.W. identified patients to obtain peripheral blood samples, provided clinical and patient-related input, and reviewed the manuscript. J.R.M. supervised mouse model investigations. V.G. conceptualized and supervised the research, obtained funding, analyzed the data, and wrote majority of the manuscript.
Publisher's Disclaimer: This is a PDF file of an unedited manuscript that has been accepted for publication. As a service to our customers we are providing this early version of the manuscript. The manuscript will undergo copyediting, typesetting, and review of the resulting proof before it is published in its final citable form. Please note that during the production process errors may be discovered which could affect the content, and all legal disclaimers that apply to the journal pertain.
References
- 1.Hendriks RW, Yuvaraj S, Kil LP. Targeting Bruton’s tyrosine kinase in B cell malignancies. Nat Rev Cancer. 2014;14(4):219–32. doi: 10.1038/nrc3702. [DOI] [PubMed] [Google Scholar]
- 2.Stevenson FK, Caligaris-Cappio F. Chronic lymphocytic leukemia: revelations from the B-cell receptor. Blood. 2004;103(12):4389–95. doi: 10.1182/blood-2003-12-4312. [DOI] [PubMed] [Google Scholar]
- 3.Ponader S, Burger JA. Bruton’s tyrosine kinase: from X-linked agammaglobulinemia toward targeted therapy for B-cell malignancies. J Clin Oncol. 2014;32(17):1830–9. doi: 10.1200/JCO.2013.53.1046. [DOI] [PMC free article] [PubMed] [Google Scholar]
- 4.Wiestner A. Emerging role of kinase-targeted strategies in chronic lymphocytic leukemia. Blood. 2012;120(24):4684–91. doi: 10.1182/blood-2012-05-423194. [DOI] [PMC free article] [PubMed] [Google Scholar]
- 5.Byrd JC, Harrington B, O’Brien S, Jones JA, Schuh A, Devereux S, et al. Acalabrutinib (ACP-196) in Relapsed Chronic Lymphocytic Leukemia. N Engl J Med. 2016;374(4):323–32. doi: 10.1056/NEJMoa1509981. [DOI] [PMC free article] [PubMed] [Google Scholar]
- 6.Honigberg LA, Smith AM, Sirisawad M, Verner E, Loury D, Chang B, et al. The Bruton tyrosine kinase inhibitor PCI-32765 blocks B-cell activation and is efficacious in models of autoimmune disease and B-cell malignancy. Proc Natl Acad Sci U S A. 2010;107(29):13075–80. doi: 10.1073/pnas.1004594107. [DOI] [PMC free article] [PubMed] [Google Scholar]
- 7.Herman SE, Gordon AL, Hertlein E, Ramanunni A, Zhang X, Jaglowski S, et al. Bruton tyrosine kinase represents a promising therapeutic target for treatment of chronic lymphocytic leukemia and is effectively targeted by PCI-32765. Blood. 2011;117(23):6287–96. doi: 10.1182/blood-2011-01-328484. [DOI] [PMC free article] [PubMed] [Google Scholar]
- 8.Patel V, Balakrishnan K, Bibikova E, Ayres M, Keating MJ, Wierda WG, et al. Comparison of Acalabrutinib, A Selective Bruton Tyrosine Kinase Inhibitor, with Ibrutinib in Chronic Lymphocytic Leukemia Cells. Clin Cancer Res. 2016 doi: 10.1158/1078-0432.CCR-16-1446. Epub ahead of print. [DOI] [PMC free article] [PubMed] [Google Scholar]
- 9.Dubovsky JA, Beckwith KA, Natarajan G, Woyach JA, Jaglowski S, Zhong Y, et al. Ibrutinib is an irreversible molecular inhibitor of ITK driving a Th1-selective pressure in T lymphocytes. Blood. 2013;122(15):2539–49. doi: 10.1182/blood-2013-06-507947. [DOI] [PMC free article] [PubMed] [Google Scholar]
- 10.Gao W, Wang M, Wang L, Lu H, Wu S, Dai B, et al. Selective antitumor activity of ibrutinib in EGFR-mutant non-small cell lung cancer cells. J Natl Cancer Inst. 2014;106(9) doi: 10.1093/jnci/dju204. [DOI] [PMC free article] [PubMed] [Google Scholar]
- 11.Byrd JC, Brown JR, O’Brien S, Barrientos JC, Kay NE, Reddy NM, et al. Ibrutinib versus ofatumumab in previously treated chronic lymphoid leukemia. N Engl J Med. 2014;371(3):213–23. doi: 10.1056/NEJMoa1400376. [DOI] [PMC free article] [PubMed] [Google Scholar]
- 12.O’Brien S, Furman RR, Coutre SE, Sharman JP, Burger JA, Blum KA, et al. Ibrutinib as initial therapy for elderly patients with chronic lymphocytic leukaemia or small lymphocytic lymphoma: an open-label, multicentre, phase 1b/2 trial. Lancet Oncol. 2014;15(1):48–58. doi: 10.1016/S1470-2045(13)70513-8. [DOI] [PMC free article] [PubMed] [Google Scholar]
- 13.O’Brien S, Jones JA, Coutre SE, Mato AR, Hillmen P, Tam C, et al. Ibrutinib for patients with relapsed or refractory chronic lymphocytic leukaemia with 17p deletion (RESONATE-17): a phase 2, open-label, multicentre study. Lancet Oncol. 2016;17(10):1409–18. doi: 10.1016/S1470-2045(16)30212-1. [DOI] [PubMed] [Google Scholar]
- 14.Burger JA, Tedeschi A, Barr PM, Robak T, Owen C, Ghia P, et al. Ibrutinib as Initial Therapy for Patients with Chronic Lymphocytic Leukemia. N Engl J Med. 2015;373(25):2425–37. doi: 10.1056/NEJMoa1509388. [DOI] [PMC free article] [PubMed] [Google Scholar]
- 15.Burger JA, Burger M, Kipps TJ. Chronic lymphocytic leukemia B cells express functional CXCR4 chemokine receptors that mediate spontaneous migration beneath bone marrow stromal cells. Blood. 1999;94(11):3658–67. [PubMed] [Google Scholar]
- 16.Balakrishnan K, Peluso M, Fu M, Rosin NY, Burger JA, Wierda WG, et al. The phosphoinositide-3-kinase (PI3K)-delta and gamma inhibitor, IPI-145 (Duvelisib), overcomes signals from the PI3K/AKT/S6 pathway and promotes apoptosis in CLL. Leukemia. 2015;29(9):1811–22. doi: 10.1038/leu.2015.105. [DOI] [PMC free article] [PubMed] [Google Scholar]
- 17.Burger JA, Quiroga MP, Hartmann E, Burkle A, Wierda WG, Keating MJ, et al. High-level expression of the T-cell chemokines CCL3 and CCL4 by chronic lymphocytic leukemia B cells in nurselike cell cocultures and after BCR stimulation. Blood. 2009;113(13):3050–8. doi: 10.1182/blood-2008-07-170415. [DOI] [PMC free article] [PubMed] [Google Scholar]
- 18.Chen SS, Batliwalla F, Holodick NE, Yan XJ, Yancopoulos S, Croce CM, et al. Autoantigen can promote progression to a more aggressive TCL1 leukemia by selecting variants with enhanced B-cell receptor signaling. Proc Natl Acad Sci U S A. 2013;110(16):E1500–7. doi: 10.1073/pnas.1300616110. [DOI] [PMC free article] [PubMed] [Google Scholar]
- 19.Herman SE, Mustafa RZ, Jones J, Wong DH, Farooqui M, Wiestner A. Treatment with Ibrutinib Inhibits BTK- and VLA-4-Dependent Adhesion of Chronic Lymphocytic Leukemia Cells In Vivo. Clin Cancer Res. 2015;21(20):4642–51. doi: 10.1158/1078-0432.CCR-15-0781. [DOI] [PMC free article] [PubMed] [Google Scholar]
- 20.Ponader S, Chen SS, Buggy JJ, Balakrishnan K, Gandhi V, Wierda WG, et al. The Bruton tyrosine kinase inhibitor PCI-32765 thwarts chronic lymphocytic leukemia cell survival and tissue homing in vitro and in vivo. Blood. 2012;119(5):1182–9. doi: 10.1182/blood-2011-10-386417. [DOI] [PMC free article] [PubMed] [Google Scholar]
- 21.Niemann CU, Herman SE, Maric I, Gomez-Rodriguez J, Biancotto A, Chang BY, et al. Disruption of in vivo Chronic Lymphocytic Leukemia Tumor-Microenvironment Interactions by Ibrutinib--Findings from an Investigator-Initiated Phase II Study. Clin Cancer Res. 2016;22(7):1572–82. doi: 10.1158/1078-0432.CCR-15-1965. [DOI] [PMC free article] [PubMed] [Google Scholar]
- 22.Kohrt HE, Sagiv-Barfi I, Rafiq S, Herman SE, Butchar JP, Cheney C, et al. Ibrutinib antagonizes rituximab-dependent NK cell-mediated cytotoxicity. Blood. 2014;123(12):1957–60. doi: 10.1182/blood-2014-01-547869. [DOI] [PMC free article] [PubMed] [Google Scholar]
- 23.Fiorcari S, Maffei R, Audrito V, Martinelli S, Ten Hacken E, Zucchini P, et al. Ibrutinib modifies the function of monocyte/macrophage population in chronic lymphocytic leukemia. Oncotarget. 2016;7(40):65968–81. doi: 10.18632/oncotarget.11782. [DOI] [PMC free article] [PubMed] [Google Scholar]
- 24.Ren L, Campbell A, Fang H, Gautam S, Elavazhagan S, Fatehchand K, et al. Analysis of the Effects of the Bruton’s tyrosine kinase (Btk) Inhibitor Ibrutinib on Monocyte Fcgamma Receptor (FcgammaR) Function. J Biol Chem. 2016;291(6):3043–52. doi: 10.1074/jbc.M115.687251. [DOI] [PMC free article] [PubMed] [Google Scholar]
- 25.Calin GA, Dumitru CD, Shimizu M, Bichi R, Zupo S, Noch E, et al. Frequent deletions and down-regulation of micro- RNA genes miR15 and miR16 at 13q14 in chronic lymphocytic leukemia. Proc Natl Acad Sci U S A. 2002;99(24):15524–9. doi: 10.1073/pnas.242606799. [DOI] [PMC free article] [PubMed] [Google Scholar]
- 26.Cimmino A, Calin GA, Fabbri M, Iorio MV, Ferracin M, Shimizu M, et al. miR-15 and miR-16 induce apoptosis by targeting BCL2. Proc Natl Acad Sci U S A. 2005;102(39):13944–9. doi: 10.1073/pnas.0506654102. [DOI] [PMC free article] [PubMed] [Google Scholar]
- 27.Kitada S, Andersen J, Akar S, Zapata JM, Takayama S, Krajewski S, et al. Expression of apoptosis-regulating proteins in chronic lymphocytic leukemia: correlations with In vitro and In vivo chemoresponses. Blood. 1998;91(9):3379–89. [PubMed] [Google Scholar]
- 28.Balakrishnan K, Burger JA, Fu M, Doifode T, Wierda WG, Gandhi V. Regulation of Mcl-1 expression in context to bone marrow stromal microenvironment in chronic lymphocytic leukemia. Neoplasia. 2014;16(12):1036–46. doi: 10.1016/j.neo.2014.10.002. [DOI] [PMC free article] [PubMed] [Google Scholar]
- 29.Herndon TM, Chen SS, Saba NS, Valdez J, Emson C, Gatmaitan M, et al. Direct in vivo evidence for increased proliferation of CLL cells in lymph nodes compared to bone marrow and peripheral blood. Leukemia. 2017 doi: 10.1038/leu.2017.11. [DOI] [PMC free article] [PubMed] [Google Scholar]
- 30.Oltersdorf T, Elmore SW, Shoemaker AR, Armstrong RC, Augeri DJ, Belli BA, et al. An inhibitor of Bcl-2 family proteins induces regression of solid tumours. Nature. 2005;435(7042):677–81. doi: 10.1038/nature03579. [DOI] [PubMed] [Google Scholar]
- 31.Souers AJ, Leverson JD, Boghaert ER, Ackler SL, Catron ND, Chen J, et al. ABT-199, a potent and selective BCL-2 inhibitor, achieves antitumor activity while sparing platelets. Nat Med. 2013;19(2):202–8. doi: 10.1038/nm.3048. [DOI] [PubMed] [Google Scholar]
- 32.Niemann CU, Mora-Jensen HI, Dadashian EL, Krantz F, Covey T, Chen SS, et al. Combined BTK and PI3Kdelta inhibition with acalabrutinib and ACP-319 improves survival and tumor control in CLL mouse model. Clin Cancer Res. 2017 doi: 10.1158/1078-0432.CCR-17-0650. [DOI] [PMC free article] [PubMed] [Google Scholar]
- 33.Cervantes-Gomez F, Lamothe B, Woyach JA, Wierda WG, Keating MJ, Balakrishnan K, et al. Pharmacological and Protein Profiling Suggests Venetoclax (ABT-199) as Optimal Partner with Ibrutinib in Chronic Lymphocytic Leukemia. Clin Cancer Res. 2015;21(16):3705–15. doi: 10.1158/1078-0432.CCR-14-2809. [DOI] [PMC free article] [PubMed] [Google Scholar]
- 34.Yang Q, Shah P, Korkut A, Fernandes SM, Hanna J, Brown JR, et al. Changes in Bcl-2 family protein profile during idelalisib therapy mimic those during duvelisib therapy in CLL lymphocytes. JCO Precision Oncology. doi: 10.1200/PO.17.00025. In Press. [DOI] [PMC free article] [PubMed] [Google Scholar]
- 35.Patel VM, Balakrishnan K, Douglas M, Tibbitts T, Xu EY, Kutok JL, et al. Duvelisib treatment is associated with altered expression of apoptotic regulators that helps in sensitization of chronic lymphocytic leukemia cells to venetoclax (ABT-199) Leukemia. 2017 doi: 10.1038/leu.2016.382. [DOI] [PMC free article] [PubMed] [Google Scholar]
- 36.Deng J, Isik E, Fernandes SM, Brown JR, Letai A, Davids MS. Bruton’s tyrosine kinase inhibition increases BCL-2 dependence and enhances sensitivity to venetoclax in chronic lymphocytic leukemia. Leukemia. 2017 doi: 10.1038/leu.2017.32. [DOI] [PMC free article] [PubMed] [Google Scholar]
- 37.Maurer U, Charvet C, Wagman AS, Dejardin E, Green DR. Glycogen synthase kinase-3 regulates mitochondrial outer membrane permeabilization and apoptosis by destabilization of MCL-1. Mol Cell. 2006;21(6):749–60. doi: 10.1016/j.molcel.2006.02.009. [DOI] [PubMed] [Google Scholar]
- 38.Xu C, Kim NG, Gumbiner BM. Regulation of protein stability by GSK3 mediated phosphorylation. Cell Cycle. 2009;8(24):4032–9. doi: 10.4161/cc.8.24.10111. [DOI] [PMC free article] [PubMed] [Google Scholar]
- 39.Kang T, Wei Y, Honaker Y, Yamaguchi H, Appella E, Hung MC, et al. GSK-3 beta targets Cdc25A for ubiquitin-mediated proteolysis, and GSK-3 beta inactivation correlates with Cdc25A overproduction in human cancers. Cancer Cell. 2008;13(1):36–47. doi: 10.1016/j.ccr.2007.12.002. [DOI] [PMC free article] [PubMed] [Google Scholar]
- 40.Bhanot H, Reddy MM, Nonami A, Weisberg EL, Bonal D, Kirschmeier PT, et al. Pathological glycogenesis through glycogen synthase 1 and suppression of excessive AMP kinase activity in myeloid leukemia cells. Leukemia. 2015;29(7):1555–63. doi: 10.1038/leu.2015.46. [DOI] [PMC free article] [PubMed] [Google Scholar]
- 41.Greer EL, Brunet A. FOXO transcription factors at the interface between longevity and tumor suppression. Oncogene. 2005;24(50):7410–25. doi: 10.1038/sj.onc.1209086. [DOI] [PubMed] [Google Scholar]
Associated Data
This section collects any data citations, data availability statements, or supplementary materials included in this article.


