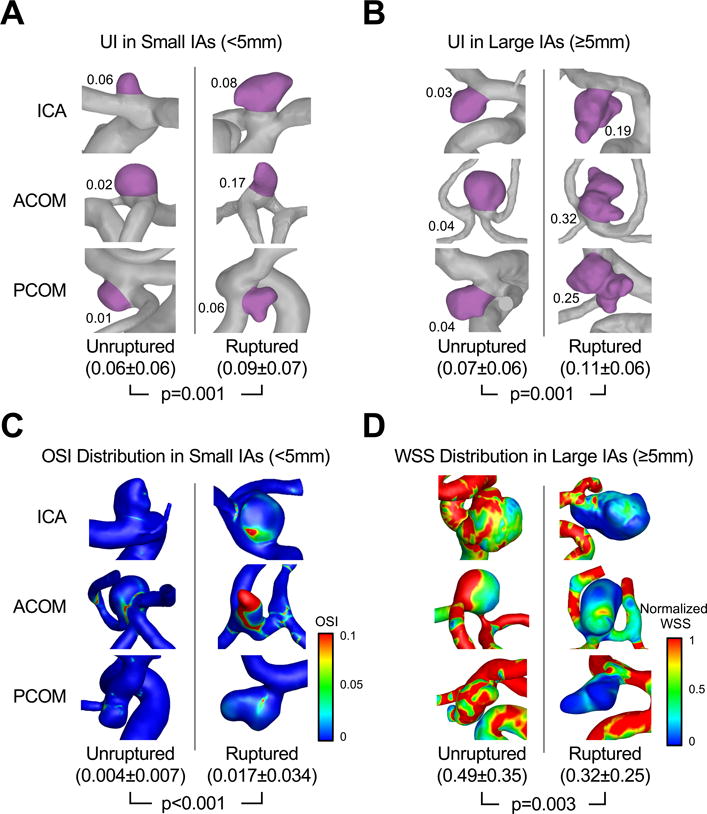
Figure 3.

Representative unruptured and ruptured IAs with statistics for all 269 small and 144 large IAs in the training cohort. The aneurysm sac was highlighted to illustrate UI (significant for both small and large IAs) in (A) small IAs and (B) large IAs. (C) OSI distributions in small IAs. (D) Normalized WSS distributions in large IAs.
