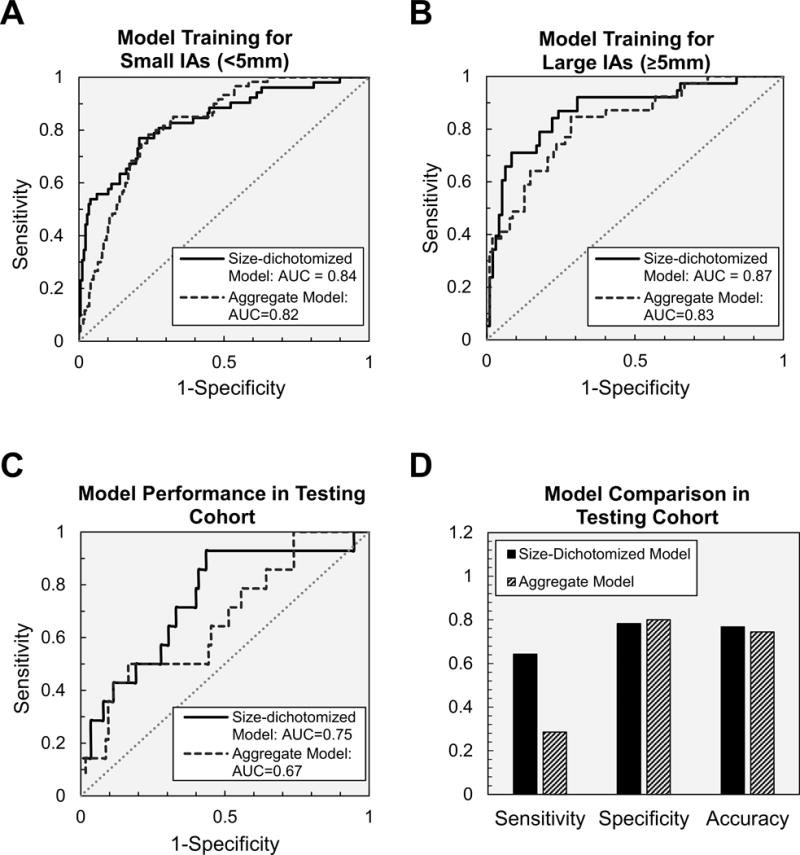
Figure 4.

ROC analysis of size-dichotomized and aggregate models for (A) small IAs and (B) large IAs in the training cohort. (C) Model performance in the testing cohort showing the higher AUC of the size-dichotomized model compared to the aggregate model. (D) The size-dichotomized model also had higher sensitivity, and accuracy compared to the aggregate model.
