

Abstract
Objective
Exercise is the recommended treatment for knee osteoarthritis (OA). However, heterogeneous patterns in treatment response are poorly understood. Our purpose was to identify pain and functional trajectories from exercise interventions in knee OA, and to determine their association with baseline factors.
Methods
Prospective cohort of 171 participants (mean age 61 years; BMI 32kg/m2, 71% female; 57% white) with symptomatic knee OA from a randomized trial comparing 12-week Tai Chi and Physical Therapy. We analyzed weekly Western Ontario and McMaster Osteoarthritis Index (WOMAC) pain (0–500) and function (0–1700) scores using group-based trajectory models. Associations between baseline factors and trajectories were examined using multinomial logistic regression.
Results
We identified four pain trajectories: Lower-Early Improvement (43%), Moderate-Early Improvement (32%), Higher-Delayed Improvement (15%), and Higher-No Improvement (10%). We found similar trajectories for function, except that the lower function trajectories diverged into gradual (12%) or delayed-improvement (15%). Compared with the Lower-Early Improvement pain trajectory, moderate and higher trajectories were associated with poorer physical and psychosocial health. A similar pattern of associations were found among the function trajectories.
Conclusions
We found four distinct trajectories for pain and function over up to 12-weeks of exercise interventions. While most participants experienced improvements over a short-term exposure, subgroups with greater baseline pain/physical disability had either gradual, delayed, or no improvements. These findings help disentangle the heterogeneity of treatment response and may advance patient-centered care in knee OA.
Keywords: Osteoarthritis, Treatment Response, Tai Chi, Physical Therapy, Exercise Interventions, Trajectory
INTRODUCTION
Symptomatic knee osteoarthritis (OA) is a leading cause of chronic pain and functional disability among older adults worldwide1. Exercise is strongly recommended for the conservative treatment of all patients2. However, there is little evidence to formulate patient-centered exercise programs given the heterogeneity in treatment response3,4. This has contributed to an underutilization of prescriptive exercise by clinicians and poor exercise adherence by patients5–12.
Treatment effects of exercise are commonly described as average change in pain/physical function among all participants. Moreover, prior studies have found baseline factors (e.g. muscle strength, depressive symptoms, etc.) that predict response after intervention13. However, by analyzing frequently-measured short-term outcomes, group-based trajectory modeling can ascertain patterns of longitudinal change over increasing treatment exposure. This knowledge may help to identify patients that require proactive monitoring to encourage better adherence and confirm treatment progression; or patients that do not respond to exercise intervention. Observational studies have explored long-term trajectories of pain and function over several years in OA14–17. In addition, interventional studies have examined short-term trajectories in response to surgery18,19. To date, however, pain and functional trajectory patterns remain unknown among patients receiving exercise interventions.
Therefore, the aims of this study were (1) to identify subgroups of individuals with symptomatic knee OA who have similar trajectories in pain and physical function over up to 12 weeks of exercise exposure; (2) to characterize those participants and their pain and functional trajectories; and (3) to explore the associations of pain and functional trajectories with baseline factors of health. We hypothesized that multiple trajectory patterns exist among participants with symptomatic, radiographic knee OA. These results may identify novel patient phenotypes and help contextualize the heterogeneous treatment responses commonly observed among these patients.
METHODS
Study design
This was a secondary analysis of a National Institutes of Health-funded, single-blind, randomized trial comparing Tai Chi and Physical Therapy among adults with symptomatic knee OA (Trial Registry #NCT01258985). As no difference was detected for pain and function between the two intervention groups in the primary trial, we have combined them together for this study to increase the power and precision of the analysis. In addition, we found that intervention-specific trajectories were predominantly similar for both pain and function (Supplementary Figure 1). Detailed descriptions of the methodology, protocol, and primary results for this trial have been previously published20,21.
Inclusion criteria were: 1) age ≥ 40 years, 2) fulfillment of the American College of Rheumatology criteria for symptomatic knee OA, and 3) Western Ontario and McMaster Osteoarthritis Index (WOMAC) pain score ≥40/100 on at least 1 of 5 questions. Exclusion criteria were: 1) prior experience with complementary medicine or Physical Therapy programs for knee OA within the past year, 2) severe medical limitations precluding full participation, 3) intra-articular steroid injections or surgery in the prior three months, 4) intra-articular hyaluronic acid injections in the prior six months, 5) Mini-Mental Status examination score <24, or 6) inability to walk without an assistive device.
Participants were randomly assigned in a 1:1 ratio to either 12-weeks of Tai Chi or Physical Therapy. The physical function assessors were blinded to the treatment assignments during enrollment, and did not have access to the data until collection was complete. All participants signed an informed consent form before enrollment and the study was approved by the Tufts University/Tufts Medical Center Institutional Review Board. In order to provide an adequate number of data points for trajectory analysis22, we only included participants who had at least 3 total visits: their first week of class and at least two additional weeks of attendance.
Interventions
The 60-minute Tai Chi sessions occurred twice per week for 12 weeks. We recruited 3 experienced Tai Chi instructors and developed a standardized classical Yang-style Tai Chi protocol for knee OA that was based on the literature23. Before study initiation, the principal investigator and the Tai Chi master (who was also 1 of the 3 instructors) reviewed the concepts of knee OA and trained the other instructors on the standardized delivery of the classical Yang-style Tai Chi protocol. In the first session, participants received printed materials on Tai Chi principles, practice techniques, and safety precautions. The instructor explained mind–body exercise theory and procedures. Subsequent sessions started with a warm-up and a review of Tai Chi principles and movement, breathing techniques, and relaxation methods20.
The physical therapy protocol followed U.S. guidelines for knee OA treatment24 and consisted of two 30-minute outpatient sessions per week for 6 weeks. Before enrollment, the supervising physical therapist trained 3 physical therapists, observed evaluations and interventions during each treatment cycle to ensure consistency in documentation, and provided feedback for program progression. Depending on the diagnostic findings in the initial musculoskeletal examination, the therapist targeted physical therapy regimens to address specific treatment goals developed collaboratively with the participant. At each session, the physical therapist examined the participant for adverse signs and symptoms before proceeding with manual therapy or exercise. After 6 weeks, participants were instructed to continue exercises in 30-minute sessions 4 times per week for 6 weeks. These were monitored weekly by telephone by using standardized forms to ascertain frequency, exercises completed, adverse events, and adherence20. Throughout both interventions, participants were asked to practice for at least 20 minutes daily at home.
Weekly Measures
The WOMAC is a validated, visual analogue scale that measures pain intensity and functional disability in OA25. Participants completed the WOMAC at the beginning of the first attended-session of each week. During the home-exercise portion of the Physical Therapy intervention, WOMAC data were collected during weekly monitoring phone calls by study staff. Baseline measurements were collected at screening, prior to randomization. For baseline WOMAC scores, however, the post-randomization data (collected at their first session) was used in this analysis to mitigate the influence of self-inclusion bias and regression to the mean.
Baseline Measures
The Patient Global Assessment is a single-item visual analog scale that measures patient-perceived global health26. The Short Form-36 measures health-related quality of life and consists of 36 questions related to eight dimensions of health27. In this analysis, the Mental Health and Energy and Vitality subscales were used to complement domains already measured in other instruments. Scores were also combined to obtain two aggregate scores: Physical Component Summary and Mental Component Summary scores. The Patient-Reported Outcomes Measurement Information Systems Sleep Disturbance Short Form measures sleep quality, sleep depth, and sleep restoration28. The Beck Depression Inventory, second edition, measures depressive symptom severity29. The Perceived Stress Scale measures the degree to which situations are appraised as uncontrollable/overwhelming30. The Arthritis Self-Efficacy Scale-8 measures self-efficacy, the belief that one can successfully take action to produce a desired outcome31. The Outcome Expectations for Exercise Scale measures perceived benefits of exercise among older adults32. The Medical Outcomes Study Social Support Survey measures functional social support in community-dwelling, chronically-ill persons33. The Six-minute Walk Test measures functional exercise capacity34 by having participants walk as far as possible within a six-minute period. The 20-Meter Walk Test measures gait speed,35 in seconds, over 20 meters. The Berg Balance Scale is a performance-based test of balance36. Described in further detail elsewhere37, leg extensor muscle strength was assessed according to bilateral leg-press apparatus using the one-repetition maximum technique. Leg extensor peak muscle power and peak contraction velocities were subsequently measured after a 5-minute rest. Briefly, each participant completed a total of 5 repetitions, each separated by 30 seconds, as quickly as possible through their full ROM at 40% and then at 70% of the one-repetition maximum. The highest measured power output (measured in watts) and corresponding contraction velocity (meters/second) were recorded. Baseline radiographic knee alignment of participants was measured by one reader using anatomic axis on weight-bearing semi-flexed antero-posterior knee radiographs according to previously validated methods (Intra-rater reliability ICC [3,1 model] = 0.94)38. We adjusted anatomic axis measures by sex (female, −3.5°; male, −6.4°) to better reflect mechanical axis and categorized them using standard definitions: valgus (>182°), normal (178 to 182°), or varus (<178°).
Statistical Analysis
Descriptive statistics were computed for baseline variables and presented as mean± SD unless otherwise stated. In this investigation, time was defined according to treatment duration, measured as the number of weeks attended, i.e. attendance-weeks, which is concordant with those used in related-Cochrane Reviews to quantify exercise dosage as a function of treatment duration39. Time was defined in this manner in order to investigate the trajectories of pain and function as a function of exercise exposure vs. a function of time.
Group-based trajectory models utilizing the PROC TRAJ macro in SAS were used to identify subgroups within the participant cohort that share a similar underlying trajectory in pain or function40. We did not pre-specify cutpoints or trajectory groups, but allowed PROC TRAJ to find the best trajectories based on the data. Following the recommended methodology, the number of trajectory groups was varied until the best-fitting model was obtained as indicated by the Bayesian Information Criterion (values closest to zero indicate the best fitting model)40–42. We modeled intercept linear, quadratic, or cubic polynomial terms for each trajectory and optimized the final model by removing non-significant polynomial terms. Before final optimization, we required the smallest trajectory group to include at least 10% of the participant sample to exclude groups with reduced interpretability or power, which is concordant with the approach used in prior studies22. If a group had less than 10% of the sample, the number of groups was reduced and the analysis was re-run. Thus, all participants were placed into one of the trajectories. To check robustness of the final optimized models, we used the posterior probabilities of group membership from each individual to assess the fit of the models22. High probability of membership into a single group represents a good model fit. After the final optimization, we applied descriptive labels to each of the trajectories, based on the shape of the trajectory.
We used multinomial logistic regression to examine the association of baseline factors with the probability of membership in one of the trajectories. A list of baseline variables was selected prior to analyses from among domains that were associated with exercise treatment outcomes in the OA literature. We also considered variables that could conceptually or biologically influence treatment response from exercise. As we were looking at potential associations and not aiming to make any causal inference between pain trajectories and baseline variables, we performed univariate analyses. Analyses were adjusted for age, sex, and BMI. All continuous variables were checked for a linear association with the outcome, and continuous variables violating this assumption were dichotomized according to clinically-relevant cut-points. Clinically relevant cut-points used to dichotomize continuous variables that violated the assumption of linearity: 1) Short Form-36 Physical Component Summary- a 40 point score represents 1 full SD below the general population average27. 2) Community Healthy Activities Model Program for Seniors (CHAMPS)- 1123.3 mod-high calories/week are expended by older adults when completing the 150 minutes of weekly physical activity recommended by the American Heart Association and the American College of Sports Medicine43. 3) 20-Meter Walk Test- Because gait speeds <1 meter/second (i.e. ≥20 seconds) identify a high risk of poor health-related outcomes in well-functioning older adults44. 4) The Berg Balance Scale- Scores <50 points are associated with a history of falls among the elderly45. 5) Leg extensor peak muscle power- Average muscle power among mobility-limited older adults is 228 watts46. Threshold for statistical significance was a global test p≤0.05. If the global test was not significant for a given variable, the pairwise comparisons were not assessed. All data were analyzed using SAS statistical software (SAS Institute Inc., Cary, NC, version 9.4). Due to the hypothesis-generating nature of this investigation, analyses were not adjusted for multiple comparisons.
RESULTS
There were 171 participants from the parent trial who met inclusion criteria for this analysis (attended both their first week of class and at least 2 additional weeks). These participants were predominantly female (71%), white (57%), had some post-secondary education (84%), and normal radiographic alignment (46%). Mean age was 61±10 years and BMI was 32±7kg/m2. According to baseline factors that significantly distinguished trajectories, the 33 excluded participants from the parent trial were generally similar to participants included in this analysis, except that the excluded group had a relatively larger proportion of black participants, more people with diabetes, and lower scores in the physical component of SF-36 (Table 1). Time constraints were a common reason why participants stopped attending the intervention.
Table 1.
Baseline Characteristics of All Participants and Excluded Participants
| Characteristic | Total n= 171 |
Excluded Parent Trial Participants† n =33 |
|
|---|---|---|---|
| Demographic | |||
|
| |||
| Age, years | 60.8±10.4 | 57.2±10.2 | |
|
| |||
| Female Sex, n (%) | 122 (71.4) | 21 (63.6) | |
|
| |||
| Race, n (%) | |||
| Black | 54 (31.6) | 18 (54.6) | |
| Other | 117(68.4) | 15(45.4) | |
|
| |||
| Body Mass Index, kg/m2 | 32.4±7.0 | 34.6±7.9 | |
|
| |||
| Duration of knee pain, years | 8.3±10.6 | 8.3±6.8 | |
|
| |||
| Kellgren-Lawrence grade, n (%)¶ | |||
| 0–2 | 75 (45.2) | 13 (40.6) | |
| 3–4 | 91 (54.8) | 19 (59.4) | |
|
| |||
| Highest Level of Education, n (%) | |||
| High school Graduate or Less | 28 (16.4) | 6 (18.2) | |
| Some College or more | 143 (83.6) | 27 (81.8) | |
|
| |||
| Self-reported comorbidities, n (%) | |||
| Heart Disease | 13 (7.6) | 3 (9.1) | |
| Hypertension | 84 (49.1) | 18 (54.6) | |
| Diabetes | 27 (15.8) | 11 (33.3) | |
|
| |||
| Opioid Use, n (%) | 18 (10.8) | 5 (15.2) | |
|
| |||
| NSAID Use, n (%) | 100 (58.8) | 23 (71.9) | |
|
| |||
| Intervention assignment, n (%) Tai Chi | 93 (54.4) | 13 (39.4) | |
|
| |||
| Patient-Reported Physical Health | |||
|
| |||
| WOMAC Pain (Range: 0–500) |
214.2±109.0 | 238.7±100.1 | |
|
| |||
| WOMAC Physical Function (Range: 0–1700) |
740.6±372.6 | 804.8±368.5 | |
|
| |||
| Patient Global Assessment (Range: 0.0–10.0cm) |
5.1±2.2 | 5.7±2.2 | |
|
| |||
| SF-36 Physical Component Summary (Range: 0–100)# |
37.1±9.1 | 33.7±8.7 | |
|
| |||
| SF-36 Energy and Vitality (Range: 0–100)# |
57.0±19.3 | 55.9±16.0 | |
|
| |||
| CHAMPS Physical Activity mod-high calories/week# |
1496.2±1816.8 | 1143.4±1465.1 | |
|
| |||
| PROMIS Sleep Disturbance Short Form, v.8a (Range: T-score: 28.9–76.5) |
50.5±9.7 | 47.9±9.1 | |
|
| |||
| Physical Performance | |||
|
| |||
| 6-Minute Walk Test meters (Normal Range: 400–700)*# | 400.1±88.1 | 372.3±97.8 | |
|
| |||
| 20-Meter Walk Test, seconds | 18.7±5.3 | 20.4±5.3 | |
|
| |||
| Leg Extensor Muscle Strength** newtons#; 1RM | 974.3±395.1 | 1080.5±448.1 | |
|
| |||
| Muscle Contraction Velocity** meters/second (40% of 1RM)# | 0.5±0.2 | 0.5±0.2 | |
|
| |||
| Muscle Contraction Velocity** meters/second (70% of 1RM)# | 0.3±0.1 | 0.3±0.1 | |
|
| |||
| Muscle Power** watts (40% of 1RM)# | 265.9±166.4 | 300.0±210.8 | |
|
| |||
| Muscle Power** watts (70% of 1RM)# | 307.3±176.4 | 324.6±207.0 | |
|
| |||
| Berg Balance Score (Range: 0–56)# | 52.2±4.9 | 50.4±6.0 | |
|
| |||
| Psychosocial Health | |||
|
| |||
| SF-36 Mental Component Summary (Range: 0–100)# |
52.4±9.4 | 53.1±8.6 | |
|
| |||
| SF-Mental Health (Range: 0–100)# |
74.4±16.3 | 77.0±15.2 | |
|
| |||
| Beck-II Depression Inventory (Range: 0–63) |
7.7±8.6 | 7.2±8.9 | |
|
| |||
| Perceived Stress (Range: 0–40) |
13.4±6.9 | 12.5±7.3 | |
|
| |||
| MOS Social Support (Range: 19–95)# |
68.0±22.4 | 65.1±25.5 | |
|
| |||
| Arthritis Self-Efficacy Scale-8 (Range: 0–10)# |
6.2±2.1 | 6.4±2.2 | |
|
| |||
| Outcome Expectations (Range: 1.0–5.0)# |
3.9±0.6 | 3.9±0.8 | |
|
| |||
| Biomechanical Factors | |||
|
| |||
| Radiographic Leg Alignment‡, n (%) | |||
| Normal | 52 (45.6) | 14 (73.7) | |
| Malalignment | 62 (54.4) | 5 (26.3) | |
1RM= one-repetition maximum; CHAMPS= Community Healthy Activities Model Program for Seniors; MOS= Medical Outcomes Survey; PROMIS= Patient-Reported Outcomes Measurement Information Systems; SF-36= Short Form-36; WOMAC= Western Ontario and McMasters Osteoarthritis Index. All values are mean ± standard deviation, unless otherwise specified.
Osteophyte was confirmed in the patellofemoral joint region for those with Kellgren/Lawrence grade 0 or 1.
Normal range reported for the general population.
For muscle strength, power, and velocity, total n= 165 to 168: 86 to 88 for Tai Chi and 78 to 80 for Physical Therapy.
Participants were only included if they attended both their first week of class and ≥2 additional weeks.
For radiographic leg alignment, total n= 121: 62 for Tai Chi and 59 for Physical Therapy.
Higher score indicates greater health.
Pain Trajectories
We identified four trajectories of pain over 12 weeks (Figure 1A, Table 2). The Lower Pain, Early Improvement trajectory included the largest proportion of participants (43%), and was characterized by an initial WOMAC pain score of 139.2 points and a meaningful decline in pain (98.7 point reduction; minimally important difference for WOMAC pain = 85 points) that plateaus after 5 attended weeks47. 32% of participants were on a Moderate Pain, Early Improvement trajectory with an initial WOMAC pain score of 230.4 points and a decline in pain (98.6 point reduction) over 5 attendance-weeks. 15% of participants had a Higher Pain, Delayed Improvement trajectory characterized by higher initial levels of pain (329.5 points) and a small improvement through 4–5 attendance-weeks, but large improvements (159.6 point reduction) after attending 5 through 11 weeks of intervention. In contrast, around 10% of participants had a Higher Pain, No Improvement trajectory, characterized by higher initial levels of pain (317.7 points) without improvement throughout intervention.
Figure 1. Trajectories of Pain and Function during Interventions.
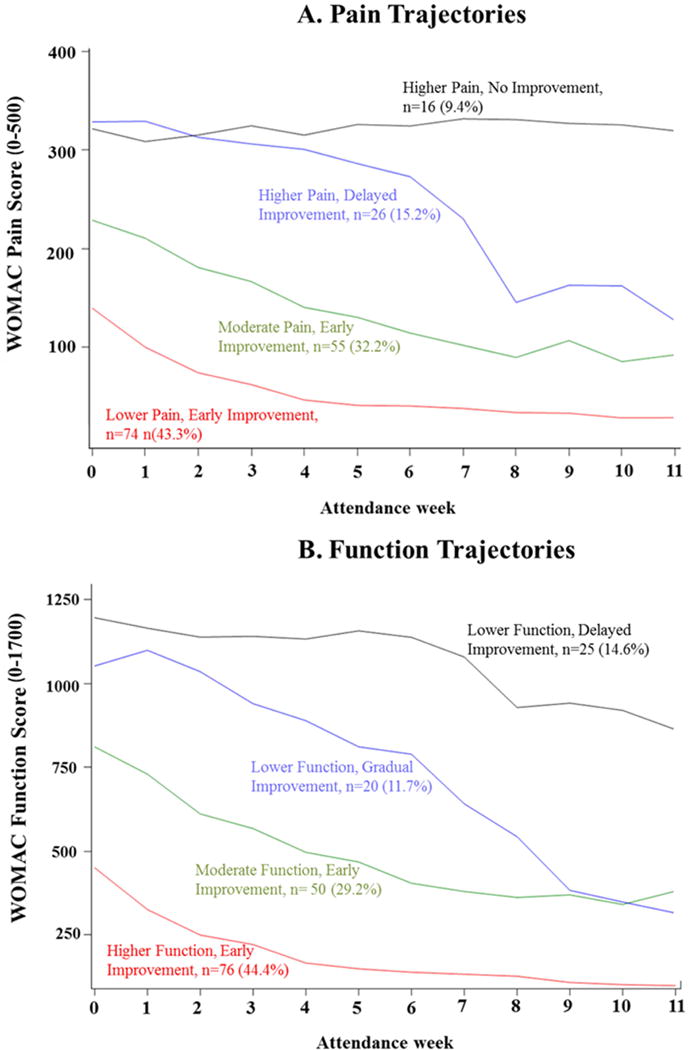
WOMAC= Western Ontario and McMasters Osteoarthritis Index. Panel A: Pain Trajectories. WOMAC Pain subscale range: 0–500, higher scores = greater pain. Panel B: Function Trajectories. WOMAC Function subscale range: 0–1700, higher scores = poorer physical function.
Table 2.
Baseline Characteristics of Participants Among Pain Trajectories
| Characteristic | Lower Pain, Early Improvement n= 74 |
Moderate Pain, Early Improvement n= 55 |
Higher Pain, Delayed Improvement n= 26 |
Higher Pain, No Improvement n= 16 |
Overall P value |
|---|---|---|---|---|---|
| Demographic | |||||
|
| |||||
| Race, n (%) | |||||
| Black | 13 (17.6) | 19 (34.6) | 12 (46.2) | 10 (62.5) | |
| Odds Ratio(vs. White and Others) | Reference | 2.17 (0.93, 5.08) | 2.84 (1.00, 8.06) | 6.92 (2.07, 23.09) | 0.01 |
| Duration of knee pain, years | 9.4±11.7 | 6.7±7.5 | 11.3±15.4 | 4.9±3.5 | |
| Odds Ratio (1 unit increase) | Reference | 0.98 (0.93, 1.02) | 1.03 (0.99, 1.07) | 0.91 (0.81, 1.03) | 0.10 |
|
| |||||
| Kellgren-Lawrence grade, n (%)¶ | |||||
| 3–4 | 34 (46.6) | 33 (62.3) | 16 (64.0) | 8 (53.3) | |
| Odds Ratio(vs. 0–2) | Reference | 1.89 (0.88, 4.07) | 2.05 (0.75, 5.60) | 1.67 (0.52, 5.37) | 0.32 |
|
| |||||
| Highest Level of Education, n (%) | |||||
| Some College or more | 65 (87.8) | 45 (81.8) | 23 (88.5) | 10 (62.5) | |
| Odds Ratio(vs. High school Graduate or Less) | Reference | 0.62 (0.23, 1.69) | 1.67 (0.32, 8.69) | 0.23 (0.07, 0.83) | 0.08 |
|
| |||||
| Self-reported comorbidities, n (%) | |||||
| Heart Disease | 6 (8.11) | 4 (7.3) | 2 (7.7) | 1 (6.3) | |
| Odds Ratio | Reference | 1.05 (0.26, 4.27) | 1.37 (0.23, 8.31) | 1.23 (0.12, 12.10) | 0.99 |
| Hypertension | 34 (46.0) | 33 (60.0) | 12 (46.2) | 5 (31.3) | |
| Odds Ratio | Reference | 1.78 (0.85, 3.73) | 0.96 (0.37, 2.50) | 0.63 (0.19, 2.08) | 0.26 |
| Diabetes | 11 (14.9) | 10 (18.2) | 3 (11.5) | 3 (18.8) | |
| Odds Ratio | Reference | 1.04 (0.40, 2.73) | 0.59 (0.15, 2.40) | 1.09 (0.26, 4.62) | 0.87 |
|
| |||||
| Opioid Use, n (%) | 7 (9.6) | 4 (7.6) | 4 (16.0) | 3 (18.8) | |
| Odds Ratio | Reference | 0.90 (0.24, 3.41) | 1.84 (0.40, 8.49) | 3.16 (0.66, 15.15) | 0.42 |
|
| |||||
| NSAID Use, n (%) | 39 (53.4) | 39 (70.9) | 15 (57.7) | 7 (43.8) | |
| Odds Ratio | Reference | 1.76 (0.81, 3.84) | 1.02 (0.38, 2.74) | 0.68 (0.22, 2.12) | 0.34 |
|
| |||||
| Intervention assignment | |||||
| Tai Chi | 35 (47.3) | 33 (60.0) | 16 (61.5) | 9 (56.3) | |
| Odds Ratio (vs. Physical Therapy) | Reference | 1.64 (0.80, 3.40) | 1.64 (0.63, 4.24) | 1.55 (0.51, 4.71) | 0.52 |
|
| |||||
| Patient-Reported Physical Health | |||||
|
| |||||
|
WOMAC Pain (Range: 0–500) |
139.2±72.4 | 230.4±81.2 | 329.5±94.4 | 317.7±85.6 | |
| Odds Ratio | ----- | ----- | ----- | ----- | |
|
| |||||
|
WOMAC Physical Function (Range: 0–1700) |
485.4±266.5 | 810.1±287.5 | 1081.8±335.4 | 1127.2±204.9 | |
| Odds Ratio (100 unit increase) | Reference | 1.54 (1.31, 1.82) | 2.21 (1.73, 2.82) | 2.32 (1.75, 3.08) | <0.0001 |
|
| |||||
| Patient Global | 4.0±1.9 | 5.4±2.0 | 7.0±1.2 | 6.1±2.4 | |
| Assessment (Range: 0.0–10.0cm) | |||||
| Odds Ratio (1 unit increase) | Reference | 1.37 (1.13, 1.66) | 2.32 (1.66, 3.23) | 1.65 (1.22, 2.23) | <0.0001 |
|
| |||||
| SF-36 Physical | 29(39.2) | 32(58.2) | 24(92.3) | 12(75.0) | |
|
Component Summary, n (%) <40 points (Range: 0–100)# Odds Ratio (vs. ≥40 points) |
Reference | 2.00 (0.96, 4.16) | 16.00 (3.44, 74.36) | 4.13 (1.19, 14.32) | 0.001 |
|
| |||||
|
SF-36 Energy and Vitality, (Range: 0–100)# |
63.0±18.8 | 56.4±17.1 | 47.5±20.3 | 46.9±17.3 | |
| Odds Ratio (10 unit increase) | Reference | 0.83 (0.67, 1.02) | 0.63 (0.48, 0.83) | 0.66 (0.49, 0.90) | 0.003 |
|
| |||||
| CHAMPS Physical | 34 (47.2) | 32 (60.4) | 14 (60.9) | 12 (75.0) | |
|
Activity, n (%) mod- high calories/week#<1123.3 Odds Ratio (vs. ≥1123.3) |
Reference | 1.49 (0.70, 3.18) | 1.39 (0.51, 3.79) | 3.15 (0.89, 11.14) | 0.31 |
|
| |||||
| PROMIS Sleep | 48.8±9.0 | 48.6±9.6 | 56.2±7.6 | 55.6±11.3 | |
|
Disturbance Short Form, v.8a (Range; T- score: 28.9–76.5) Odds Ratio (10 unit increase) |
Reference | 0.98 (0.66, 1.45) | 2.52 (1.41, 4.50) | 2.13 (1.12, 4.08) | 0.003 |
|
| |||||
| Physical Performance | |||||
|
| |||||
|
6-Minute Walk Test, meters (Normal Range: 400– 700)*# |
427.6±96.7 | 389.5±73.7 | 362.1±67.6 | 364.8±83.1 | |
| Odds Ratio (50 unit increase) | Reference | 0.76 (0.60, 0.97) | 0.58 (0.42, 0.81) | 0.60 (0.42, 0.85) | 0.003 |
|
| |||||
| 20-Meter Walk Test, n (%) | 57 (77.0) | 37 (67.3) | 14 (58.3) | 10 (62.5) | |
|
Seconds, <20 Odds Ratio(vs. ≥20) |
Reference | 0.57 (0.25, 1.30) | 0.35 (0.12, 1.00) | 0.39 (0.12, 1.31) | 0.17 |
|
| |||||
| Leg Extensor Muscle Strength**newtons#; 1RM | 1051.2±428.7 | 927.5±365.4 | 909.8±342.7 | 880.7±378.6 | |
| Odds Ratio (100 unit increase) | Reference | 0.83 (0.73, 0.95) | 0.78 (0.65, 0.94) | 0.84 (0.68 1.03) | 0.01 |
|
| |||||
| Muscle Contraction Velocity**meters/second (40% of 1RM)# | 0.5±0.2 | 0.5±0.2 | 0.4±0.2 | 0.4±0.2 | |
| Odds Ratio (0.1 unit increase) | Reference | 0.99 (0.78, 1.25) | 0.67 (0.48, 0.94) | 0.68 (0.47, 0.99) | 0.03 |
|
| |||||
| Muscle Contraction Velocity**meters/second (70% of 1RM)# | 0.4±0.1 | 0.3±0.1 | 0.3±0.1 | 0.3±0.1 | |
| Odds Ratio (0.1 unit increase) | Reference | 0.92 (0.67, 1.25) | 0.70 (0.45, 1.08) | 0.66 (0.41, 1.07) | 0.21 |
|
| |||||
| Muscle Power**, n (%) Watts, <228.4 (40% of 1RM)# | 29 (42.0) | 27 (50.9) | 12 (52.2) | 11 (68.8) | |
| Odds Ratio (vs. ≥228.4) | Reference | 1.83 (0.77, 4.36) | 2.16 (0.69, 6.83) | 4.25 (1.02, 17.67) | 0.17 |
|
| |||||
| Muscle Power**, n (%) Watts, <228.4 (70% of 1RM)# | 24 (34.8) | 19 (37.3) | 12 (54.6) | 10 (62.5) | |
| Odds Ratio (vs. ≥228.4) | Reference | 1.48 (0.62, 3.50) | 4.25 (1.32, 13.71) | 4.72 (1.25, 17.85) | 0.03 |
|
| |||||
| Berg Balance Score, n (%) ≤50 points (Range: 0–56)# | 10 (13.5) | 14 (25.5) | 10 (40.0) | 4 (25.0) | |
| Odds Ratio (vs. >50 points) | Reference | 2.31 (0.88, 6.06) | 5.30 (1.68, 16.67) | 3.01 (0.74, 12.17) | 0.04 |
|
| |||||
| Psychosocial Health | |||||
|
| |||||
| SF-36 Mental Component Summary (Range: 0–100)# | 54.1±8.5 | 52.4±10.4 | 49.2±9.4 | 50.0±8.4 | |
| Odds Ratio (10 unit increase) | Reference | 0.75 (0.49, 1.14) | 0.52 (0.31, 0.87) | 0.65 (0.36, 1.18) | 0.08 |
|
| |||||
| SF-Mental Health (Range: 0–100)# | 77.2±15.0 | 74.3±17.5 | 70.3±16.6 | 67.8±14.9 | |
| Odds Ratio (10 unit increase) | Reference | 0.85 (0.67, 1.08) | 0.73 (0.54, 0.98) | 0.73 (0.53, 1.01) | 0.12 |
|
| |||||
|
Beck-II Depression Inventory (Range: 0–63) |
6.1±7.3 | 7.8±9.5 | 10.2±8.5 | 11.1±9.7 | |
| Odds Ratio (1 unit increase) | Reference | 1.04 (0.99, 1.09) | 1.07 (1.01, 1.14) | 1.06 (1.00, 1.13) | 0.07 |
|
| |||||
|
Perceived Stress (Range: 0–40) |
12.6±6.4 | 12.3±7.7 | 15.1±6.2 | 17.9±5.7 | |
| Odds Ratio (1 unit increase) | Reference | 1.00 (0.95, 1.06) | 1.07 (1.00, 1.15) | 1.12 (1.02, 1.22) | 0.03 |
|
| |||||
|
MOS Social Support (Range: 19–95)# |
67.8±23.3 | 69.0±21.5 | 64.5±25.6 | 72.0±15.5 | |
| Odds Ratio (1 unit increase) | Reference | 1.00 (0.99, 1.02) | 0.99 (0.97, 1.01) | 1.01 (0.98, 1.04) | 0.64 |
|
| |||||
|
Arthritis Self-Efficacy Scale-8 (Range: 0–10)# |
6.9±1.9 | 6.1±2.1 | 5.3±1.8 | 4.5±2.3 | |
| Odds Ratio (1 unit increase) | Reference | 0.80 (0.65, 0.97) | 0.65 (0.50, 0.84) | 0.54 (0.39, 0.74) | 0.0002 |
|
| |||||
|
Outcome Expectations (Range: 1.0–5.0)# |
4.0±0.6 | 3.9±0.6 | 3.9±0.6 | 3.9±0.6 | |
| Odds Ratio (1 unit increase) | Reference | 1.03 (0.53, 2.01) | 1.11 (0.47, 2.61) | 0.95 (0.35, 2.59) | 0.99 |
|
| |||||
| Biomechanical Factors | |||||
|
| |||||
| Radiographic Leg Alignment‡, n (%) Malalignment | 26 (53.1) | 18 (48.7) | 10 (58.8) | 8 (72.7) | |
| Odds Ratio (vs. Normal) | Reference | 0.76 (0.31, 1.85) | 1.07 (0.33, 3.45) | 2.50 (0.58, 10.88) | 0.49 |
1RM= one-repetition maximum; CHAMPS= Community Healthy Activities Model Program for Seniors; MOS= Medical Outcomes Survey; PROMIS= Patient-Reported Outcomes Measurement Information Systems; SF-36= Short Form-36; WOMAC= Western Ontario and McMasters Osteoarthritis Index. All values are mean ± standard deviation, unless otherwise specified.
Osteophyte was confirmed in the patellofemoral joint region for those with Kellgren/Lawrence grade 0 or 1.
Normal range reported for the general population.
For muscle strength, power, and velocity, total n= 165 to 168: 86 to 88 for Tai Chi and 78 to 80 for Physical Therapy.
For radiographic leg alignment, total n= 121: 62 for Tai Chi and 59 for Physical Therapy.
Higher score indicates greater health.
Note: Odds ratios >1.00 favor the first category in dichotomized comparisons.
Functional Trajectories
We identified four trajectories of physical function over 12 weeks (Figure 1B, Table 3). The Higher Function, Early Improvement trajectory included the largest proportion of participants (44%), and was characterized by an initial WOMAC function score of 452.7 points and an improvement in function (301.8 point reduction) that plateaus after 5 attended weeks. 29% of participants were on a Moderate Function, Early Improvement trajectory that had a poorer initial WOMAC function score of 816.8 points and a similar improvement in function (407.4 point reduction) that plateaus after 6 attendance-weeks. 12% of participants had a Lower Function, Gradual Improvement trajectory characterized by high initial levels of functional disability (1064.7 points) and large improvements (737.7 point reduction) through 11 attendance-weeks. Finally, 15% of participants had a Lower Function, Delayed Improvement trajectory characterized by higher initial levels of functional disability (1204.0 points) and small improvements (117.4 point reduction) up to 7 attended weeks, but meaningful improvements (216.8 point reduction; minimally important difference for WOMAC function = 204 points)47 from attending 7 through 11 weeks of treatment.
Table 3.
Baseline Characteristics of Participants Among Physical Function Trajectories
| Characteristic | Higher Function, Early Improvement n=76 | Moderate Function, Early Improvement n= 50 | Lower Function, Gradual Improvement n= 20 | Lower Function, Delayed Improvement n= 25 | Overall P value |
|---|---|---|---|---|---|
| Demographic | |||||
| Race, n (%) | |||||
| Black | 12(15.8) | 21(42.0) | 6(30.0) | 15(60.0) | |
| Odds Ratio (vs. White and Others) | Reference | 3.61(1.51, 8.64) | 1.68(0.50, 5.59) | 7.22(2.55, 20.51) | 0.0009 |
| Duration of knee pain, years | 9.5±11.5 | 6.9±8.5 | 4.8±3.3 | 10.1±14.3 | |
| Odds Ratio (1 unit increase) | Reference | 0.98(0.93, 1.02) | 0.90(0.80, 1.02) | 1.01(0.97, 1.05) | 0.26 |
|
| |||||
| Kellgren- Lawrence grade, n (%)¶ | |||||
| 3-4 | 37(50.0) | 31(63.3) | 10(50.0) | 13(56.5) | 0.57 |
| Odds Ratio (vs. 0-2) | Reference | 1.51(0.69, 3.29) | 0.92(0.32, 2.63) | 1.66(0.61, 4.46) | |
|
| |||||
| Highest Level of Education, n (%) | |||||
| Some College or more | 70(92.1) | 37(74.0) | 18(90.0) | 18(72.0) | |
| Odds Ratio (vs. High school Graduate or Less) | Reference | 0.25(0.09, 0.74) | 0.80(0.14, 4.58) | 0.21(0.06, 0.71) | 0.02 |
|
| |||||
| Self-reported comorbidities, n (%) | |||||
| Heart Disease | 5(6.6) | 3(6.0) | 3(15.0) | 2(8.0) | |
| Odds Ratio | Reference | 0.99(0.21, 4.67) | 3.75(0.68, 20.77) | 2.34(0.38, 14.60) | 0.39 |
| Hypertension | 33(43.4) | 33(66.0) | 7(35.0) | 11(44.0) | |
| Odds Ratio | Reference | 2.39(1.11, 5.15) | 0.70(0.24, 2.05) | 1.18(0.46, 3.03) | 0.08 |
| Diabetes | 10(13.2) | 9(18.0) | 4(20.0) | 4(16.0) | |
| Odds Ratio | Reference | 1.31(0.48, 3.59) | 1.35(0.36, 5.03) | 1.02(0.28, 3.70) | 0.94 |
|
| |||||
| Opioid Use, n (%) | 4(5.33) | 8(16.7) | 3(15.8) | 3(12.0) | |
| Odds Ratio | Reference | 3.60(0.95, 13.71) | 5.09(0.93, 27.87) | 3.65(0.70, 18.98) | 0.18 |
|
| |||||
| NSAID Use, n (%) | 41(54.7) | 34(68.0) | 14(70.0) | 11(44.0) | |
| Odds Ratio | Reference | 1.60(0.73, 3.54) | 1.58(0.51, 4.87) | 0.63(0.24, 1.64) | 0.29 |
|
| |||||
| Intervention assignment | |||||
| Tai Chi | 36(47.4) | 33(66.0) | 10(50.0) | 14(56.0) | |
| Odds Ratio (vs. Physical Therapy) | Reference | 1.64(0.80, 3.40) | 1.64(0.63, 4.24) | 1.55(0.51, 4.71) | 0.52 |
|
| |||||
| Patient-Reported Physical Health | |||||
|
| |||||
| WOMAC Pain | 143.4±73.6 | 228.5±85.8 | 287.6±93.6 | 342.0±86.3 | |
| (Range: 0-500) | |||||
| Odds Ratio (50 unit increase) | Reference | 1.92(1.46, 2.54) | 2.85(1.94, 4.18) | 3.90(2.58, 5.88) | <0.0001 |
|
| |||||
| WOMAC Physical Function | 452.7±239.7 | 816.8±233.6 | 1064.7±262.1 | 1204.0±228.2 | |
| (Range: 0-1700) | |||||
| Odds Ratio | ----- | ----- | ----- | ----- | |
|
| |||||
| Patient Global Assessment | 4.2±2.1 | 5.5±1.8 | 6.0±2.1 | 6.6±2.1 | |
| (Range: 0.0-10.0cm) | |||||
| Odds Ratio (1 unit increase) | Reference | 1.33(1.10, 1.61) | 1.45(1.12, 1.89) | 1.84(1.40, 2.41) | <0.0001 |
|
| |||||
| SF-36 Physical | 25(32.9) | 35(70.0) | 17(85.0) | 20(80.0) | |
| Component Summary, n (%) <40 points (Range: 0-100)# | |||||
| Odds Ratio (vs. ≥40 points) | Reference | 4.47(2.03, 9.84) | 10.38(2.71, 39.70) | 7.70(2.54, 23.35) | <0.0001 |
|
| |||||
| SF-36 Energy and Vitality | 64.1±18.3 | 54.1±18.3 | 48.3±20.6 | 48.4±15.9 | |
| (Range: 0-100)# | |||||
| Odds Ratio (10 unit increase) | Reference | 0.72(0.57, 0.90) | 0.64(0.47, 0.85) | 0.65(0.50, 0.85) | 0.001 |
|
| |||||
| CHAMPS Physical Activity, n (%) modhigh calories/week#<1123.3 | 34(46.0) | 27(57.5) | 14(77.8) | 17(68.0) | |
| Odds Ratio (vs. ≥1123.3) | Reference | 1.52(0.71, 3.27) | 3.59(1.03, 12.52) | 2.18(0.81, 5.84) | 0.14 |
|
| |||||
| PROMIS Sleep | 48.5±9.1 | 50.0±9.8 | 53.4±8.3 | 55.3±10.2 | |
| Disturbance Short Form, v.8a (Range; T-score: 28.9-76.5) | |||||
| Odds Ratio (10 unit increase) | Reference | 1.19(0.80, 1.77) | 1.76(1.00, 3.09) | 2.08(1.23, 3.53) | 0.03 |
|
| |||||
| Physical Performance | |||||
|
| |||||
| 6-Minute Walk Test, meters | 435.0±92.2 | 373.0±75.9 | 378.9±60.5 | 359.4±77.1 | |
| (Normal Range: 400-700)*# | |||||
| Odds Ratio (50 unit increase) | Reference | 0.61(0.47, 0.80) | 0.61(0.42, 0.88) | 0.51(0.37, 0.72) | 0.0002 |
|
| |||||
| 20-Meter Walk Test, n (%) | 61(80.3) | 30(62.5) | 14(70.0) | 13(52.0) | |
| Seconds, <20 | |||||
| Odds Ratio (vs. ≥20) | Reference | 0.38(0.16, 0.90) | 0.47(0.14, 1.52) | 0.22(0.08, 0.62) | 0.02 |
|
| |||||
| Leg Extensor Muscle Strength**newtons#; 1RM | 1029.4±441.4 | 951.5±353.4 | 987.0±306.9 | 830.6±366.2 | |
| Odds Ratio (100 unit increase) | Reference | 0.87(0.76, 0.99) | 0.87(0.73, 1.04) | 0.83(0.70, 1.00) | 0.08 |
|
| |||||
| Muscle Contraction Velocity**meters/second (40% of 1RM)# | 0.5±0.2 | 0.5±0.2 | 0.4±0.2 | 0.4±0.2 | |
| Odds Ratio (0.1 unit increase) | Reference | 0.99(0.78, 1.26) | 0.87(0.63, 1.21) | 0.66(0.47, 0.92) | 0.08 |
|
| |||||
| Muscle Contraction Velocity**meters/second (70% of 1RM)# | 0.3±0.1 | 0.3±0.1 | 0.4±0.2 | 0.3±0.1 | |
| Odds Ratio (0.1 unit increase) | Reference | 0.95(0.69, 1.31) | 1.05(0.68,1.60) | 0.60(0.39, 0.93) | 0.12 |
|
| |||||
| Muscle Power**, n (%) Watts, <228.4 (40% of 1RM)# | 32(44.4) | 22(47.8) | 8(73.9) | 17(73.9) | |
| Odds Ratio (vs. ≥228.4) | Reference | 1.51(0.62, 3.67) | 1.07(0.33, 3.46) | 4.05(1.18, 13.88) | 0.15 |
|
| |||||
| Muscle Power**, n (%) Watts, <228.4 (70% of 1RM)# | 24(33.3) | 18(40.9) | 7(36.8) | 16(69.6) | |
| Odds Ratio (vs. ≥228.4) | Reference | 2.05(0.84, 5.00) | 1.98(0.59, 6.61) | 6.42(1.97, 20.85) | 0.02 |
|
| |||||
| Berg Balance Score, n (%) | 10(13.2) | 14(28.6) | 5(25.0) | 9(36.0) | |
| ≤50 points (Range: 0-56)# | |||||
| Odds Ratio (vs. >50 points) | Reference | 2.67(1.02, 6.99) | 2.56(0.70, 9.38) | 5.00(1.59, 15.72) | 0.04 |
|
| |||||
| Psychosocial Health | |||||
|
| |||||
| SF-36 Mental Component Summary (Range: 0-100)# | 54.6±7.7 | 51.6±10.5 | 50.6±11.6 | 48.8±8.4 | |
| Odds Ratio (10 unit increase) | Reference | 0.63(0.41, 0.97) | 0.57 (0.33, 1.00) | 0.51(0.30, 0.85) | 0.03 |
|
| |||||
| SF-Mental Health (Range: 0-100)# | 77.2±14.7 | 74.6±17.4 | 70.7±18.8 | 68.3±15.1 | |
| Odds Ratio (10 unit increase) | Reference | 0.87(0.68, 1.12) | 0.75(0.55, 1.03) | 0.73(0.55, 0.97) | 0.11 |
|
| |||||
| Beck-II Depression Inventory | 5.5±6.7 | 8.0±8.7 | 10.7±10.2 | 11.7±10.3 | |
| (Range: 0-63) | |||||
| Odds Ratio (1 unit increase) | Reference | 1.06(1.00, 1.12) | 1.09(1.02, 1.16) | 1.09(1.03, 1.16) | 0.01 |
|
| |||||
| Perceived Stress, (Range: 0-40) | 12.1 ±6.0 | 12.6±7.1 | 16.0±8.7 | 16.8±6.3 | |
| Odds Ratio (1 unit increase) | Reference | 1.03(0.97, 1.09) | 1.10(1.02, 1.19) | 1.11(1.03, 1.20) | 0.01 |
|
| |||||
| MOS Social Support, (Range: 19-95)# | 67.9±22.6 | 70.0±20.9 | 61.2±26.8 | 71.1 ±21.2 | |
| Odds Ratio (1 unit increase) | Reference | 1.00 (0.99, 1.02) | 0.99 (0.96, 1.01) | 1.01 (0.99, 1.03) | 0.42 |
|
| |||||
| Arthritis Self-Efficacy Scale-8 | 7.0±1.9 | 5.9±2.0 | 5.5±1.9 | 4.8±2.3 | |
| (Range: 0-10)# | |||||
| Odds Ratio (1 unit increase) | Reference | 0.75(0.61, 0.91) | 0.69(0.53, 0.90) | 0.57(0.44, 0.74) | 0.0002 |
|
| |||||
| Outcome Expectations (Range: 1.0-5.0)# | 4.0±0.5 | 3.9±0.6 | 3.8±0.4 | 3.9±0.7 | |
| Odds Ratio (1 unit increase) | Reference | 0.93(0.47, 1.83) | 0.78(0.31, 1.97) | 0.94(0.41, 2.17) | 0.96 |
|
| |||||
| Biomechanical Factors | |||||
|
| |||||
| Radiographic Leg Alignment‡, n (%) | |||||
| Malalignment | 26(53.1) | 19(52.8) | 6(50.0) | 11(64.7) | 0.70 |
| Odds Ratio (vs. Normal) | Reference | 0.81(0.33, 1.99) | 0.87(0.24, 3.19) | 1.69(0.53, 5.38) | |
1RM= one-repetition maximum; CHAMPS= Community Healthy Activities Model Program for Seniors; MOS= Medical Outcomes Survey; PROMIS= Patient-Reported Outcomes Measurement Information Systems; SF-36= Short Form-36; WOMAC= Western Ontario and McMasters Osteoarthritis Index. All values are mean ± standard deviation, unless otherwise specified.
Normal range reported for the general population.
Osteophyte was confirmed in the patellofemoral joint region for those with Kellgren/Lawrence grade 0 or 1.
For muscle strength, power, and velocity, total n= 165 to 168: 86 to 88 for Tai Chi and 78 to 80 for Physical Therapy.
For radiographic leg alignment, total n= 121: 62 for Tai Chi and 59 for Physical Therapy.
Higher score indicates greater health.
Note: Odds ratios >1.00 favor the first category in dichotomized comparisons.
For both pain and function trajectories, the overall posterior group probabilities of allocating each participant into their respective trajectories ranged from 0.92 to 0.98 for each group, which can be interpreted as an ‘excellent’ model fit and exceeds the recommended minimum of 0.722. In other words, there was a 92 to 98% probability on average of each individual trajectory fitting the respective group trajectory. (See Supplemental Tables S1 and S2 for further information on fit indices across models and participant distributions across posterior probability subcategories.)
Characteristics and Association within Trajectories
As shown in Tables 2 and 3, higher pain or physical disability trajectory groups had larger proportions of black participants, and poorer physical health and self-efficacy than those from trajectories with lower or moderate baseline pain or physical disability. Conversely, Kellgren-Lawrence grade, and comorbidities were evenly distributed among trajectory groups. As shown in Table 4, all pain and function trajectories had between 70 and 88% of participants who attended at least 8 weeks of treatment. Overall, attendance rates were similar among trajectory groups. Among the pain trajectories, the Lower Pain, Early Improvement trajectory had the smallest proportion (47%) with perfect attendance while the other pain trajectories had between 50 and 68% of participants with perfect attendance. Among the functional trajectories, the Lower Function, Gradual Improvement trajectory had the smallest proportion (35%) with perfect attendance, whereas the other functional trajectories had between 43 and 52%. There was a relatively similar balance of treatment assignment (40 to 60%) among participants within each of the pain or functional trajectories.
Table 4.
Number of Participants Among Trajectories by Attendance-Weeks
| PAIN Trajectory Groups | Attendance-Weeks | |||||||||
|---|---|---|---|---|---|---|---|---|---|---|
| 0–2 | 3 | 4 | 5 | 6 | 7 | 8 | 9 | 10 | 11 | |
| Lower Pain, Early Improvement | 74 | 73 | 72 | 70 | 60 | 59 | 56 | 48 | 45 | 35 |
| Moderate Pain, Early Improvement | 55 | 53 | 53 | 51 | 48 | 48 | 46 | 42 | 41 | 34 |
| Higher Pain, Delayed Improvement | 26 | 25 | 23 | 23 | 22 | 19 | 19 | 19 | 16 | 14 |
| Higher Pain, No Improvement | 16 | 16 | 16 | 16 | 15 | 14 | 14 | 14 | 12 | 10 |
| FUNCTION Trajectory Groups | ||||||||||
| Higher Function, Early Improvement | 76 | 76 | 75 | 72 | 63 | 62 | 61 | 52 | 47 | 33 |
| Moderate Function, Early Improvement | 50 | 47 | 47 | 45 | 43 | 41 | 38 | 37 | 35 | 26 |
| Lower Function, Gradual Improvement | 20 | 19 | 18 | 18 | 17 | 15 | 14 | 13 | 10 | 7 |
| Lower Function, Delayed Improvement | 25 | 25 | 24 | 24 | 22 | 21 | 21 | 21 | 17 | 13 |
Attendance-Weeks indicate the total number of weeks participants attended their assigned intervention.
Table 2 summarizes the associations between baseline characteristics and pain trajectory group membership (in reference to Lower Pain, Early Improvement), and Table 3 summarizes the same for functional trajectory group membership (in reference to Higher Function, Early Improvement). We found a general pattern wherein black race and poorer physical health were associated with membership in the moderate-to-higher pain/function severity trajectories. For example, poorer Patient Global Assessment was significantly associated with increased odds of being in the Moderate Pain, Early Improvement (OR = 1.37; 95% Confidence Intervals [CI]: 1.13, 1.66); Higher Pain, Delayed Improvement (OR=2.32; 95% CI: 1.66, 3.23); and Higher Pain, No Improvement trajectories (OR=1.65; 95% CI: 1.22, 2.23). Similarly among the functional trajectories, poorer Patient Global Assessment was significantly associated with increased odds of being in the Moderate Function, Early Improvement (OR = 1.33; 95% CI: 1.10, 1.61); Lower Function, Gradual Improvement (OR = 1.45; 95% CI: 1.12, 1.89); and Lower Function, Delayed Improvement trajectories (OR = 1.84; 95% CI: 1.40, 2.41). In general, we found that participants with poorer physical health and worse sleep quality had higher odds of being in the higher pain and lower function trajectories groups. We found another general pattern wherein participants with poor psychological health, such as low self-efficacy and high perceived stress, had higher odds of being in the higher pain/poorer function trajectories groups. Furthermore, the less favorable trajectories (i.e. ‘no improvement’ for pain and ‘delayed improvement’ for function) were significantly associated with a greater number of psychological health variables than their more favorable counterparts (i.e. ‘delayed improvement’ for pain and ‘gradual improvement’ for function).
DISCUSSION
This investigation provides a unique insight into the heterogeneous patterns of change in pain and function from exercise interventions among adults with symptomatic knee OA. By identifying distinct trajectories of symptomatic improvement, our findings provide a more realistic understanding of treatment response to exercise compared with traditional group mean-based analyses. These newer group-based trajectory modeling techniques revealed four distinct pain and functional trajectory patterns over 12 weeks of treatment that showed most participants had improvements in pain/function over a short-term exposure, while some had no improvements in pain/function. In addition, we found a novel delayed-response pattern characterized by intractable symptoms that eventually improved after 6 to 7 weeks of treatment. Importantly, we found a pattern wherein poorer physical and psychological morbidities at baseline were associated with these delayed- and non-response patterns.
Concordant with our results, a similar number of distinct trajectories were found in prior studies that describe the natural history of disease over several years14–17 or recovery from knee surgery18,19. Major findings of this investigation were the divergent trajectories observed among severely symptomatic participants at baseline. In OA research, these findings are discordant with the conventional approach to exclude participants with severe pain/functional disability based on the presumption that exercise will have little effect on those with severe disease48. Moreover, the divergent severe pain/function trajectories found in our study have clinically important implications. Patients with severe pain or physical disability are less likely to initiate clinician-prescribed exercise programs, and tend to have poor exercise adherence, especially when symptomatic benefits are not perceived in the early stages of treatment5–12. Thus, our findings may be used by clinicians at the onset of treatment to curtail future frustrations and non-compliance by informing severely symptomatic patients about the potential for delayed improvements.
Characterizing these trajectories is important to help establish phenotypes that are readily identifiable in the clinical setting. We found that poorer physical factors were associated with trajectories of moderate or higher initial severity, which is concordant with studies that show physical health to predict treatment response from exercise13. Our other finding was that some poorer psychological health factors were associated with the delayed response/non-response trajectories. An emerging body of evidence shows that psychological factors (e.g. depressive symptoms, mental health, etc.) may influence treatment response from exercise among patients with OA3,6. Our findings extend upon this evidence by showing that psychological health factors may help clinicians to distinguish patients who will have a delayed response or no response to exercise. There are many potential mechanisms through which psychological factors may modulate the effects of exercise in OA. Psychological morbidities may negatively modulate symptoms in chronic pain via symptom amplification, pain sensitization49,50, and the fear-avoidance model51. Although greater psychological health may modulate exercise outcomes through better attendance, this is unlikely to have influenced our findings because we quantified exercise dose according to attendance-weeks. While a definitive rationale is beyond the scope of this study, our results provide an indication that psychological status may play a role in stratifying patients according to their trajectory of treatment response from exercise.
This study has limitations. First, because some people did not attend the minimum required number of intervention sessions, this may have affected our results and interpretation. Second, the effects of treatment from higher amounts of exercise exposure may be biased towards those who were more adherent to the intervention. Third, owing to the hypothesis-generating nature of this investigation, analyses were not adjusted for multiple comparisons which could have led to some spurious associations. Furthermore, some trajectory groups had small sample sizes, especially in the higher pain and worse function groups. This in combination with overall low sample size may have led to sparse data bias52. In addition, although group-based trajectory modeling assumes that data is missing at random, it is possible that some of the missing data from this investigation were non-random. However, this does not detract from the primary value of our findings from this exploratory study, which is that various, meaningful trajectories of treatment response exist in OA, and that some patients had a delayed response to exercise. Furthermore, we utilized several other methods to reduce bias, including blinded assessors of physical performance, radiographic and symptomatic verification of diagnosis, and our use of post-randomization WOMAC pain/function data as the baseline measure, which likely reduced the influence of self-selection bias and regression to the mean.
Despite these limitations, our investigation found novel information to better understand who may benefit from treatment and how their symptomatic trajectories actively change with increasing exercise exposure. To fully characterize and understand these subgroups, additional study among larger samples is imperative. We therefore call for strong consideration of this approach (i.e. frequently measured outcomes during intervention) as a part of standard investigative practice for consensus guidelines of exercise trials in OA. In addition, future studies could investigate whether modifications in the exercise dose (e.g. greater frequency, longer durations, different exercise types, etc.) lead to better outcomes among trajectories with delayed or no improvements.
In conclusion, this exploratory study suggests that there are distinct trajectories for both pain and function over 12 weeks of exercise exposure among adults with symptomatic knee OA. While the majority of participants experienced improvements over short-term exposure, we found a subset of participants with higher baseline symptom severities who do not respond. By helping to disentangle the heterogeneity of treatment response in OA, these findings may advance the delivery of patient-centered care for this large patient population.
Supplementary Material
WOMAC= Western Ontario and McMasters Osteoarthritis Index. Panel A: Pain Trajectories. WOMAC Pain subscale range: 0–500, higher scores = greater pain. Panel B: Function Trajectories. WOMAC Function subscale range: 0–1700, higher scores = poorer physical function.
Acknowledgments
The Authors gratefully appreciate Sarah Nodine and Lisa Ramdas for their extensive assistance with table and figure presentation, Stephanie Hyon and Michelle Park for feedback on the written manuscript, and Michelle Park for assistance with editing the manuscript. We also thank Dr. Daniel White for conceptual suggestions and feedback, and Dr. Kieran Reid for general insights on the physical performance measurements.
Supported by: National Center for Complementary and Integrative Health (R01AT005521, K24AT007323, and K23AT009374), and National Center for Advancing Translational Sciences (UL1TR001064) at the National Institutes of Health. The contents of this manuscript are solely the responsibility of the authors and do not necessarily represent the official views of the National Institutes of Health.
Role of the funding source
The investigators are solely responsible for the content of the manuscript and the decision to submit for publication. The funders had no role in study design, data collection and analysis, decision to publish, or preparation of the manuscript.
Footnotes
Publisher's Disclaimer: This is a PDF file of an unedited manuscript that has been accepted for publication. As a service to our customers we are providing this early version of the manuscript. The manuscript will undergo copyediting, typesetting, and review of the resulting proof before it is published in its final citable form. Please note that during the production process errors may be discovered which could affect the content, and all legal disclaimers that apply to the journal pertain.
Conflicts of Interest: The authors declare that they have no conflict of interest.
Author contributions
All authors were involved in drafting the article or revising it critically for important intellectual content, and all authors approved the final version to be published. Dr. Wang had full access to all of the data in the study and takes responsibility for the integrity of the data and the accuracy of the data analysis.
Study conception and design: Lee, Harvey, Price, Han, Driban, Bannuru, Wang.
Acquisition of data: Lee, Harvey, Price, Han, Driban, Bannuru, Wang.
Analysis and interpretation of data: Lee, Harvey, Price, Han, Driban, Bannuru, Wang.
References
- 1.Zhang Y, Jordan JM. Epidemiology of osteoarthritis. Clin Geriatr Med. 2010;26(3):355–369. doi: 10.1016/j.cger.2010.03.001. [DOI] [PMC free article] [PubMed] [Google Scholar]
- 2.Hochberg MC, Altman RD, April KT, Benkhalti M, Guyatt G, Mcgowan J, et al. American College of Rheumatology 2012 recommendations for the use of nonpharmacologic and pharmacologic therapies in osteoarthritis of the hand, hip, and knee. Arthritis Care Res (Hoboken) 2012;64(4):465–474. doi: 10.1002/acr.21596. [DOI] [PubMed] [Google Scholar]
- 3.Weigl M, Angst F, Aeschlimann A, Lehmann S, Stucki G. Predictors for response to rehabilitation in patients with hip or knee osteoarthritis: a comparison of logistic regression models with three different definitions of responder. Osteoarthr Cartil. 2006;14(7):641–651. doi: 10.1016/j.joca.2006.01.001. [DOI] [PubMed] [Google Scholar]
- 4.Bruyère O, Cooper C, Arden N, Branco J, Brandi M, Herrero-Beaumont G, et al. Can we identify patients with high risk of osteoarthritis progression who will respond to treatment? A focus on epidemiology and phenotype of osteoarthritis. Drugs Aging. 2015;32(3):179–187. doi: 10.1007/s40266-015-0243-3. [DOI] [PMC free article] [PubMed] [Google Scholar]
- 5.Foster NE, Dziedzic KS, van der Windt DAWM, Fritz JM, Hay EM. Research priorities for non-pharmacological therapies for common musculoskeletal problems: nationally and internationally agreed recommendations. BMC Musculoskelet Disord. 2009;10(1):3. doi: 10.1186/1471-2474-10-3. [DOI] [PMC free article] [PubMed] [Google Scholar]
- 6.Bennell KL, Dobson F, Hinman RS. Exercise in osteoarthritis: Moving from prescription to adherence. Best Pract Res Clin Rheumatol. 2014;28(1):93–117. doi: 10.1016/j.berh.2014.01.009. [DOI] [PubMed] [Google Scholar]
- 7.Ganz DA, Chang JT, Roth CP, Guan M, Kamberg CJ, Niu F, et al. Quality of osteoarthritis care for community-dwelling older adults. Arthritis Rheum. 2006;55(2):241–247. doi: 10.1002/art.21844. [DOI] [PubMed] [Google Scholar]
- 8.Holden MA, Nicholls EE, Young J, Hay EM, Foster NE. UK-based physical therapists’ attitudes and beliefs regarding exercise and knee osteoarthritis: Findings from a mixed-methods study. Arthritis Rheum. 2009;61(11):1511–1521. doi: 10.1002/art.24829. [DOI] [PubMed] [Google Scholar]
- 9.Holden MA, Nicholls EE, Young J, Hay EM, Foster NE. Role of exercise for knee pain: What do older adults in the community think? Arthritis Care Res (Hoboken) 2012;64(10):1554–1564. doi: 10.1002/acr.21700. [DOI] [PubMed] [Google Scholar]
- 10.Hunter DJ. Quality of osteoarthritis care for community-dwelling older adults. Clin Geriatr Med. 2010;26(3):401–417. doi: 10.1016/j.cger.2010.03.003. [DOI] [PubMed] [Google Scholar]
- 11.Damush TM, Perkins SM, Mikesky AE, Roberts M, O’Dea J. Motivational Factors Influencing Older Adults Diagnosed with Knee Osteoarthritis to Join and Maintain an Exercise Program. J Aging Phys Act. 2005;13(1):45–60. doi: 10.1123/japa.13.1.45. [DOI] [PubMed] [Google Scholar]
- 12.Petursdottir U, Arnadottir SA, Halldorsdottir S. Facilitators and barriers to exercising among people with osteoarthritis: a phenomenological study. Phys Ther. 2010;90(7):1014–1025. doi: 10.2522/ptj.20090217. [DOI] [PubMed] [Google Scholar]
- 13.Eyles J, Lucas BR, Hunter DJ. Targeting Care: Tailoring Nonsurgical Management According to Clinical Presentation. Rheum Dis Clin North Am. 2013;39(1):213–233. doi: 10.1016/j.rdc.2012.11.001. [DOI] [PubMed] [Google Scholar]
- 14.Collins JE, Katz JN, Dervan EE, Losina E. Trajectories and risk profiles of pain in persons with radiographic, symptomatic knee osteoarthritis: data from the osteoarthritis initiative. Osteoarthr Cartil. 2014;22(5):622–630. doi: 10.1016/j.joca.2014.03.009. [DOI] [PMC free article] [PubMed] [Google Scholar]
- 15.White DK, Neogi T, Nguyen U-SDT, Niu J, Zhang Y. Trajectories of functional decline in knee osteoarthritis: the Osteoarthritis Initiative. Rheumatology. 2016;55(5):801–808. doi: 10.1093/rheumatology/kev419. [DOI] [PMC free article] [PubMed] [Google Scholar]
- 16.Bastick AN, Wesseling J, Damen J, Wesseling J, Hilberdink WKHA, Bindels PJE, et al. Defining knee pain trajectories in early symptomatic knee osteoarthritis in primary care: 5-year results from a nationwide prospective cohort study (CHECK) Br J Gen Pract. 2016;66(642):e32–9. doi: 10.3399/bjgp15X688129. [DOI] [PMC free article] [PubMed] [Google Scholar]
- 17.Holla JFM, van der Leeden M, Heymans MW, Roorda LD, Bierma-Zeinstra SMA, Lems WF, et al. Three trajectories of activity limitations in early symptomatic knee osteoarthritis: a 5-year follow-up study. Ann Rheum Dis. 2014;73(7):1369–1375. doi: 10.1136/annrheumdis-2012-202984. [DOI] [PubMed] [Google Scholar]
- 18.Dowsey MM, Smith AJ, Choong PFM. Latent Class Growth Analysis predicts long term pain and function trajectories in total knee arthroplasty: a study of 689 patients. Osteoarthr Cartil. 2015;23(12):2141–2149. doi: 10.1016/j.joca.2015.07.005. [DOI] [PubMed] [Google Scholar]
- 19.Lindberg MF, Miaskowski C, Rustøen T, Rosseland LA, Paul SM, Cooper BA, et al. The Impact of Demographic, Clinical, Symptom and Psychological Characteristics on the Trajectories of Acute Postoperative Pain After Total Knee Arthroplasty. Pain Med. 2017;18(1):124–139. doi: 10.1093/pm/pnw080. [DOI] [PMC free article] [PubMed] [Google Scholar]
- 20.Wang C, Iversen MD, McAlindon T, Harvey WF, Wong JB, Fielding RA, et al. Assessing the comparative effectiveness of Tai Chi versus physical therapy for knee osteoarthritis: design and rationale for a randomized trial. BMC Complement Altern Med. 2014;14(1):333. doi: 10.1186/1472-6882-14-333. [DOI] [PMC free article] [PubMed] [Google Scholar]
- 21.Wang C, Schmid CH, Iversen MD, Harvey WF, Fielding RA, Driban JB, et al. Comparative Effectiveness of Tai Chi Versus Physical Therapy for Knee Osteoarthritis: A Randomized Trial. Ann Intern Med. 2016 May; doi: 10.7326/M15-2143. [DOI] [PMC free article] [PubMed] [Google Scholar]
- 22.Losina E, Collins JE. Forecasting the future pain in hip OA: can we rely on pain trajectories? Osteoarthr Cartil. 2016;24(5):765–767. doi: 10.1016/j.joca.2016.01.989. [DOI] [PubMed] [Google Scholar]
- 23.Wang C, Collet JP, Lau J. The effect of Tai Chi on health outcomes in patients with chronic conditions: a systematic review. Arch Intern Med. 2004;164(5):493–501. doi: 10.1001/archinte.164.5.493. [DOI] [PubMed] [Google Scholar]
- 24.Deyle GD, Allison SC, Matekel RL, Ryder MG, Stang JM, Gohdes DD. Physical therapy treatment effectiveness for osteoarthritis of the knee: a randomized comparison of supervised clinical exercise and manual therapy procedures versus a home exercise program. Phys Ther. 2005;85(12):1301–1317. [PubMed] [Google Scholar]
- 25.Bellamy N, Buchanan WW, Goldsmith CH, Campbell J, Stitt LW. Validation study of WOMAC: a health status instrument for measuring clinically important patient relevant outcomes to antirheumatic drug therapy in patients with osteoarthritis of the hip or knee. J Rheumatol. 1988;15(12):1833–1840. [PubMed] [Google Scholar]
- 26.Khan NA, Spencer HJ, Abda EA, Alten R, Pohl C, Ancuta C, et al. Patient’s global assessment of disease activity and patient’s assessment of general health for rheumatoid arthritis activity assessment: are they equivalent? Ann Rheum Dis. 2012;71(12):1942–1949. doi: 10.1136/annrheumdis-2011-201142. [DOI] [PMC free article] [PubMed] [Google Scholar]
- 27.Ware JE, Jr, Sherbourne CD. The MOS 36-item short-form health survey (SF-36): I. Conceptual framework and item selection. Med Care. 1992;30:473–483. [PubMed] [Google Scholar]
- 28.Buysse DJ, Yu L, Moul DE, Germain A, Stover A, Dodds NE, et al. Development and validation of patient-reported outcome measures for sleep disturbance and sleep-related impairments. Sleep. 2010;33(6):781–792. doi: 10.1093/sleep/33.6.781. [DOI] [PMC free article] [PubMed] [Google Scholar]
- 29.Beck AT, Steer RA, Brown GK. Manual for the Beck Depression Inventory-II. 1996. San Antonio, TX Psychol Corp. 1996 [Google Scholar]
- 30.Eskildsen A, Dalgaard VL, Nielsen KJ, Andersen JH, Zachariae R, Olsen LR, et al. Cross-cultural adaptation and validation of the Danish consensus version of the 10-item Perceived Stress Scale. Scand J Work Environ Health. 2015;41(5):486–490. doi: 10.5271/sjweh.3510. [DOI] [PubMed] [Google Scholar]
- 31.Brady TJ. Arthritis Self-Efficacy Scale (ASES), Arthritis Self-Efficacy Scale-8 Item (ASES-8), Children’s Arthritis Self-Efficacy Scale (CASE), Chronic Disease Self-Efficacy Scale (CDSES), Parent’s Arthritis Self-Efficacy Scale (PASE), and Rheumatoid Arthritis Self. Arthritis Care Res (Hoboken) 2011;63(S11):S473–85. doi: 10.1002/acr.20567. [DOI] [PubMed] [Google Scholar]
- 32.Resnick B, Zimmerman SI, Orwig D, Furstenberg AL, Magaziner J. Outcome expectations for exercise scale: utility and psychometrics. J Gerontol B Psychol Sci Soc Sci. 2000;55(6):S352–6. doi: 10.1093/geronb/55.6.s352. [DOI] [PubMed] [Google Scholar]
- 33.Sherbourne CD, Stewart AL. The MOS social support survey. Soc Sci Med. 1991;32(6):705–714. doi: 10.1016/0277-9536(91)90150-b. [DOI] [PubMed] [Google Scholar]
- 34.Olsson L, Swedberg K. Six minute walk test. Eur Heart J. 2005;26(20):2209. doi: 10.1093/eurheartj/ehi452. [DOI] [PubMed] [Google Scholar]
- 35.Motyl JM, Driban JB, McAdams E, Price LL, McAlindon TE. Test-retest reliability and sensitivity of the 20-meter walk test among patients with knee osteoarthritis. BMC Musculoskelet Disord. 2013;14(1):166. doi: 10.1186/1471-2474-14-166. [DOI] [PMC free article] [PubMed] [Google Scholar]
- 36.Wang C-Y, Hsieh C-L, Olson SL, Wang C-H, Sheu C-F, Liang C-C. Psychometric Properties of the Berg Balance Scale in a Community-dwelling Elderly Resident Population in Taiwan. J Formos Med Assoc. 2006;105(12):992–1000. doi: 10.1016/S0929-6646(09)60283-7. [DOI] [PubMed] [Google Scholar]
- 37.Reid KF, Price LL, Harvey WF, Driban JB, Hau C, Fielding RA, et al. Muscle power is an independent determinant of pain and quality of life in knee osteoarthritis. Arthritis Rheumatol. 2015;67(12):3166–3173. doi: 10.1002/art.39336. [DOI] [PMC free article] [PubMed] [Google Scholar]
- 38.Kraus VB, Vail TP, Worrell T, McDaniel G. A comparative assessment of alignment angle of the knee by radiographic and physical examination methods. Arthritis Rheum. 2005;52(6):1730–1735. doi: 10.1002/art.21100. [DOI] [PubMed] [Google Scholar]
- 39.Fransen M, Mcconnell S, Harmer AR, Van der Esch M, Simic M, Bennell KL. Exercise for osteoarthritis of the knee. Cochrane Database Syst Rev. 2015;1:CD004376. doi: 10.1002/14651858.CD004376.pub3. [DOI] [PMC free article] [PubMed] [Google Scholar]
- 40.Jones BL, Nagin DS. Advances in Group-Based Trajectory Modeling and an SAS Procedure for Estimating Them. Sociol Methods Res. 2007;35(4):542–571. doi: 10.1177/0049124106292364. [DOI] [Google Scholar]
- 41.Jung T, Wickrama KA. An introduction to latent class growth analysis and growth mixture modeling. Soc Personal Psychol Compass. 2008;2(1):302–317. doi: 10.1111/j.1751-9004.2007.00054.x. [DOI] [Google Scholar]
- 42.Nagin DS, Odgers CL. Group-Based Trajectory Modeling in Clinical Research. Annu Rev Clin Psychol. 2010;6(1):109–138. doi: 10.1146/annurev.clinpsy.121208.131413. [DOI] [PubMed] [Google Scholar]
- 43.Giles K, Marshall AL. Repeatability and accuracy of CHAMPS as a measure of physical activity in a community sample of older Australian adults. J Phys Act Health. 2009;6(2):221–229. doi: 10.1123/jpah.6.2.221. [DOI] [PubMed] [Google Scholar]
- 44.Bennell K, Dobson F, Hinman R. Measures of physical performance assessments: Self-Paced Walk Test (SPWT), Stair Climb Test (SCT), Six-Minute Walk Test (6MWT), Chair Stand Test (CST), Timed Up & Go (TUG), Sock Test, Lift and Carry Test (LCT), and Car Task. Arthritis Care Res (Hoboken) 2011;63(S11):S350–S370. doi: 10.1002/acr.20538. [DOI] [PubMed] [Google Scholar]
- 45.Shumway-Cook A, Baldwin M, Polissar NL, Gruber W. Predicting the probability for falls in community-dwelling older adults. Phys Ther. 1997;77(8):812–819. doi: 10.1093/ptj/77.8.812. [DOI] [PubMed] [Google Scholar]
- 46.Reid KF, Doros G, Clark DJ, Patten C, Carabello RJ, Cloutier GJ, et al. Muscle power failure in mobility-limited older adults: preserved single fiber function despite lower whole muscle size, quality and rate of neuromuscular activation. Eur J Appl Physiol. 2012;112(6):2289–2301. doi: 10.1007/s00421-011-2200-0. [DOI] [PMC free article] [PubMed] [Google Scholar]
- 47.Tubach F, Ravaud P, Martin-Mola E, Awada H, Bellamy N, Bombardier C, et al. Minimum clinically important improvement and patient acceptable symptom state in pain and function in rheumatoid arthritis, ankylosing spondylitis, chronic back pain, hand osteoarthritis, and hip and knee osteoarthritis: Results from a prospective multina. Arthritis Care Res. 2012;64(11):1699–1707. doi: 10.1002/acr.21747. [DOI] [PubMed] [Google Scholar]
- 48.Messier SP, Callahan LF, Golightly YM, Keefe FJ. OARSI Clinical Trials Recommendations: Design and conduct of clinical trials of lifestyle diet and exercise interventions for osteoarthritis. Osteoarthr Cartil. 2015;23(5):787–797. doi: 10.1016/j.joca.2015.03.008. [DOI] [PMC free article] [PubMed] [Google Scholar]
- 49.Fingleton C, Smart KM, Doody CM. Exercise-induced Hypoalgesia in People With Knee Osteoarthritis With Normal and Abnormal Conditioned Pain Modulation. Clin J Pain. 2017;33(5):395–404. doi: 10.1097/AJP.0000000000000418. [DOI] [PubMed] [Google Scholar]
- 50.van Wilgen CP, Vuijk PJ, Kregel J, Voogt L, Meeus M, Descheemaker F, et al. Psychological distress and widespread pain contribute to the variance of the central sensitization inventory: A cross-sectional study in patients with chronic pain. Pain Pract. 2017 doi: 10.1111/papr.12600. [DOI] [PubMed] [Google Scholar]
- 51.Crombez G, Eccleston C, Van Damme S, Vlaeyen JWS, Karoly P. Fear-Avoidance Model of Chronic Pain. Clin J Pain. 2012;28(6):475–483. doi: 10.1097/AJP.0b013e3182385392. [DOI] [PubMed] [Google Scholar]
- 52.Greenland S, Mansournia MA, Altman DG. Sparse data bias: a problem hiding in plain sight. BMJ. 2016:i1981. doi: 10.1136/bmj.i1981. [DOI] [PubMed] [Google Scholar]
Associated Data
This section collects any data citations, data availability statements, or supplementary materials included in this article.
Supplementary Materials
WOMAC= Western Ontario and McMasters Osteoarthritis Index. Panel A: Pain Trajectories. WOMAC Pain subscale range: 0–500, higher scores = greater pain. Panel B: Function Trajectories. WOMAC Function subscale range: 0–1700, higher scores = poorer physical function.