

Abstract
In 1164 cognitively unimpaired persons, ages 50-95 years, from the population-based Mayo Clinic Study of Aging, we examined the relationships of baseline cognition and cognitive changes across the full range of cortical thickness of an Alzheimer signature region of interest and global β-amyloid levels measured by PIB PET standardized uptake value ratio (SUVR).
In machine learning models accounting for both biomarkers simultaneously, worsening biomarker values were additive and associated with lower baseline global cognition and greater subsequent decline in global cognition. Associations between AD signature cortical thickness or PIB PET β-amyloid SUVR and baseline cognition were mainly linear. Lower AD signature cortical thickness values across the entire range of thickness predicted future decline in global cognitive scores, demonstrating its close relationship to cognitive functioning. PIB PET β-amyloid SUVR also predicted cognitive decline across its full range, even when cortical thickness was accounted for. PIB PET β-amyloid's relationship to cognitive decline was nonlinear, more prominent at lower β-amyloid levels and less prominent at higher β-amyloid levels
Keywords: amyloid imaging, neurodegeneration biomarkers, structural MR imaging, Cognitive ageing, Alzheimer's disease
Graphical abstract
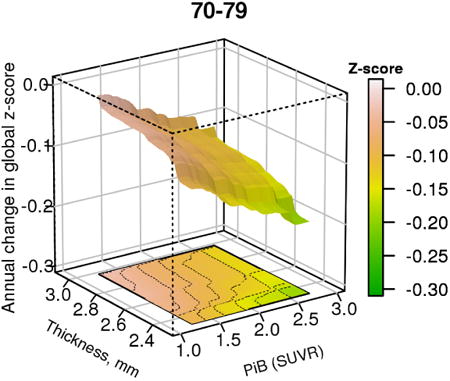
The figure shows the 3-dimensional relationship between brain β-amyloid levels, cortical thickness and change in global cognitive z-score in a cohort of cognitively unimpaired persons aged 70-79
1. Introduction
Understanding the pathophysiology of Alzheimer's Disease (AD) has been greatly facilitated by the development of biomarkers. Studies of the relationship between β-amyloid positron emission tomography (PET) tracer levels and cognition in clinically normal persons generally show a modest inverse relationship (Villemagne et al., 2011; Hedden et al., 2013; Petersen et al., 2015; Insel et al., 2016; Donohue et al., 2017; Farrell et al., 2017). Measures of AD-related neurodegenerative processes such as cortical volume, cortical thickness or glucose metabolic rate are more consistently associated with cognition (Sabuncu et al., 2011; Wirth et al., 2013a; Fjell et al., 2014; Jack et al., 2015; Weston et al., 2016). Examining associations of cognition with β-amyloid PET imaging markers and neurodegenerative imaging biomarkers individually has allowed for exploration of the full range of each feature, but fails to account for the important inter-relationships of the two. Apparent associations between one of the biomarkers could be largely driven by variance shared with the other biomarker (Becker et al., 2011). Because of the difficulty in manipulating two complex functions in a single model simultaneously, most approaches seeking to examine the role of cognition as a function of β-amyloid PET imaging markers and neurodegenerative imaging biomarkers have been performed by dichotomizing each as normal or abnormal (Chetelat et al., 2012; Wirth et al., 2013b; Mormino et al., 2014; Villeneuve et al., 2014; Mattsson et al., 2015). While categorical approaches are more tractable, large portions of the distribution of each biomarker conditioned on the presence of the other are left unexplored.
Based on recent models of the relationship between β-amyloidosis and neurodegeneration (Hyman 2011; Jack et al., 2013a; Bloom 2014; Musiek et al., 2015; Jagust 2016), we hypothesized that: (1) there would be additivity of elevated β-amyloid and declining cortical thickness for predicting level of cognitive functioning, and (2) cortical thickness would be a better predictor of future cognitive decline than would β-amyloid. There have been many studies that examined both β-amyloid biomarkers and markers of neurodegeneration in cognitively normal persons as well as those with mild cognitive impairment. Those studies have consistently found that those in whom both biomarkers were abnormal had lower cognition and a worse prognosis than those with either only one of those biomarkers abnormal or with neither biomarker abnormal (See (Jack et al., 2016) for a summary of published studies). Second, prior studies have suggested that neurodegenerative biomarker levels were more strongly associated with cognition than was β-amyloidosis (Becker et al., 2011; Chetelat et al., 2012; Wirth et al., 2013b; Mormino et al., 2014; Villeneuve et al., 2014; Mattsson et al., 2015; Vemuri et al., 2017a). Because no prior study, to our knowledge, examined the associations in a multi-dimensional manner, we wished to determine whether the joint relationships between β-amyloid and cortical thickness versus cognition were linear or non-linear. In the present analyses we applied a flexible machine-learning model to explore in a 3-dimensional space, the joint relationship between the continuous distributions of PET-derived β-amyloid deposition, MR-derived cortical thickness (as an imaging proxy for neurodegeneration) and cognition among cognitively unimpaired middle aged and elderly individuals drawn from a population-based study.
2. Methods
2.1. Participants
Cognitively unimpaired participants from the Mayo Clinic Study of Aging (MCSA) were included in this longitudinal study if they were 50 years of age or older, had cognitive testing, MRI and PIB-PET scans and had returned for one or more follow-up cognitive evaluations. Baseline was defined as a MCSA participant's first visit with cognitive testing and imaging.
The participants were adjudicated by a consensus panel as being cognitively unimpaired using previously described procedures (Petersen 2004; Roberts et al., 2008; Petersen et al., 2010; Roberts et al., 2012; Roberts et al., 2014). The consensus panel consisted of a physician who examined the participant and performed a brief mental status examination, a study coordinator who interviewed both the participant and a study partner, and a neuropsychologist.
The neuropsychological test battery consisted of 9 instruments (Roberts et al., 2008) that were grouped into four domains: memory (Logical Memory-II (delayed recall), Visual Reproduction-II (delayed recall) from the Wechsler Memory Scale-Revised (Wechsler 1987), and Auditory Verbal Learning Test (Ivnik et al., 1992)); attention/executive functioning (Trail Making Test B (Reitan 1958), Digit Symbol Substitution test from the Wechsler Adult Intelligence Scale-Revised (WAIS-R) (Wechsler 1981)); language (Boston Naming Test (Kaplan et al., 1978), Category Fluency (Lucas et al., 1998)); and visuospatial (Picture Completion and Block Design from the WAIS-R). Cognitive test scores were converted to z scores based on a reference cohort of clinically normal MCSA participants ages 50-89 enrolled between 2004-2012, and weighted to the Olmsted County population. Individual test z-scores were averaged to create a z-score for each of the 4 cognitive domains, and a global z-score was derived from the average of the 4 domain z-scores. We chose to use the global z-score to present our findings for data reduction purposes and because it generally reflected the key domains relevant to AD, namely memory and attention/executive.
2.2. Imaging
We took advantage of our prior work in selecting a set of regions that optimally distinguished persons in the AD pathway from those not in the pathway. Because of the computational intensity of our approach, we chose to limit our investigations to a single set of ROI's– albeit ones with demonstrated validity for the AD pathway – for each biomarker. That meant that we did not select the identical ROIs for the two biomarkers. This is an implicit acknowledgement that while cortical thickness has anatomic specificity for cognitive functions relevant to AD, β-amyloidosis may reflect more of a marker of network dysfunction.
PIB-PET imaging used methods previously described (Jack et al., 2017). A PIB PET scan consisted of four 5-minute dynamic frames acquired from 40–60 minutes after injection of 11C-PIB. The PIB PET regions of interest (ROIs) were derived from an MR template generated from each participant based on an in-house modification of the AAL atlas (Tzourio-Mazoyer et al., 2002). Regional PIB uptake was defined as the median uptake across all voxels in an ROI. A global PIB standardized uptake value ratio (SUVR) was calculated from a group of target regions in both hemispheres including parietal, cingulate precuneus, prefrontal, orbito-frontal, temporal, anterior cingulate and posterior cingulate regions, with cerebellar crus serving as the reference region. This meta-ROI was based on our prior work (Jack et al., 2008), and has been validated neuropathologically (Murray et al., 2015). Target and reference regions were gray matter and white matter sharpened, and partial volume correction was not used. The global PIB meta-ROI SUVR is denoted as PIBAD.
Cortical thickness measurements have several attractive methodological features that have led us to prefer it over grey matter regional density (eg (Vemuri et al., 2009)). Thickness can be measured reliably with widely available software (Schwarz et al., 2016b), and it is not sensitive to head size (Jack et al., 2015). Cortical thickness was measured as previously described (Jack et al., 2017). Cortical thickness in an AD signature meta-ROI represented an area-weighted average of mean cortical thickness across both hemispheres generated from the following FreeSurfer (v5.3) ROIs: entorhinal, inferior temporal, middle temporal, and fusiform. These regions were previously selected on the basis of discriminating between AD dementia and clinically normal individuals (Whitwell et al., 2013; Schwarz et al., 2016b). The AD signature meta-ROI cortical thickness is referred to as TKAD.
2.3. Statistical Analyses
Cognition was modeled as a function of current age, PIBAD and TKAD using a gradient boosting machines (GBM) model, also adjusting for sex, education, and the number of exposures to the cognitive test battery prior to baseline. The number of cognitive test exposures prior to the study baseline is relevant because of learning effects in unimpaired individuals (Machulda et al., 2013). GBM is a machine learning technique which allows for arbitrary non-linear and interaction effects which was particularly important in the 3-dimensional space we were modeling. GBM fits a very large number of binary classification trees and then averages the results. The approach makes no assumptions about the functional form of the relationships. A strength of this particular method is avoidance of overfitting (Friedman 2001). For these models we specified a monotonic relationship on age (increasing), PIBad (increasing), and TKAD (decreasing), based on the expectation that their relationship with cognition should plateau or worsen, but not improve. Because some participants had undergone cognitive testing prior to the first PIB PET, we also accounted for the number of prior exposures to cognitive testing and specified the monotonicity as improving to reflect the expectation of a learning effect. The GBM models allowed for an interaction depth of 2. The model complexity (number of subtrees) was chosen using 8-fold cross-validation. GBM package version 2.2 was employed with the R statistical software version 3.3.1 (R Core Team (2016), R Foundation for Statistical Computing, Vienna).
We created two GBM models. From the first GBM model on baseline global z-score (COGb), we obtained model-based predictions in relation to TKAD and PIBAD. The second GBM model used annual change in global z-score (ΔCOG) predictions made in relation to TKAD and PIBAD. To develop a metric for ΔCOG, we derived slopes for each participant based on their serial cognitive testing using a linear mixed model adjusting for age, education, prior cognitive testing, and sex with random subject-specific intercepts and slopes. A natural cubic spline on age and education allowed us to capture potential nonlinearities. By fitting the model on the time-scale we can consider the slopes as an estimate of annualized cognitive change. In order to decrease the noise in the slope measurements, we included up to 2 cognitive testing values that preceded the PIB PET scan to be used in the calculation of slope.
We predicted the marginal effects of the selected variables (PIBAD, TKAD, and age) over the other covariates of sex, education, and prior exposure to cognitive testing. The output of the GBM model was visualized as a 3-dimensional surface in which PIBAD and TKAD are represented in the x- and y- axes while predicted COGb or ΔCOG is represented on the z-axis. MATLAB 2013a was used to generate the 3-D surface plots from the models (The MathWorks, Inc., Natick, Massachusetts). Because there were age effects, we found it useful to present different age strata as individual plots. In order to make it easier to recognize contour lines and to apply tests of reliable differences, we also generated 2-dimensional plots from the GBM model in which one imaging feature is represented on the x-axis and select values of the other imaging feature are depicted as a series of cubic smoothing spline curves representing fixed values of the other imaging feature.
Confidence limits for the contour plots and for the average difference between sets of lines were calculated using a bootstrap estimate. For each of 1000 bootstrap samples a random set of subjects was chosen, with replacement, and a new GBM model fit to the resulting data set, the subsequent curves derived, and results tabulated over the 1000 resamples.
Statistical tests were presented for descriptive purposes; none of the sets of statistical tests were therefore corrected for multiple testing.
3. Results
Table 1 shows the demographic and imaging features of the 1164 participants, all of whom were cognitively unimpaired by a consensus diagnostic process. By virtue of the stratified sampling design of the MCSA, the group represented the 4 decades from ages 50-90 years approximately equally, with balance between men and women. In the analyses of the relationships between cognition and biomarkers to follow, differences between women and men were limited to a simple shift in baseline global z-scores (higher in women), so that all analyses are presented with men and women combined.
Table 1. Demographic and Imaging Characteristics of MCSA Participants who were Cognitively Unimpaired at Baseline.
| Feature | Result |
|---|---|
| No. of participants | 1164* |
| Age, years mean (SD) | 70 (10) |
| median (IQR), (range) | 71 (63, 77), (51 to 95) |
| Sex, male, no. (%) | 611 (52%) |
| APOE ε4 carrier, no. (%) | 316 (28%) |
| Education, years, mean (SD) | 15 (3) |
| Number (%) of participants by number of exposures to cognitive testing prior to baseline imaging visit | |
| 0 | 605 (52%) |
| 1 | 255 (22%) |
| 2+ | 304 (26%) |
| Global PIB SUVR mean (SD) | 1.5 (0.3) |
| median (IQR), range | 1.3 (1.3, 1.5), 1.0 to 3.2 |
| AD Signature thickness mean (SD) | 2.7 (0.1) |
| median (IQR), (range) | 2.7 (2.6, 2.8), (2.2 to 3.1) |
| Time in study, years mean (SD) | 3.1 (1.7) |
| median (IQR), (range) | 2.6 (1.4, 4.3), (1.0 to 7.1) |
| Baseline MRI scan date range | Feb-2005 to Nov-2014 |
| Baseline PIB PET scan date range | Jan-2006 to Nov-2014 |
| Last follow-up date range | Oct-2007 to Feb-2016 |
1200 participants imaged of whom 36 lacked a usable baseline global z-score
SD=standard deviation; IQR=interquartile range; SUVR= Standardized uptake value ratio; PIB= Pittsburgh Compound B
The distribution of baseline global z-scores (COGb) and the annualized change in global z-scores (ΔCOG) is shown in Figure 1, by age groups. Within the substantial variability of the relationship COGb and ΔCOG, lower baseline scores were more likely to be associated with more annual decline. With advancing age, COGb was generally lower and ΔCOG larger.
Figure 1.
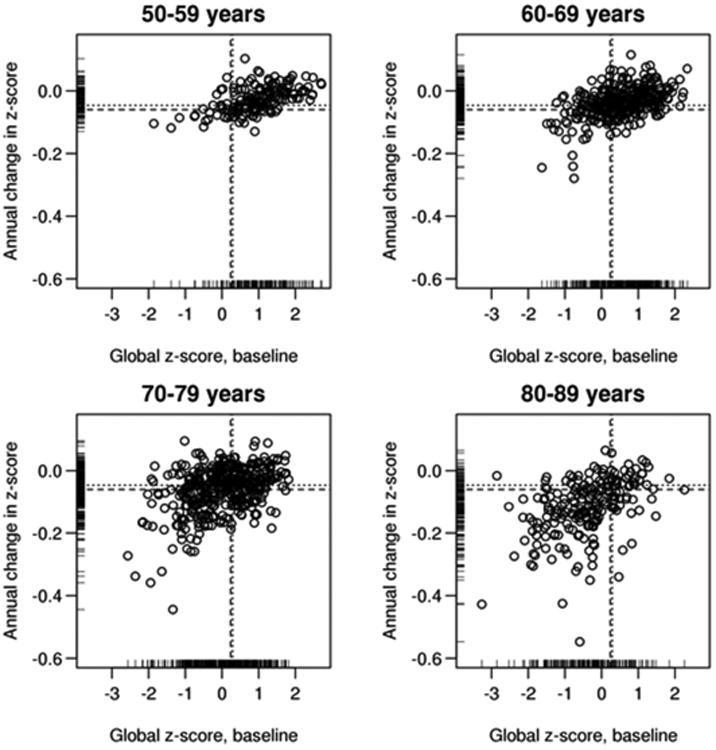
The distribution of baseline global cognitive z-scores (x-axis) and the annualized change in global cognitive z-scores (y-axis) is shown by age groups: 50-59, 60-69, 70-79 and 80-89 years. For purposes of visual display, the change values were calculated from a linear mixed effects model. We modeled log(global z-score) to estimate change expressed as percentage per year. The overall mean (dashed lines) and medial (dotted lines) values are indicated.
Figure 2 shows the distributions of baseline TKAD and PIBAD The PIBAD distribution was highly skewed, which is evident even in the logarithmic scale in Figure 2; the median value was 1.3 SUVR. TKAD was more symmetrically distributed with a median of 2.7 mm. There was a strong age dependence of more abnormal values of TKAD and PIBAD. In the youngest decade of this population-based cohort, there were very few participants with TKAD <2.67 mm or PIBAD >1.4 (cut-points previously derived in our laboratory (Jack et al., 2017)), and no one with both. However, in the older 3 groups, the number of participants with abnormal values (ie, above the PIBad cutpoint and below the TKAD cut-point) increased substantially. Those with higher PIBAD were likely to have lower TKAD. Correlations between PIBAD and TKAD were age-dependent: ages 50-59, rho=0.05 (ns), 60-69, rho=-0.17 (p=0.002), 70-79, rho=-0.13 (p=0.008) and 80-89, rho=-0.10, (p=0.14).
Figure 2.
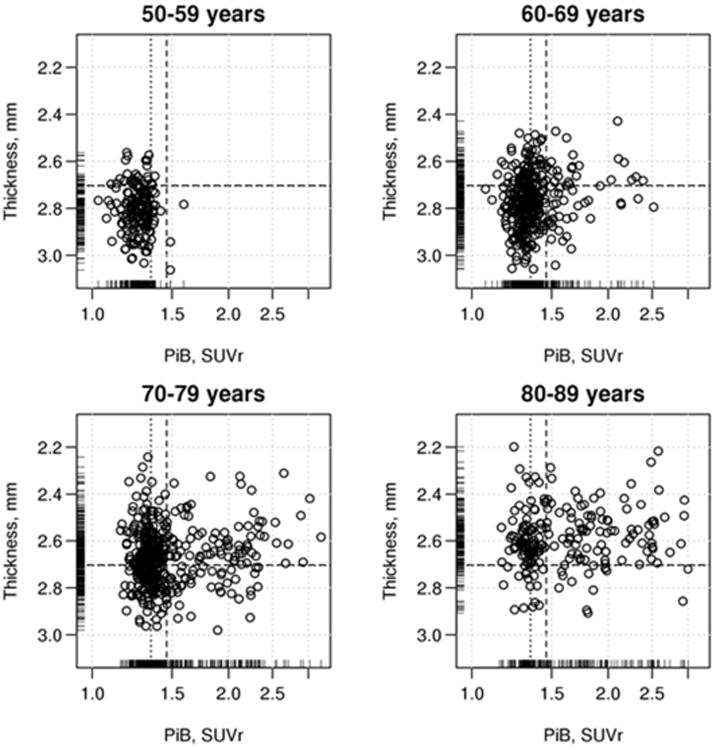
The joint distribution of PIBAD and TKAD by decade of age. The scatterplot shows global β-amyloid in PIB SUVR units (PIBAD) on the x-axis and AD signature cortical thickness (TKAD) in millimeters at baseline on the y-axis, at baseline by decades of age: 50-59, 60-69, 70-79 and 80-89 years. PIBAD is displayed on a logarithmic scale because of its highly skewed distribution. The overall mean (dashed lines) and medial (dotted lines) values are indicated.
The relationship of PIBAD and TKAD to COGb (Figure 3) was represented as a surface that tilted downwards in both x- and y-axes, reflecting the joint effect of both PIBAD and TKAD on cognition. There was a steepening of slope for COGb at a TKAD of approximately 2.5 to 2.6 mm. The bootstrap estimates of reliability showed that COGb values were reliably worse at TKAD of 2.3 or 2.5 mm than at thicker TKAD values (Table 2). COGb appeared linearly and inversely related to rising levels of PIBAD. COGb values at PIBAD SUVR of 1.2 or 1.8 differed reliably only from those at the highest PIBAD value; there was no difference in COGb at the highest levels (2.1 vs 2.5) of PIBAD. The two dimensional relationships are summarized in Figure 4 across all ages, and broken down by age decades in Supplemental Figure 1.
Figure 3.
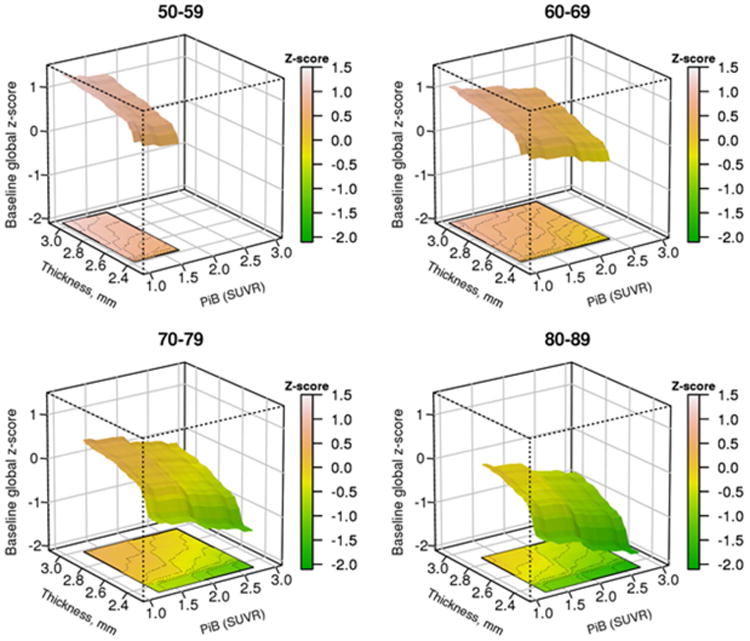
Predicted average “baseline” cognitive global z-score (COGb) from the GBM model by decade of age. (A) Three dimensional plot of PIBAD (x-axis), TKAD (y-axis) and COGb (z-axis) for participants in the age ranges of 50-59, 60-69, 70-79 and 80-89 years. The color code to the right of each figure depicts the level of COGb. The surfaces are truncated according to the range of PIBAD and TKAD values that were found in each decade as shown in Figure 2.
Table 2. Differences in predicted Cognition according to different levels of TKAD and PIBAD, from 1000 replications with replacement. Values across age groups are averaged.
| Thickness | PiB | Mean (SD) | 95% Confidence Interval | P-value |
|---|---|---|---|---|
| 2.3 v 2.5 | fixed | -0.579 (0.144) | (-0.86, -0.30) | <0.001 |
| 2.3 v 2.7 | fixed | -0.870 (0.173) | (-1.21, -0.53) | <0.001 |
| 2.3 v 3 | fixed | -1.156 (0.201) | (-1.55, -0.76) | <0.001 |
| 2.5 v 2.7 | fixed | -0.291 (0.102) | (-0.49, -0.09) | 0.004 |
| 2.5 v 3 | fixed | -0.576 (0.151) | (-0.87, -0.28) | <0.001 |
| 2.7 v 3 | fixed | -0.285 (0.113) | (-0.51, -0.06) | 0.01 |
| fixed | 1.2 v 1.8 | 0.228 (0.084) | (0.06, 0.39) | 0.007 |
| fixed | 1.2 v 2.1 | 0.423 (0.135) | (0.16, 0.69) | 0.002 |
| fixed | 1.2 v 2.5 | 0.629 (0.159) | (0.32, 0.94) | <0.001 |
| fixed | 1.8 v 2.1 | 0.195 (0.099) | (0.00, 0.39) | 0.05 |
| fixed | 1.8 v 2.5 | 0.401 (0.129) | (0.15, 0.65) | 0.002 |
| fixed | 2.1 v 2.5 | 0.206 (0.104) | (0.00, 0.41) | 0.05 |
Figure 4.
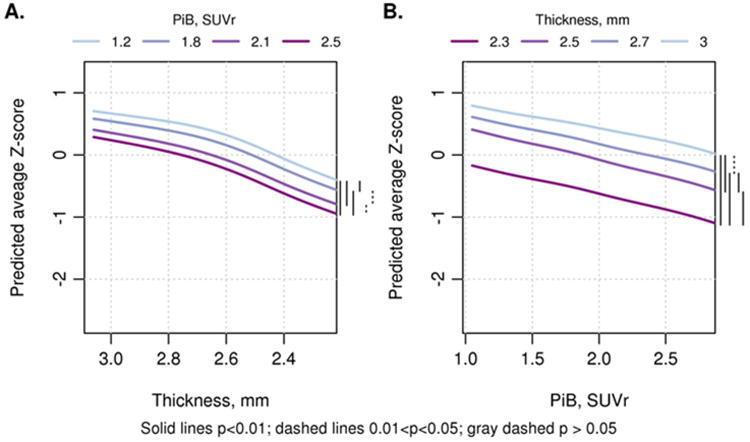
Two dimensional renderings show (A) TKAD (y-axis) by COGb (z-axis) with 4 levels of PIBAD: PIB SUVR values of 1.2, 1.8, 2.1 and 2.5; and (B) PIBAD (x-axis) by COGb (z-axis) with 4 levels of TKAD: cortical thickness in mm: 3, 2.7, 2.5 and 2.3. The curves are combined across ages and on the right hand size of each figure, a bar coding scheme summarizes the reliability statistics (see Table 2 for means and confidence intervals of pair-wise differences). The 2-dimensional renderings for each age group are shown in Supplementary Figure 1.
The relationship of PIBAD and TKAD to ΔCOG also showed that both biomarkers contributed to predicting decline in cognition (Figure 5). At more abnormal biomarker values, ΔCOG became larger (ie there was greater decline in cognition). The bootstrap estimates of reliability (Table 3) showed that ΔCOG declined monotonically from the highest TKAD value to the lowest. PIBAD also predicted ΔCOG across the full range of PIBAD, but the reliability statistics showed that at PIBAD ≥ 1.8 SUVR, more abnormal values of PIBAD were associated with a deceleration of ΔCOG. The 2-dimensional relationships are summarized in Figure 6 across all ages, and broken down by age decades in Supplemental Figure 2.
Figure 5.
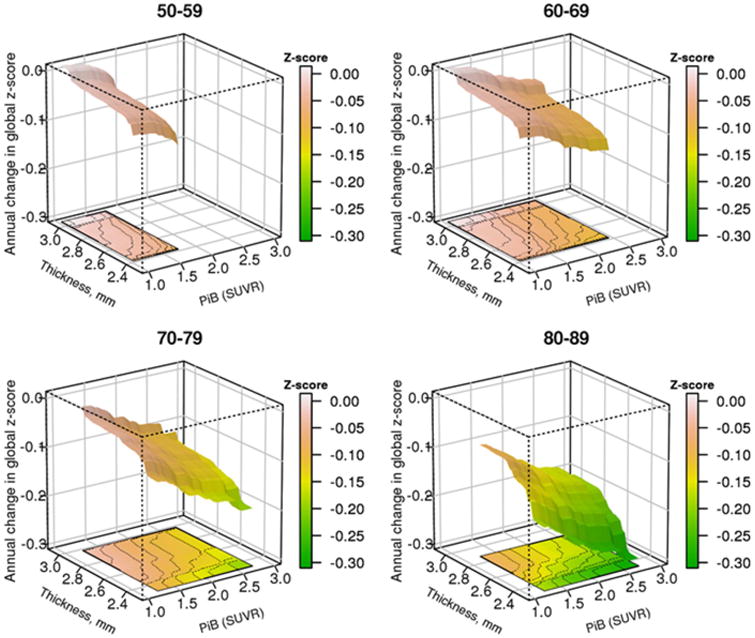
Predicted average annual change in cognitive global z-score (ΔCOG) from the GBM model by decade of age. ΔCOG is a slope estimate calculated for each participant based on their serial cognitive testing using linear mixed models to represent annualized cognitive change. (A) Three dimensional plot of PIBAD (x-axis), TKAD (y-axis) and ΔCOG (z-axis) for participants in the age ranges of 50-59, 60-69, 70-79 and 80-89. The color code to the right of each figure quantitates ΔCOG. The surfaces are truncated according to the range of PIBAD and TKAD values that were found in each decade as shown in Figure 2.
Table 3. Differences in Estimates of Change in Cognition according to different levels of TKAD and PIBAD, from 1000 replications with replacement.
| Thickness | PiB | Mean (SD) | 95% Confidence Interval | P-value |
|---|---|---|---|---|
| 2.3 v 2.5 | fixed | -0.037 (0.019) | (-0.07, 0.00) | 0.06 |
| 2.3 v 2.7 | fixed | -0.056 (0.026) | (-0.11, -0.01) | 0.03 |
| 2.3 v 3 | fixed | -0.074 (0.027) | (-0.13, -0.02) | 0.005 |
| 2.5 v 2.7 | fixed | -0.020 (0.013) | (-0.05, 0.01) | 0.14 |
| 2.5 v 3 | fixed | -0.038 (0.015) | (-0.07, -0.01) | 0.01 |
| 2.7 v 3 | fixed | -0.018 (0.007) | (-0.03, -0.00) | 0.009 |
| fixed | 1.2 v 1.8 | 0.036 (0.013) | (0.01, 0.06) | 0.006 |
| fixed | 1.2 v 2.1 | 0.050 (0.016) | (0.02, 0.08) | 0.002 |
| fixed | 1.2 v 2.5 | 0.066 (0.018) | (0.03, 0.10) | <0.001 |
| fixed | 1.8 v 2.1 | 0.014 (0.009) | (-0.00, 0.03) | 0.13 |
| fixed | 1.8 v 2.5 | 0.030 (0.013) | (0.00, 0.06) | 0.03 |
| fixed | 2.1 v 2.5 | 0.017 (0.012) | (-0.01, 0.04) | 0.15 |
Figure 6.
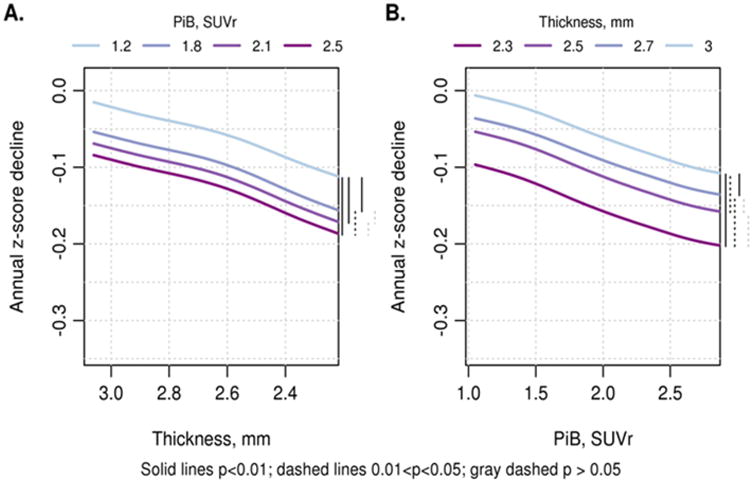
Two dimensional renderings show (A) TKAD (y-axis) by ΔCOG (z-axis) with 4 levels of PIBAD: PIB SUVR values of 1.2, 1.8, 2.1 and 2.5; and (B) PIBAD (x-axis) by ΔCOG (z-axis) with 4 levels of TKAD: cortical thickness in mm: 3, 2.7, 2.5 and 2.3. The curves are combined across ages and on the right hand size of each figure, a bar coding scheme shows the reliability statistics (see Table 3 for means and confidence intervals of pair-wise differences). The 2-dimensional renderings for each age group are shown in Supplementary Figure 1
The GBM model for COGb generated a table of the relative contributions of variables. In the model used for prediction of baseline cognition and including age, education, cognitive test cycle (overall number of cognitive test exposures), sex, APOE e4 genotype, TKAD and PIBAD, age accounted for 40% of effects on cognition, education 23%, TKAD 17% and PIBAD 14%. Sex contributed only 3%, APOE e4 carriage 0.5% and cognitive test cycle 1%.
4. Discussion
Using a 3-dimensional model in a population-based sample of cognitively unimpaired individuals aged 50-90 years, we found that cortical thickness (of a group of regions most affected in AD) and global measure of brain β-amyloid (as measured by PIB PET) were both related to baseline cognition and changes in cognition. We confirmed our first hypothesis, that TKAD and PIBAD were additive with respect to cognitive function. While the relationship of TKAD to ΔCOG was mainly linear, PIBAD SUVR > 1.8 values predicted smaller values for ΔCOG compared to lower PIBAD values. The differing shapes of the TKAD × ΔCOG and PIBAD × ΔCOG functions suggests, in accordance with our second hypothesis, that TKAD may represent a more mechanistically proximate marker of the pathophysiology of cognitive decline than abnormal PIBAD. Nonetheless, β-amyloid levels in the range observed in most of our cognitively unimpaired individuals demonstrated a relationship with declining cognition, even when cortical thickness was accounted for. Our findings are consistent with a model of sporadic late-onset AD in which lower levels of β-amyloid accelerate the deleterious effect of other neurodegenerative processes, which eventually become autonomous of β-amyloid, and then go on to cause cognitive decline (Hyman 2011; Jack et al., 2013a; Bloom 2014; Musiek et al., 2015; Jagust 2016).
Cortical thickness in an AD-meta-ROI (TKAD) is a prototypical biomarker of neurodegeneration, based on evidence from antemortem clinical observations (Sabuncu et al., 2011; Wirth et al., 2013a; Jack et al., 2015; Weston et al., 2016); neuropathological observations (Gomez-Isla et al., 1997; Giannakopoulos et al., 2003; Sawa et al., 2009) and prediction of future dementia (Bakkour et al., 2009; Dickerson et al., 2012; Bakkour et al., 2013). Our current findings extend these prior studies by showing the quantitative relationships of cortical thickness to change in cognition in cognitively unimpaired people across the spectrum of β-amyloid levels. Visually (though not statistically), our modeling showed an increase in downward slope in ΔCOG at a TKAD value around 2.6 mm, which corresponds to the cut-point that we had derived using different methodology (Jack et al., 2017). Both below and above that point, cognition was sensitive to TKAD.
Despite its face validity, TKAD is an incomplete biomarker for AD-related neurodegeneration. As shown elsewhere (Wirth et al., 2013a; Alexopoulos et al., 2014; Toledo et al., 2014; Caroli et al., 2015; Jack et al., 2015), cortical thickness has only moderate correlations with other measures of neurodegeneration, such as cerebrospinal fluid tau levels, hippocampal atrophy or glucose metabolic rate by PET. Our findings are specific to cortical thickness in one meta-ROI, and should not be mistaken as interchangeable with other biomarkers of neurodegeneration. Furthermore, loss of cortical thickness is not specific for AD, as other non-AD neurodegenerative (e.g., primary age related tauopathy (Josephs et al., 2017) or vascular processes (eg, overt cerebrovascular disease (Knopman et al., 2015b), metrics of cerebrovascular health (Leritz et al., 2011) or reduced cardiac output (Sabayan et al., 2015)) are associated with cortical thinning. Nonetheless, our findings demonstrate the linkage between declining cortical thickness in regions relevant to AD and cognition in cognitively unimpaired individuals.
The additive association of PIBAD with TKAD for cognition suggests that PIBAD may be a proxy for neurodegenerative processes independent of cortical thickness. Elevated β-amyloidosis and neurodegeneration, broadly defined, are correlated (Dore et al., 2013; Jack et al., 2013a; Fortea et al., 2014; Villeneuve et al., 2014). It was this confound we sought to shed light on by evaluating PIB PET β- amyloid in the presence of cortical thickness. Indeed, PIBAD in our GBM modeling was associated with cognition consistent with the observations in univariate analyses (Mormino et al., 2012; Hedden et al., 2013; Petersen et al., 2015; Villeneuve et al., 2015; Donohue et al., 2017). Others have also asserted that the relationship of cortical β-amyloidosis to cognition is through neurodegeneration (Becker et al., 2011; Chetelat et al., 2012; Wirth et al., 2013b; Mormino et al., 2014; Villeneuve et al., 2014; Mattsson et al., 2015). Elevated β-amyloid levels, even in cognitively unimpaired persons, are associated with higher tau PET signal (Vemuri et al., 2017b).
Our results showed a diminution of the association of cognitive decline with PIBAD SUVR > 1.8, suggesting that higher PIBAD levels are less strongly linked to neurodegeneration. We cannot exclude the possibility that associations between β-amyloidosis at high PIBAD levels and cognition could be mediated by some other β-amyloid species not detected by PIB PET (e.g., oligomers (Esparza et al., 2013)). However, the dramatically long time period and slow rate over which β-amyloid accumulation occurs preclinically (Rowe et al., 2010; Jack et al., 2013b; Villemagne et al., 2013) could contribute to the de-linking of high levels of β-amyloid and subsequent cognitive decline. It is likely that β-amyloid levels are an indicator of the maturity of neuronal dysfunction induced by nonβ-amyloid mechanisms.
Age had large effects on baseline cognition and on biomarker levels. As shown in Figure 1, very few study participants under age 60 years experienced cognitive decline. Figure 2 shows the increasing proportion of participants over age 70 years with TKAD <2.5 mm, in keeping with well recognized declines in cortical thickness that occur with aging (Salat et al., 2004; Raz et al., 2005; Fjell et al., 2014; Knopman et al., 2016). Age has a similarly substantial role in driving associations with cortical thickness in persons with AD dementia (Knopman et al., 2016). The same was true for the strong age dependence of elevated brain β-amyloid (Jack et al., 2014). The other confounding effect of age is that cerebrovascular disease and non-AD neurodegenerative diseases increase in prevalence with advancing age (Nelson et al., 2011); their presence could attenuate associations between cognition and β-amyloidosis or cortical thickness. Despite all of these age-dependent differences, the GBM model showed that the joint relationships between cortical thickness and brain β-amyloid to cognition were very similar across ages 50 and 90 years.
Our results show both the limitations of using dichotomous models to characterize cortical thickness and brain β-amyloid: within the “normal” and “abnormal” ranges of each biomarker, cognition varies over a substantial range. On the other hand, the modest amount of nonlinearity plus the clear demonstration of the additive effects of PIBAD and TKAD support the use of dichotomous models.
Strengths of our analysis included the large, well characterized cohort and the ability to implement the GBM model. In contrast to linear mixed models, GBM has a number of advantages, the two major ones being that GBM makes no assumptions about the functional form of relationship and that GBM does not result in over-fitting of the data. Its disadvantage is that as currently operationalized, the method requires a boot-strap method to generate measures of statistical reliability.
There were limitations to our analyses that were necessitated by our strategic focus on cognitively unimpaired individuals, as well as limitations imposed by the complexity of the processes we studied. Thus, there was a truncated range of cortical thickness, β-amyloid and cognitive function because our analyses included only unimpaired individuals. Second, we included individuals who were given consensus diagnoses of cognitively unimpaired. We strongly favor the use of consensus clinical diagnoses based on discussion among the clinicians who interacted with the participant because expert consensus diagnoses are an efficient way to include information from different sources into a single diagnosis. That meant that a small fraction of persons (4.5%) in our study group had global z-scores that were worse than -1.5, the commonly used but arbitrary cut score for cognitive impairment (Knopman et al., 2015a). We reran our analyses with excluding these individuals, and there were no differences in outcomes. We therefore retained these individuals in our analyses in order to maintain consistency with our prior and future publications. Third, we focused on global cognition rather than individual domains to demonstrate relationships. We have conducted analyses with memory or attention/executive cognitive domains, and found very similar relationships to those with global cognition. Furthermore, the current cortical thickness meta-ROI is the one our laboratory is using in categorical analyses. Fourth, our period of follow-up was relatively short. While that attenuated effects of drop-out, short observation periods make determinations of cognitive changes in high-functioning persons noisy. We attempted to mitigate that problem by including cognitive test data from visits that preceded the initial imaging visit. Fifth, we chose to examine only one cortical thickness meta-ROI, rather than perform the analyses on either all ROI's or on all cortical voxels. Prior analyses demonstrated that the AD signature ROI that we used faithfully reflected volumetric changes in persons in the AD pathway (Whitwell et al., 2013; Schwarz et al., 2016b).
Finally, we did not include tau PET in our analyses. Although regional tau PET and cortical thickness are strongly correlated in persons with AD dementia (Xia et al., 2017), the low tau PET signal outside of the medial temporal lobe in cognitively unimpaired individuals (Johnson et al., 2015; Brier et al., 2016; Cho et al., 2016; Ossenkoppele et al., 2016; Scholl et al., 2016; Schwarz et al., 2016a) will present unique challenges to modeling that are beyond the scope of the current analyses.
Supplementary Material
Key points.
PIB PET and cortical thickness were analyzed in cognitively unimpaired individuals
Cortical thickness was associated with cognition and cognitive decline
PIB PET was associated with cognition, even with cortical thickness in model
Continuous modeling supports the use of dichotomous categorization of biomarker status.
Acknowledgments
This work was supported by NIH grants P50 AG16574, U01 AG06786, R01 AG034676, R01 AG41851, and R01 AG11378, the Elsie and Marvin Dekelboum Family Foundation, the Robert H. and Clarice Smith and Abigail Van Buren Alzheimer's Disease Research Program of the Mayo Foundation, GHR Foundation, Alexander Family Alzheimer's Disease Research Professorship of the Mayo Clinic, a Liston Award, Schuler Foundation and the Mayo Foundation for Medical Education and Research
Disclosures: Dr. Knopman serves on a Data Safety Monitoring Board for the DIAN study, and previously had served on a Data Safety Monitoring Board for Lundbeck Pharmaceuticals; is an investigator in clinical trials sponsored by Biogen, Lilly Pharmaceuticals and the Alzheimer's Disease Cooperative Study; and receives research support from the NIH.
Dr. Jack serves on scientific advisory board for Eli Lilly & Company; receives research support from the NIH/NIA, and the Alexander Family Alzheimer's Disease Research Professorship of the Mayo Foundation; and holds stock in Johnson & Johnson.
Ms. Lundt reports no disclosures
Dr. Vemuri receives research grants from the NIH/NIA.
Dr. Mielke served as a consultant to Eli Lilly and Lysosomal Therapeutics, Inc. She receives research support from the National Institutes of Health (R01 AG49704, P50 AG44170, U01 AG06786, RF1 AG55151), Department of Defense (W81XWH-15-1), and unrestricted research grants from Biogen, Roche, and Lundbeck.
Dr. Machulda receives research support from the NIH/NIA & NIDCD.
Dr. Lowe serves on scientific advisory boards for Bayer Schering Pharma, Merck Research, Piramal Life Sciences and receives research support from GE Healthcare, Siemens Molecular Imaging, AVID Radiopharmaceuticals and the NIH (NIA, NCI)
Dr. Kantarci receives research grants from the NIH/NIA.
Dr. Gunter reports no disclosures.
Mr. Senjem reports no disclosures.
Dr. Jones reports no disclosures.
Dr. Roberts reports no disclosures. She receives research grants from the NIH/NIA.
Dr. Boeve has served as an investigator for clinical trials sponsored by GE Healthcare, FORUM Pharmaceuticals, C2N Diagnostics and Axovant. He receives publishing royalties Behavioral Neurology Of Dementia (Cambridge Medicine, 2009, 2016). He serves on the Scientific Advisory Board of the Tau Consortium. He receives research support from the NIH, the Mayo Clinic Dorothy, Harry T. Mangurian Jr. Lewy Body Dementia Program and the Little Family Foundation.
Dr. Therneau receives research grants from the NIH.
Dr. Petersen serves on data monitoring committees for Janssen Alzheimer Immunotherapy, and is a consultant for Biogen, Roche, Merck, Genentech, Inc; receives publishing royalties from Mild Cognitive Impairment (Oxford University Press, 2003), and receives research support from the NIH/NIA
Abbreviations
- Predicted “baseline” cognition
global z-score (COGb), Annual Change in global z-score (ΔCOG), cortical thickness measured in an AD signature meta-ROI (TKAD).
- Pittsburgh Compound B Positron emission tomography (PIB PET)
Standardized uptake value ratio (SUVR), PIB PET SUVR in regions associated with β-amyloid (PIBAD)
Footnotes
Author Contributions: Dr. Knopman – Generated first draft and completed final draft. Study concept and design; acquisition of data; analysis and interpretation; critical revision of the manuscript for important intellectual content
Dr. Jack - analysis and interpretation; critical revision of the manuscript for important intellectual content; study supervision
Ms. Lundt – analysis and interpretation; critical revision of the manuscript for important intellectual content
Dr. Vemuri - critical revision of the manuscript for important intellectual content
Dr. Mielke - critical revision of the manuscript for important intellectual content
Dr. Machulda - critical revision of the manuscript for important intellectual content
Dr. Lowe - critical revision of the manuscript for important intellectual content
Dr. Kantarci - critical revision of the manuscript for important intellectual content
Dr. Gunter - critical revision of the manuscript for important intellectual content
Mr. Senjem – analysis, critical revision of the manuscript for important intellectual content
Dr. Jones - critical revision of the manuscript for important intellectual content
Dr. Roberts - critical revision of the manuscript for important intellectual content
Dr. Boeve - acquisition of data; critical revision of the manuscript for important intellectual content
Dr. Therneau – devised analytic plan; analysis and interpretation; critical revision of the manuscript for important intellectual content; study supervision
Dr. Petersen - acquisition of data; critical revision of the manuscript for important intellectual content; Study supervision
Publisher's Disclaimer: This is a PDF file of an unedited manuscript that has been accepted for publication. As a service to our customers we are providing this early version of the manuscript. The manuscript will undergo copyediting, typesetting, and review of the resulting proof before it is published in its final citable form. Please note that during the production process errors may be discovered which could affect the content, and all legal disclaimers that apply to the journal pertain.
References
- Alexopoulos P, Kriett L, Haller B, Klupp E, Gray K, Grimmer T, Laskaris N, Forster S, Perneczky R, Kurz A, Drzezga A, Fellgiebel A, Yakushev I. Limited agreement between biomarkers of neuronal injury at different stages of Alzheimer's disease. Alzheimers Dement. 2014;10:684–689. doi: 10.1016/j.jalz.2014.03.006. [DOI] [PubMed] [Google Scholar]
- Bakkour A, Morris JC, Dickerson BC. The cortical signature of prodromal AD: regional thinning predicts mild AD dementia. Neurology. 2009;72:1048–1055. doi: 10.1212/01.wnl.0000340981.97664.2f. [DOI] [PMC free article] [PubMed] [Google Scholar]
- Bakkour A, Morris JC, Wolk DA, Dickerson BC. The effects of aging and Alzheimer's disease on cerebral cortical anatomy: specificity and differential relationships with cognition. Neuroimage. 2013;76:332–344. doi: 10.1016/j.neuroimage.2013.02.059. [DOI] [PMC free article] [PubMed] [Google Scholar]
- Becker JA, Hedden T, Carmasin J, Maye J, Rentz DM, Putcha D, Fischl B, Greve DN, Marshall GA, Salloway S, Marks D, Buckner RL, Sperling RA, Johnson KA. Amyloid-beta associated cortical thinning in clinically normal elderly. Ann Neurol. 2011;69:1032–1042. doi: 10.1002/ana.22333. [DOI] [PMC free article] [PubMed] [Google Scholar]
- Bloom GS. Amyloid-beta and Tau: The Trigger and Bullet in Alzheimer Disease Pathogenesis. JAMA Neurol. 2014;71:505–508. doi: 10.1001/jamaneurol.2013.5847. [DOI] [PMC free article] [PubMed] [Google Scholar]
- Brier MR, Gordon B, Friedrichsen K, McCarthy J, Stern A, Christensen J, Owen C, Aldea P, Su Y, Hassenstab J, Cairns NJ, Holtzman DM, Fagan AM, Morris JC, Benzinger TL, Ances BM. Tau and Abeta imaging, CSF measures, and cognition in Alzheimer's disease. Sci Transl Med. 2016;8:338ra366. doi: 10.1126/scitranslmed.aaf2362. [DOI] [PMC free article] [PubMed] [Google Scholar]
- Caroli A, Prestia A, Galluzzi S, Ferrari C, van der Flier WM, Ossenkoppele R, Van Berckel B, Barkhof F, Teunissen C, Wall AE, Carter SF, Scholl M, Choo IH, Grimmer T, Redolfi A, Nordberg A, Scheltens P, Drzezga A, Frisoni GB. Mild cognitive impairment with suspected nonamyloid pathology (SNAP): Prediction of progression. Neurology. 2015;84:508–515. doi: 10.1212/WNL.0000000000001209. [DOI] [PMC free article] [PubMed] [Google Scholar]
- Chetelat G, Villemagne VL, Villain N, Jones G, Ellis KA, Ames D, Martins RN, Masters CL, Rowe CC. Accelerated cortical atrophy in cognitively normal elderly with high beta-amyloid deposition. Neurology. 2012;78:477–484. doi: 10.1212/WNL.0b013e318246d67a. [DOI] [PubMed] [Google Scholar]
- Cho H, Choi JY, Hwang MS, Kim YJ, Lee HM, Lee HS, Lee JH, Ryu YH, Lee MS, Lyoo CH. In vivo cortical spreading pattern of tau and amyloid in the Alzheimer disease spectrum. Ann Neurol. 2016;80:247–258. doi: 10.1002/ana.24711. [DOI] [PubMed] [Google Scholar]
- Dickerson BC, Wolk DA. MRI cortical thickness biomarker predicts AD-like CSF and cognitive decline in normal adults. Neurology. 2012;78:84–90. doi: 10.1212/WNL.0b013e31823efc6c. [DOI] [PMC free article] [PubMed] [Google Scholar]
- Donohue MC, Sperling RA, Petersen R, Sun CK, Weiner MW, Aisen PS. Association Between Elevated Brain Amyloid and Subsequent Cognitive Decline Among Cognitively Normal Persons. JAMA. 2017;317:2305–2316. doi: 10.1001/jama.2017.6669. [DOI] [PMC free article] [PubMed] [Google Scholar]
- Dore V, Villemagne VL, Bourgeat P, Fripp J, Acosta O, Chetelat G, Zhou L, Martins R, Ellis KA, Masters CL, Ames D, Salvado O, Rowe CC. Cross-sectional and longitudinal analysis of the relationship between Abeta deposition, cortical thickness, and memory in cognitively unimpaired individuals and in Alzheimer disease. JAMA Neurol. 2013;70:903–911. doi: 10.1001/jamaneurol.2013.1062. [DOI] [PubMed] [Google Scholar]
- Esparza TJ, Zhao H, Cirrito JR, Cairns NJ, Bateman RJ, Holtzman DM, Brody DL. Amyloid-beta oligomerization in Alzheimer dementia versus high-pathology controls. Ann Neurol. 2013;73:104–119. doi: 10.1002/ana.23748. [DOI] [PMC free article] [PubMed] [Google Scholar]
- Farrell ME, Kennedy KM, Rodrigue KM, Wig G, Bischof GN, Rieck JR, Chen X, Festini SB, Devous MD, Sr, Park DC. Association of Longitudinal Cognitive Decline With Amyloid Burden in Middle-aged and Older Adults: Evidence for a Dose-Response Relationship. JAMA Neurol. 2017;74:830–838. doi: 10.1001/jamaneurol.2017.0892. doi:810.1001/jamaneurol.2017.0892. [DOI] [PMC free article] [PubMed] [Google Scholar]
- Fjell AM, Westlye LT, Grydeland H, Amlien I, Espeseth T, Reinvang I, Raz N, Dale AM, Walhovd KB. Accelerating cortical thinning: unique to dementia or universal in aging? Cereb Cortex. 2014;24:919–934. doi: 10.1093/cercor/bhs379. [DOI] [PMC free article] [PubMed] [Google Scholar]
- Fortea J, Vilaplana E, Alcolea D, Carmona-Iragui M, Sanchez-Saudinos MB, Sala I, Anton-Aguirre S, Gonzalez S, Medrano S, Pegueroles J, Morenas E, Clarimon J, Blesa R, Lleo A. Cerebrospinal fluid beta-amyloid and phospho-tau biomarker interactions affecting brain structure in preclinical Alzheimer disease. Ann Neurol. 2014;76:223–230. doi: 10.1002/ana.24186. [DOI] [PubMed] [Google Scholar]
- Friedman J. Greedy function approximation: A gradient boosting machine. Ann Statistics. 2001;29:1189–1232. [Google Scholar]
- Giannakopoulos P, Herrmann FR, Bussiere T, Bouras C, Kovari E, Perl DP, Morrison JH, Gold G, Hof PR. Tangle and neuron numbers, but not amyloid load, predict cognitive status in Alzheimer's disease. Neurology. 2003;60:1495–1500. doi: 10.1212/01.wnl.0000063311.58879.01. [DOI] [PubMed] [Google Scholar]
- Gomez-Isla T, Hollister R, West H, Mui S, Growdon JH, Petersen RC, Parisi JE, Hyman BT. Neuronal loss correlates with but exceeds neurofibrillary tangles in Alzheimer's disease. Ann Neurol. 1997;41:17–24. doi: 10.1002/ana.410410106. [DOI] [PubMed] [Google Scholar]
- Hedden T, Oh H, Younger AP, Patel TA. Meta-analysis of amyloid-cognition relations in cognitively normal older adults. Neurology. 2013;80:1341–1348. doi: 10.1212/WNL.0b013e31828ab35d. [DOI] [PMC free article] [PubMed] [Google Scholar]
- Hyman BT. Amyloid-dependent and amyloid-independent stages of Alzheimer disease. Arch Neurol. 2011;68:1062–1064. doi: 10.1001/archneurol.2011.70. [DOI] [PubMed] [Google Scholar]
- Insel PS, Donohue MC, Mackin RS, Aisen PS, Hansson O, Weiner MW, Mattsson N. Cognitive and functional changes associated with Abeta pathology and the progression to mild cognitive impairment. Neurobiol Aging. 2016;48:172–181. doi: 10.1016/j.neurobiolaging.2016.08.017. 10.1016/j.neurobiolaging.2016.1008.1017. Epub 2016 Aug 1026. [DOI] [PubMed] [Google Scholar]
- Ivnik RJ, Malec JF, Smith GE, Tangalos E, Petersen RC, Kokmen E, Kurland LT. Mayo's Older Americans Normative Studies Updated AVLT Norms for ages 59-97. Clin Neuropsychol. 1992;6(suppl):83–104. [Google Scholar]
- Jack CR, Jr, Knopman DS, Chetelat G, Dickson D, Fagan AM, Frisoni GB, Jagust W, Mormino EC, Petersen RC, Sperling RA, van der Flier WM, Villemagne VL, Visser PJ, Vos SJ. Suspected non-Alzheimer disease pathophysiology - concept and controversy. Nat Rev Neurol. 2016;12:117–124. doi: 10.1038/nrneurol.2015.251. [DOI] [PMC free article] [PubMed] [Google Scholar]
- Jack CR, Jr, Knopman DS, Jagust WJ, Petersen RC, Weiner MW, Aisen PS, Shaw LM, Vemuri P, Wiste HJ, Weigand SD, Lesnick TG, Pankratz VS, Donohue MC, Trojanowski JQ. Tracking pathophysiological processes in Alzheimer's disease: an updated hypothetical model of dynamic biomarkers. Lancet Neurol. 2013a;12:207–216. doi: 10.1016/S1474-4422(12)70291-0. [DOI] [PMC free article] [PubMed] [Google Scholar]
- Jack CR, Jr, Lowe VJ, Senjem ML, Weigand SD, Kemp BJ, Shiung MM, Knopman DS, Boeve BF, Klunk WE, Mathis CA, Petersen RC. 11C PiB and structural MRI provide complementary information in imaging of Alzheimer's disease and amnestic mild cognitive impairment. Brain. 2008;131:665–680. doi: 10.1093/brain/awm336. [DOI] [PMC free article] [PubMed] [Google Scholar]
- Jack CR, Jr, Wiste HJ, Lesnick TG, Weigand SD, Knopman DS, Vemuri P, Pankratz VS, Senjem ML, Gunter JL, Mielke MM, Lowe VJ, Boeve BF, Petersen RC. Brain beta-amyloid load approaches a plateau. Neurology. 2013b;80:890–896. doi: 10.1212/WNL.0b013e3182840bbe. [DOI] [PMC free article] [PubMed] [Google Scholar]
- Jack CR, Jr, Wiste HJ, Weigand SD, Rocca WA, Knopman DS, Mielke MM, Lowe VJ, Senjem ML, Gunter JL, Preboske GM, Pankratz VS, Vemuri P, Petersen RC. Age-specific population frequencies of cerebral beta-amyloidosis and neurodegeneration among people with normal cognitive function aged 50-89 years: a cross-sectional study. Lancet Neurol. 2014;13:997–1005. doi: 10.1016/S1474-4422(14)70194-2. [DOI] [PMC free article] [PubMed] [Google Scholar]
- Jack CR, Wiste HJ, Weigand SD, Therneau TM, Lowe VJ, Knopman DS, Gunter JL, Senjem ML, Jones DT, Kantarci K, Machulda MM, Mielke MM, Roberts RO, Vemuri P, Reyes D, Petersen RC. Defining imaging biomarker cut-points for brain aging and Alzheimer's disease. Alzheimer's and Dementia. 2017;13:205–216. doi: 10.1016/j.jalz.2016.08.005. [DOI] [PMC free article] [PubMed] [Google Scholar]
- Jack CRJ, Wiste HJ, Weigand SD, Knopman DS, Mielke MM, Vemuri P, Lowe V, Senjem ML, Gunter JL, Reyes D, Machulda MM, Roberts R, Petersen RC. Different definitions of neurodegeneration produce similar frequencies of amyloid and neurodegeneration biomarker groups by age among cognitively non-impaired individuals. Brain. 2015;138:3747–3759. doi: 10.1093/brain/awv283. [DOI] [PMC free article] [PubMed] [Google Scholar]
- Jagust W. Is amyloid-beta harmful to the brain? Insights from human imaging studies. Brain. 2016;139:23–30. doi: 10.1093/brain/awv326. [DOI] [PMC free article] [PubMed] [Google Scholar]
- Johnson KA, Schultz A, Betensky RA, Becker JA, Sepulcre J, Rentz D, Mormino E, Chhatwal J, Amariglio R, Papp K, Marshall G, Albers M, Mauro S, Pepin L, Alverio J, Judge K, Philiossaint M, Shoup T, Yokell D, Dickerson B, Gomez-Isla T, Hyman B, Vasdev N, Sperling R. Tau PET imaging in aging and early Alzheimer's disease. Ann Neurol. 2015;79:110–119. doi: 10.1002/ana.24546. [DOI] [PMC free article] [PubMed] [Google Scholar]
- Josephs KA, Murray ME, Tosakulwong N, Whitwell JL, Knopman DS, Machulda MM, Weigand SD, Boeve BF, Kantarci K, Petrucelli L, Lowe VJ, Jack CR, Jr, Petersen RC, Parisi JE, Dickson DW. Tau aggregation influences cognition and hippocampal atrophy in the absence of beta-amyloid: a clinico-imaging-pathological study of primary age-related tauopathy (PART) Acta Neuropathol. 2017;133:705–715. doi: 10.1007/s00401-017-1681-2. [DOI] [PMC free article] [PubMed] [Google Scholar]
- Kaplan E, Goodglass H, Weintraub S. The Boston Naming Test. 2nd. Boston, Lea & Fabiger; 1978. [Google Scholar]
- Knopman DS, Beiser A, Machulda MM, Fields J, Roberts RO, Pankratz VS, Aakre J, Cha RH, Rocca WA, Mielke MM, Boeve BF, Devine S, Ivnik RJ, Au R, Auerbach S, Wolf PA, Seshadri S, Petersen RC. Spectrum of cognition short of dementia: Framingham Heart Study and Mayo Clinic Study of Aging. Neurology. 2015a;85:1712–1721. doi: 10.1212/WNL.0000000000002100. [DOI] [PMC free article] [PubMed] [Google Scholar]
- Knopman DS, Griswold ME, Lirette ST, Gottesman RF, Kantarci K, Sharrett AR, Jack CR, Jr, Graff-Radford J, Schneider AL, Windham BG, Coker LH, Albert MS, Mosley TH., Jr Vascular imaging abnormalities and cognition: mediation by cortical volume in nondemented individuals: atherosclerosis risk in communities-neurocognitive study. Stroke. 2015b;46:433–440. doi: 10.1161/STROKEAHA.114.007847. [DOI] [PMC free article] [PubMed] [Google Scholar]
- Knopman DS, Jack CR, Jr, Wiste HJ, Weigand SD, Vemuri P, Lowe VJ, Kantarci K, Gunter JL, Senjem ML, Mielke MM, Machulda MM, Roberts RO, Boeve BF, Jones DT, Petersen RC. Age and neurodegeneration imaging biomarkers in persons with Alzheimer disease dementia. Neurology. 2016;87:691–698. doi: 10.1212/WNL.0000000000002979. [DOI] [PMC free article] [PubMed] [Google Scholar]
- Leritz EC, Salat DH, Williams VJ, Schnyer DM, Rudolph JL, Lipsitz L, Fischl B, McGlinchey RE, Milberg WP. Thickness of the human cerebral cortex is associated with metrics of cerebrovascular health in a normative sample of community dwelling older adults. Neuroimage. 2011;54:2659–2671. doi: 10.1016/j.neuroimage.2010.10.050. [DOI] [PMC free article] [PubMed] [Google Scholar]
- Lucas JA, Ivnik RJ, Smith GE, Bohac DL, Tangalos EG, Graff-Radford NR, Petersen RC. Mayo's older Americans normative studies: category fluency norms. J Clin Exp Neuropsychol. 1998;20:194–200. doi: 10.1076/jcen.20.2.194.1173. [DOI] [PubMed] [Google Scholar]
- Machulda MM, Pankratz VS, Christianson TJ, Ivnik RJ, Mielke MM, Roberts RO, Knopman DS, Boeve BF, Petersen RC. Practice effects and longitudinal cognitive change in normal aging vs. incident mild cognitive impairment and dementia in the Mayo Clinic Study of Aging. Clin Neuropsychol. 2013;27:1247–1264. doi: 10.1080/13854046.2013.836567. [DOI] [PMC free article] [PubMed] [Google Scholar]
- Mattsson N, Insel PS, Aisen PS, Jagust W, Mackin S, Weiner M. Brain structure and function as mediators of the effects of amyloid on memory. Neurology. 2015;84:1136–1144. doi: 10.1212/WNL.0000000000001375. [DOI] [PMC free article] [PubMed] [Google Scholar]
- Mormino EC, Betensky RA, Hedden T, Schultz AP, Amariglio RE, Rentz DM, Johnson KA, Sperling RA. Synergistic effect of beta-amyloid and neurodegeneration on cognitive decline in clinically normal individuals. JAMA Neurol. 2014;71:1379–1385. doi: 10.1001/jamaneurol.2014.2031. [DOI] [PMC free article] [PubMed] [Google Scholar]
- Mormino EC, Brandel MG, Madison CM, Rabinovici GD, Marks S, Baker SL, Jagust WJ. Not quite PIB-positive, not quite PIB-negative: Slight PIB elevations in elderly normal control subjects are biologically relevant. Neuroimage. 2012;59:1152–1160. doi: 10.1016/j.neuroimage.2011.07.098. [DOI] [PMC free article] [PubMed] [Google Scholar]
- Murray ME, Lowe VJ, Graff-Radford NR, Liesinger AM, Cannon A, Przybelski SA, Rawal B, Parisi JE, Petersen RC, Kantarci K, Ross OA, Duara R, Knopman DS, Jack CR, Jr, Dickson DW. Clinicopathologic and 11C-Pittsburgh compound B implications of Thal amyloid phase across the Alzheimer's disease spectrum. Brain. 2015;138:1370–1381. doi: 10.1093/brain/awv050. [DOI] [PMC free article] [PubMed] [Google Scholar]
- Musiek ES, Holtzman DM. Three dimensions of the amyloid hypothesis: time, space and ‘wingmen’. Nat Neurosci. 2015;18:800–806. doi: 10.1038/nn.4018. [DOI] [PMC free article] [PubMed] [Google Scholar]
- Nelson PT, Head E, Schmitt FA, Davis PR, Neltner JH, Jicha GA, Abner EL, Smith CD, Van Eldik LJ, Kryscio RJ, Scheff SW. Alzheimer's disease is not “brain aging”: neuropathological, genetic, and epidemiological human studies. Acta Neuropathol. 2011;121:571–587. doi: 10.1007/s00401-011-0826-y. [DOI] [PMC free article] [PubMed] [Google Scholar]
- Ossenkoppele R, Schonhaut DR, Scholl M, Lockhart SN, Ayakta N, Baker SL, O'Neil JP, Janabi M, Lazaris A, Cantwell A, Vogel J, Santos M, Miller ZA, Bettcher BM, Vossel KA, Kramer JH, Gorno-Tempini ML, Miller BL, Jagust WJ, Rabinovici GD. Tau PET patterns mirror clinical and neuroanatomical variability in Alzheimer's disease. Brain. 2016;139:1551–1567. doi: 10.1093/brain/aww027. [DOI] [PMC free article] [PubMed] [Google Scholar]
- Petersen RC. Mild cognitive impairment as a diagnostic entity. J Intern Med. 2004;256:183–194. doi: 10.1111/j.1365-2796.2004.01388.x. [DOI] [PubMed] [Google Scholar]
- Petersen RC, Roberts RO, Knopman DS, Geda YE, Cha RC, Pankratz VS, Boeve BF, Tangalos EG, Ivnik RJ, Rocca WA. Prevalence of mild cognitive impairment is higher in men than in women. The Mayo Clinic Study of Aging Neurology. 2010;75:889–897. doi: 10.1212/WNL.0b013e3181f11d85. [DOI] [PMC free article] [PubMed] [Google Scholar]
- Petersen RC, Wiste HJ, Weigand SD, Rocca WA, Roberts RO, Mielke MM, Lowe VJ, Knopman DS, Pankratz VS, Machulda MM, Geda YE, Jack CR., Jr Association of Elevated Amyloid Levels With Cognition and Biomarkers in Cognitively Normal People From the Community. JAMA Neurol. 2015;73:85–92. doi: 10.1001/jamaneurol.2015.3098. [DOI] [PMC free article] [PubMed] [Google Scholar]
- Raz N, Lindenberger U, Rodrigue KM, Kennedy KM, Head D, Williamson A, Dahle C, Gerstorf D, Acker JD. Regional brain changes in aging healthy adults: general trends, individual differences and modifiers. Cereb Cortex. 2005;15:1676–1689. doi: 10.1093/cercor/bhi044. [DOI] [PubMed] [Google Scholar]
- Reitan R. Validity of the Trail-making test as an indication of organic brain damage. Percept Mot Skills. 1958;8:271–276. [Google Scholar]
- Roberts RO, Geda YE, Knopman D, Cha R, Pankratz VS, Boeve B, Ivnik R, Tangalos E, Petersen RC, Rocca WA. The Mayo Clinic Study of Aging: Design and Sampling, Participation, Baseline Measures and Sample Characteristics. Neuroepidemiology. 2008;30:58–69. doi: 10.1159/000115751. [DOI] [PMC free article] [PubMed] [Google Scholar]
- Roberts RO, Geda YE, Knopman DS, Cha RH, Pankratz VS, Boeve BF, Tangalos EG, Ivnik RJ, Rocca WA, Petersen RC. The incidence of MCI differs by subtype and is higher in men: The Mayo Clinic Study of Aging. Neurology. 2012;78:342–351. doi: 10.1212/WNL.0b013e3182452862. [DOI] [PMC free article] [PubMed] [Google Scholar]
- Roberts RO, Knopman DS, Mielke MM, Cha RH, Pankratz VS, Christianson TJ, Geda YE, Boeve BF, Ivnik RJ, Tangalos EG, Rocca WA, Petersen RC. Higher risk of progression to dementia in mild cognitive impairment cases who revert to normal. Neurology. 2014;82:317–325. doi: 10.1212/WNL.0000000000000055. [DOI] [PMC free article] [PubMed] [Google Scholar]
- Rowe CC, Ellis KA, Rimajova M, Bourgeat P, Pike KE, Jones G, Fripp J, Tochon-Danguy H, Morandeau L, O'Keefe G, Price R, Raniga P, Robins P, Acosta O, Lenzo N, Szoeke C, Salvado O, Head R, Martins R, Masters CL, Ames D, Villemagne VL. Amyloid imaging results from the Australian Imaging, Biomarkers and Lifestyle (AIBL) study of aging. Neurobiol Aging. 2010;31:1275–1283. doi: 10.1016/j.neurobiolaging.2010.04.007. [DOI] [PubMed] [Google Scholar]
- Sabayan B, van Buchem MA, Sigurdsson S, Zhang Q, Harris TB, Gudnason V, Arai AE, Launer LJ. Cardiac hemodynamics are linked with structural and functional features of brain aging: the age, gene/environment susceptibility (AGES)-Reykjavik Study. J Am Heart Assoc. 2015;4:e001294. doi: 10.1161/JAHA.114.001294. [DOI] [PMC free article] [PubMed] [Google Scholar]
- Sabuncu MR, Desikan RS, Sepulcre J, Yeo BT, Liu H, Schmansky NJ, Reuter M, Weiner MW, Buckner RL, Sperling RA, Fischl B. The dynamics of cortical and hippocampal atrophy in Alzheimer disease. Arch Neurol. 2011;68:1040–1048. doi: 10.1001/archneurol.2011.167. [DOI] [PMC free article] [PubMed] [Google Scholar]
- Salat DH, Buckner RL, Snyder AZ, Greve DN, Desikan RS, Busa E, Morris JC, Dale AM, Fischl B. Thinning of the cerebral cortex in aging. Cereb Cortex. 2004;14:721–730. doi: 10.1093/cercor/bhh032. [DOI] [PubMed] [Google Scholar]
- Savva GM, Wharton SB, Ince PG, Forster G, Matthews FE, Brayne C. Age, neuropathology, and dementia. N Engl J Med. 2009;360:2302–2309. doi: 10.1056/NEJMoa0806142. [DOI] [PubMed] [Google Scholar]
- Scholl M, Lockhart SN, Schonhaut DR, O'Neil JP, Janabi M, Ossenkoppele R, Baker SL, Vogel JW, Faria J, Schwimmer HD, Rabinovici GD, Jagust WJ. PET Imaging of Tau Deposition in the Aging Human Brain. Neuron. 2016;89:971–982. doi: 10.1016/j.neuron.2016.01.028. [DOI] [PMC free article] [PubMed] [Google Scholar]
- Schwarz AJ, Yu P, Miller BB, Shcherbinin S, Dickson J, Navitsky M, Joshi AD, Devous MD, Sr, Mintun MS. Regional profiles of the candidate tau PET ligand 18F-AV-1451 recapitulate key features of Braak histopathological stages. Brain. 2016a;139:1539–1550. doi: 10.1093/brain/aww023. [DOI] [PubMed] [Google Scholar]
- Schwarz CG, Gunter JL, Wiste HJ, Przybelski SA, Weigand SD, Ward CP, Senjem ML, Vemuri P, Murray ME, Dickson DW, Parisi JE, Kantarci K, Weiner MW, Petersen RC, Jack CRJ. A large scale comparison of cortical thickness and volume methods for measuring Alzheimer's disease severity. Neuroimage: Clinical. 2016b;11:802–812. doi: 10.1016/j.nicl.2016.05.017. [DOI] [PMC free article] [PubMed] [Google Scholar]
- Toledo JB, Weiner MW, Wolk DA, Da X, Chen K, Arnold SE, Jagust W, Jack C, Reiman EM, Davatzikos C, Shaw LM, Trojanowski JQ. Neuronal injury biomarkers and prognosis in ADNI subjects with normal cognition. Acta Neuropathol Commun. 2014;2:26. doi: 10.1186/2051-5960-2-26. [DOI] [PMC free article] [PubMed] [Google Scholar]
- Tzourio-Mazoyer N, Landeau B, Papathanassiou D, Crivello F, Etard O, Delcroix N, Mazoyer B, Joliot M. Automated anatomical labeling of activations in SPM using a macroscopic anatomical parcellation of the MNI MRI single-subject brain. Neuroimage. 2002;15:273–289. doi: 10.1006/nimg.2001.0978. [DOI] [PubMed] [Google Scholar]
- Vemuri P, Lesnick TG, Przybelski SA, Knopman DS, Lowe VJ, Graff-Radford J, Roberts RO, Mielke MM, Machulda MM, Petersen RC, Jack CR., Jr Age, vascular health, and Alzheimer disease biomarkers in an elderly sample. Ann Neurol. 2017a;82:706–718. doi: 10.1002/ana.25071. doi:710.1002/ana.25071. Epub 22017 Oct 25026. [DOI] [PMC free article] [PubMed] [Google Scholar]
- Vemuri P, Lowe VJ, Knopman DS, Senjem ML, Kemp BJ, Schwarz CG, Przybelski SA, Machulda MM, Petersen RC, Jack CR., Jr Tau-PET uptake: Regional variation in average SUVR and impact of amyloid deposition. Alzheimers Dement (Amst) 2017b;6:21–30. doi: 10.1016/j.dadm.2016.12.010. [DOI] [PMC free article] [PubMed] [Google Scholar]
- Vemuri P, Wiste HJ, Weigand SD, Shaw LM, Trojanowski JQ, Weiner MW, Knopman DS, Petersen RC, Jack CR., Jr MRI and CSF biomarkers in normal, MCI, and AD subjects: predicting future clinical change. Neurology. 2009;73:294–301. doi: 10.1212/WNL.0b013e3181af79fb. [DOI] [PMC free article] [PubMed] [Google Scholar]
- Villemagne VL, Burnham S, Bourgeat P, Brown B, Ellis KA, Salvado O, Szoeke C, Macaulay SL, Martins R, Maruff P, Ames D, Rowe CC, Masters CL. Amyloid beta deposition, neurodegeneration, and cognitive decline in sporadic Alzheimer's disease: a prospective cohort study. Lancet Neurol. 2013;12:357–367. doi: 10.1016/S1474-4422(13)70044-9. [DOI] [PubMed] [Google Scholar]
- Villemagne VL, Pike KE, Chetelat G, Ellis KA, Mulligan RS, Bourgeat P, Ackermann U, Jones G, Szoeke C, Salvado O, Martins R, O'Keefe G, Mathis CA, Klunk WE, Ames D, Masters CL, Rowe CC. Longitudinal assessment of Abeta and cognition in aging and Alzheimer disease. Ann Neurol. 2011;69:181–192. doi: 10.1002/ana.22248. [DOI] [PMC free article] [PubMed] [Google Scholar]
- Villeneuve S, Rabinovici GD, Cohn-Sheehy BI, Madison C, Ayakta N, Ghosh PM, La Joie R, Arthur-Bentil SK, Vogel JW, Marks SM, Lehmann M, Rosen HJ, Reed B, Olichney J, Boxer AL, Miller BL, Borys E, Jin LW, Huang EJ, Grinberg LT, DeCarli C, Seeley WW, Jagust W. Existing Pittsburgh Compound-B positron emission tomography thresholds are too high: statistical and pathological evaluation. Brain. 2015;138:2020–2033. doi: 10.1093/brain/awv112. [DOI] [PMC free article] [PubMed] [Google Scholar]
- Villeneuve S, Reed BR, Wirth M, Haase CM, Madison CM, Ayakta N, Mack W, Mungas D, Chui HC, DeCarli C, Weiner MW, Jagust WJ. Cortical thickness mediates the effect of beta-amyloid on episodic memory. Neurology. 2014;82:761–767. doi: 10.1212/WNL.0000000000000170. [DOI] [PMC free article] [PubMed] [Google Scholar]
- Wechsler D. Wechsler Adult Intelligence Scale-Revised. New York: The Psychological Corporation; 1981. [Google Scholar]
- Wechsler DA. Wechsler Memory Scale-Revised. New York: Psychological Corporation; 1987. [Google Scholar]
- Weston PS, Nicholas JM, Lehmann M, Ryan NS, Liang Y, Macpherson K, Modat M, Rossor MN, Schott JM, Ourselin S, Fox NC. Presymptomatic cortical thinning in familial Alzheimer disease: A longitudinal MRI study. Neurology. 2016;87:2050–2057. doi: 10.1212/WNL.0000000000003322. [DOI] [PMC free article] [PubMed] [Google Scholar]
- Whitwell JL, Tosakulwong N, Weigand SD, Senjem ML, Lowe VJ, Gunter JL, Boeve BF, Knopman DS, Dickerson BC, Petersen RC, Jack CR., Jr Does amyloid deposition produce a specific atrophic signature in cognitively normal subjects? Neuroimage Clin. 2013;2:249–257. doi: 10.1016/j.nicl.2013.01.006. [DOI] [PMC free article] [PubMed] [Google Scholar]
- Wirth M, Madison CM, Rabinovici GD, Oh H, Landau SM, Jagust WJ. Alzheimer's disease neurodegenerative biomarkers are associated with decreased cognitive function but not beta-amyloid in cognitively normal older individuals. J Neurosci. 2013a;33:5553–5563. doi: 10.1523/JNEUROSCI.4409-12.2013. [DOI] [PMC free article] [PubMed] [Google Scholar]
- Wirth M, Oh H, Mormino EC, Markley C, Landau SM, Jagust WJ. The effect of amyloid beta on cognitive decline is modulated by neural integrity in cognitively normal elderly. Alzheimers Dement. 2013b;9:687–698. doi: 10.1016/j.jalz.2012.10.012. [DOI] [PMC free article] [PubMed] [Google Scholar]
- Xia C, Makaretz SJ, Caso C, McGinnis S, Gomperts SN, Sepulcre J, Gomez-Isla T, Hyman BT, Schultz A, Vasdev N, Johnson KA, Dickerson BC. Association of In Vivo [18F]AV-1451 Tau PET Imaging Results With Cortical Atrophy and Symptoms in Typical and Atypical Alzheimer Disease. JAMA Neurol. 2017;74:427–436. doi: 10.1001/jamaneurol.2016.5755. [DOI] [PMC free article] [PubMed] [Google Scholar]
Associated Data
This section collects any data citations, data availability statements, or supplementary materials included in this article.