

Abstract
The discovery of bioactive compounds from natural sources entails an extremely lengthy process due to the timescale and complexity of traditional methodologies. In our study, we used a rapid NMR based metabolomic approach as tool to identify secondary metabolites with anti-proliferative activity against a panel of human colorectal cancer cell lines with different mutation profiles. For this purpose, fourteen Fabaceae species of Mediterranean vegetation were investigated using a double screening method: 1H NMR profiling enabled the identification of the main compounds present in the mixtures, whilst parallel biological assays allowed the selection of two plant extracts based on their strong anti-proliferative properties. Using high-resolution 2D NMR spectroscopy, putative active constituents were identified in the mixture and isolated by performing a bio-guided fractionation of the selected plant extracts. As a result, we found two active principles: a cycloartane glycoside and protodioscin derivative. Interestingly, these metabolites displayed a preferential anti-proliferative effect on colon cancer cell lines with an intrinsic resistance to anti-EGFR therapies. Our work provides an NMR-based metabolomic approach as a powerful and efficient tool to discover natural products with anticancer activities circumventing time-consuming procedures.
Introduction
The development of plant-derived substances has established the basis of sophisticated traditional medicine and, nowadays, plants still continue to be an essential source of pharmaceutical agents1,2. In particular, natural products have been the pillar of cancer chemotherapy for several years. Even though combinatorial chemistry provides a wide range of new and synthetic drugs, natural products are likely to provide lead compounds for the development of novel agents with enhanced biological properties3,4.
This success in drug discovery is linked to the high chemical diversity of natural sources; nevertheless, the chemical variability and the vast number of metabolites, which occur in the plant kingdom, make the detection and characterisation processes challenging to perform5. Traditional methodologies to discover new active molecules have different drawbacks, such as their complexity and inherent lengthy timescales, given that this research requires different separation and isolation steps before an active compound will emerge from the crude extract. Recently, the screening of plant-derived mixtures has become an effective way for rapid selection of metabolites with biological properties6,7.
In this scenario, metabolomics can provide a pertinent and convenient strategy, by allowing the direct study of the crude extract, simultaneously observing a wide range of metabolites belonging to different chemical classes, without the need of time-consuming isolation procedures8. The rapid sample preparation, shorter NMR measurement times, advanced data analysis methods and the use of advanced two-dimensional (2D) techniques to determine the structures of known or unknown compounds, make the NMR-based metabolomic approach extremely powerful for the profiling of crude extracts and the rapid identification of natural products9. Furthermore, relating putative biological activities with metabolomics is feasible by integrating chemometric methods with bioactivity results10,11. In this work, we combined an NMR-based metabolomic approach with MTT (3-[4,5-dimethylthiazol-2-yl]−2,5-diphenyltetrazolium bromide) tetrazolium salt colorimetric assays to select plant species belonging to Fabaceae family with anti-proliferative properties against a panel of genetically different colon cancer cell lines.
Colorectal cancer is one of the most frequently diagnosed malignant diseases in Europe and one of the leading causes of cancer-related death worldwide12. Although the outcome of patients with metastatic colorectal cancer (mCRC) has improved during the last years, current therapies available are not sufficiently effective13 and their efficacy is limited by the side effects of the drugs and/or the development of resistance14,15. For these reasons, there is a resurgence of interest for natural products, such as medicinal plants and dietary means as an alternative solution to cure mCRC patients. In the plant kingdom, the Fabaceae family represents a heritage of high biodiversity for their richness in secondary metabolites16, particularly significant for human health, either as dietary supplements or as pharmacological agents17. Furthermore, many studies reveal an interesting correlation between Fabaceae activities and colon cancer prevention and therapy, identifying this family as a promising source of new effective molecules against colon cancer. Soy (Glycine max) contains many bioactive compounds, including isoflavones. Epidemiological studies have shown that a high-level intake of soy-derived products contributes to a lower incidence of colorectal cancer in Asian countries. Among various soy isoflavones, genistein (4,5,7-trihydroxyisoflavone) (GEN) has been evaluated as a good candidate in colon cancer prevention18. The formononetin, constitutive isoflavones from barrel medic (Medicago truncula), exerts strong antiangiogenic effects reducing colon cancer proliferation both in vitro and in vivo experiments19. A naturally occurring rotenoid deguelin, isolated from Mondulea sericea, an African legume species, significantly inhibited IL-8 gene expression, induces apoptosis in colon cancer cells by down regulating the NF-kB signalling20. Isoliquiritigenin, a chalcone from roots of liquorice roots (Glycyrrhiza glabra) could be a promising adjuvant in colon cancer treatment, reducing tumour growth and protecting kidney and liver against chemotherapy-induced toxicity in a mouse xenograft model of colon carcinoma21. The triterpenoid B-group soyasaponins have been found to induce macroautophagy in human colon cancer cells22.
Thus, in the present work we applied a new screening method to seek secondary metabolites from fourteen Mediterranean Fabaceae species, which could be promising lead-structures to develop novel agents in CRC chemotherapy.
Results
Metabolic profiling of the selected Fabaceae species
The selected plants (Astragalus boeticus L., Lathyrus cicera L., Lathyrus clymenum L., Medicago minima (L.) L., Melilotus neapolitanus Ten., Ononis variegata L., Pisum sativum L. subsp. biflorum (Raf.) Soldano, Trifolium campestre Schreb., Trifolium cherleri L., Trifolium scabrum L. subsp. scabrum, Trigonella esculenta Willd., Vicia bithynica (L.) L., Vicia pseudocracca Bertol., Vicia angustifolia L.) were analysed for their metabolic phenotype by multinuclear NMR spectroscopy. 1H NMR profiling of these plant extracts allowed the identification of the main compounds present in the mixture. The metabolite assignment was done by comparing peak chemical shifts to those found in literature23 and in Human Metabolome Database (HMDB), and furthermore, all the metabolite structures were confirmed by 2D NMR experiments. The peculiar NMR values of 31 identified metabolites were reported in Table S1. This analysis revealed that all the studied species had a similar composition in primary metabolites (amino acids, organic acids and sugars) but a high variability was seen in terms of secondary metabolites, the majority of which were phenols. A group of compounds well represented in all the analysed species are flavonoids, characterised by distinctive doublets in the aromatic region of the proton spectra. Among these, quercetin, kaempferol and their derivatives were the most common compounds. Other flavonoids, on the contrary, were only present in selected species: a C6-glycosylated apigenin derivative and catechins were found in T. campestre and L. clymenum, respectively; meanwhile, in the M. minima.1H-spectrum different doublets in the region between 6.30 and 7.50 ppm supported the presence of isoflavone compounds such as daidzein, daidzin and genistein.
Cinnamic acid derivatives and caffeic acid were also widespread in all the studied plants. Chlorogenic acids were found in V. bithynica, V. angustifolia, while coumarin and their glucoside precursors such as cis/trans-melilotoside and dihydromelilotoside were detected in M. neapolitanus24. At lower fields, the singlet at δH 9.15 and the triplet at δH 8.86 indicated the presence of trigonelline, a methylbetaine derivative of nicotinic acid. In the opposite region of spectra, signals of terpene metabolites were detected in A. boeticus. In detail, two doublets at δH 0.37 (J = 4.6 Hz) and δH 0.57 (J = 4.6 Hz) revealed the presence of cycloartane compounds in this plant extract.
Cytotoxic activity of plant extracts
The potential anti-proliferative activity of the plant extracts studied here was evaluated against three human colorectal cancer cell lines (Caco-2, HT-29 and HCT-116), which were selected for their diverse mutation profiles and their resulting different medical aspects. In particular, Caco-2 cell line has no genetic alterations in KRAS, NRAS, BRAF and PIK3CA genes, which were known to be associated with intrinsic resistance to anti-EGFR therapies, such as cetuximab and panitumumab. On the contrary, HT-29 and HCT-116 cells displayed a different genetic profile, harbouring BRAF V600E and KRAS/PIK3CA, respectively.
Cancer cells were treated with increasing doses of plant extracts ranging between 10 to 250 µg/ml for 48 hours and their potential cytotoxicity was assessed trough MTT assays. The resulting data expressed as percentage values of the cell growth respect to the control were used to develop multivariate statistical analyses, in particular the agglomerative hierarchical clustering (HCA) and the principal component analysis (PCA), which can provide an overview of the results as well as a categorisation of the experimental dataset. Indeed, the HCA dendrogram clearly pointed out three different clusters with a high dissimilarity degree (150%). The first group included all treatments with A. boeticus and T. esculenta plant extracts, the second was formed by T. scabrum, V. bithynica and T. campestre, while the third cluster encompassed all of the remaining plants (Fig. 1A). This trend was further confirmed by PCA (Fig. 1B), where in the score scatter plot the three plant groups were mainly arranged along a gradient generated by the first component, which accounted for 72.84% of the variance. This, therefore, indicated an extreme diverse anti-proliferative activity amongst the investigated plant extracts pointing out that the maximum effect on the cell growth was caused by the above-mentioned first group. In particular, T. esculenta showed a similar strong anti-proliferative effect on the Caco-2, HT-29 and HCT-116 cell lines, whilst A. boeticus displayed a mild activity on Caco-2 and HCT-116 cell lines but a selective and notable anti-proliferative effect on HT-29 cell line. These findings suggested that A. boeticus extract could operate with a selective mode of action on the HT-29 colon cancer cells.
Figure 1.
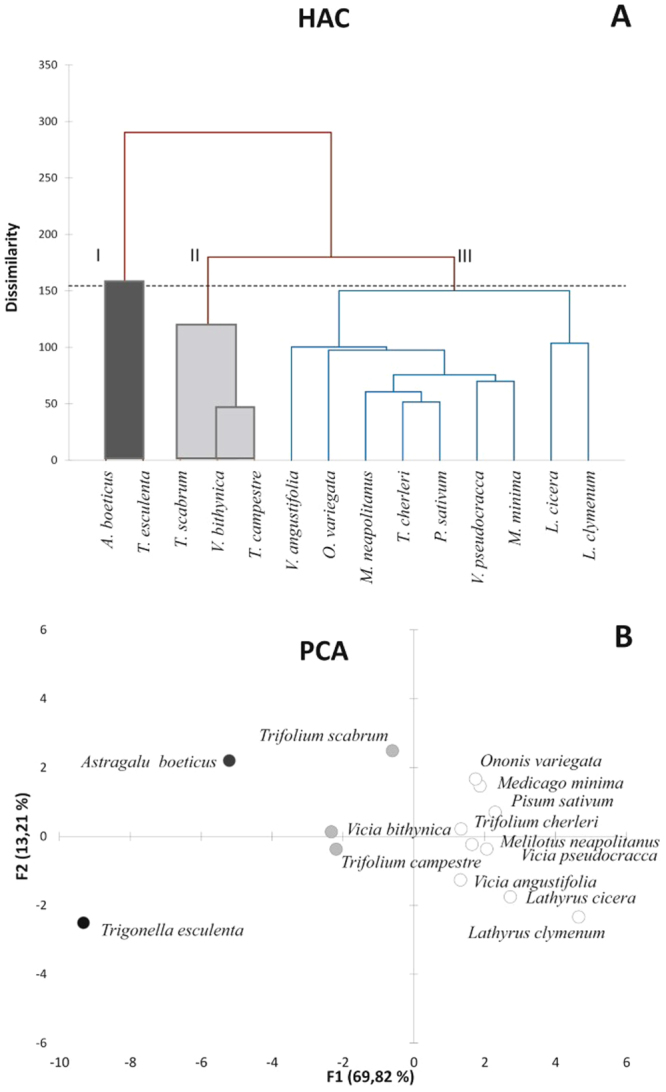
HCA dendrogram (A) and PCA (B) of cell growth percentage from control of colon cancer cell lines treated with the selected plant extracts over 48 hours. Based on these analyses the species are classified in three subsets. Groups I included the active species (black), II those active only at the highest tested doses (grey) and III those that have no-significant effect (white).
The second group identified in the PCA included plants that showed a severe anti-proliferative effect only at the highest tested concentrations (200 and 250 μg/ml). The rest of the screened plants (the third group) did not exhibit cytotoxic activity under the experimental conditions used and in some cases (Latirus spp vs. HT-29 cell lines) they exerted a stimulating effect on the cell growth. Based on these results, an extensive 2D NMR analysis was performed on the active plant extracts (A. boeticus and T. esculenta), with the aim of identifying the compounds in the mixtures that were responsible for the observed cytotoxicity (Fig. 2).
Figure 2.

Cytotoxicity of the studied Fabaceae species on Caco-2, HT-29 and HCT-116 colorectal cancer cell lines evaluated by MTT assays over 48 hours. Cell growth is expressed as percentage from control and it is plotted in the vertical scale, while doses of plant extracts are depicted in the horizontal axis. Groups I, II and III are depicted in black; grey and white, respectively.
2D NMR analysis of the active plant extracts
Astragalus boeticus
The NMR analysis of A. boeticus extract showed the presence of three main secondary metabolites. The first two molecules were identified as quercetin and kaempferol (Table S1), two flavonols widely distributed in the plant kingdom, while the third metabolite was a cycloartane triterpene. Beyond the methylene H-19 protons at δH 0.37 and 0.57, seven methyl singlets were clearly detectable in the 1H NMR spectrum (Fig. 3A). In detail, signals at δH 1.01 (δC 15.5) and 1.06 (δC 25.7) were assigned to the H-28 and H-29 methyls, based on HMBC heterocorrelations (Fig. 4A) with C-5 methine (δC 49.5), carbon that was found to bind the proton at δH 1.66. This proton (H-5) correlated with the H-19 methylene and H-6 proton in the COSY experiment; this resonated at δH 4.75 suggesting the presence of an oxygen atom binding the C-6 carbon. Furthermore, both C-28 and C-29 carbons correlated with the H-5 methine and H-3 proton at δH 4.44 (δC 88.4). Besides, the H-19 protons displayed heterocorrelations with the C-8 methine carbon (δC 45.0), which in turn correlates with the H-30 methyl that resonated at δH 0.99 (δC 19.2). Furthermore, the signal at δH 1.24 (δC 20.3), attributed to the 18 methyl, and the peak at δH 1.26 (δC 27.2), related to the H-21 methyl, correlated with the C-17 carbon at δC 57.7. In the COSY spectrum, the proton bound to this carbon revealed homocorrelations with the H-16 proton at δH 4.64; this chemical shift value was well in agreement with the presence of an hydroxyl group in this position. A series of HMBC correlations, which were found between the H-21 proton and the C-20 carbon (δC 87.6); the H-26 methyl (δH 1.24) and the C-25 carbinol (δC 72.0); the H-27 methyl (δH 1.34) and the C-24 carbinol (δC 81.2) allowed us to hypothesise the presence of a substituted tetrahydrofuran moiety in the side chain of the triterpene. All these data were in agreement with the presence of a cycloastragenol25,26. The downfield shift of the H-3 and C-3 values justified the presence of a sugar moiety, indicating a presumable site of glycosylation at position 3. This hypothesis was validated with an HMBC experiment, in which the C-3 carbon clearly heterocorrelated with the anomeric proton at δH 4.44 (δC 107.0). Finally, the H-6 proton showed cross peak with a carbonyl at δC 172.5, which in turn correlated with the methyl at δH 2.04 (δC 21.2). These data demonstrated the presence of an acetyl group, which formed an ester bond with the hydroxyl group located at C-6 carbon.
Figure 3.
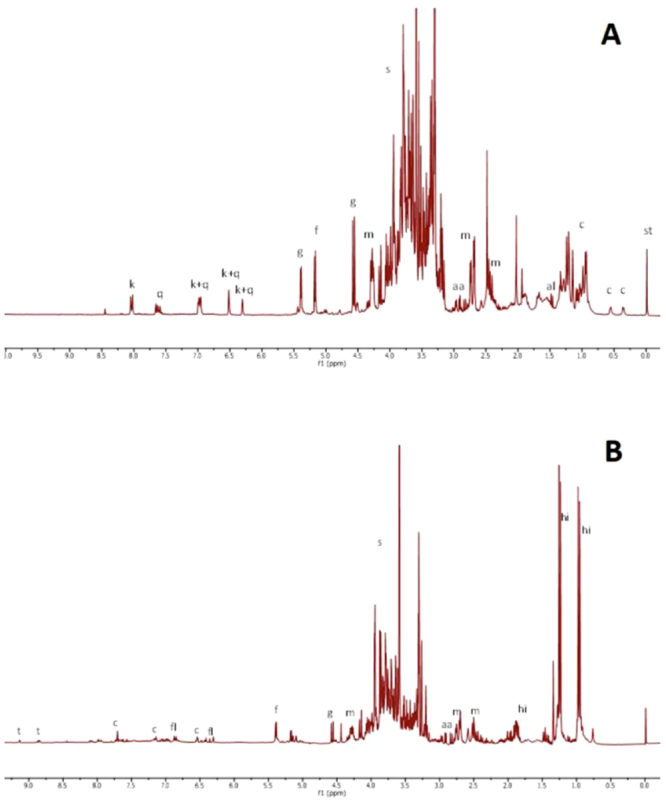
(A) 1H NMR of Astragalus boeticus extract registered in phosphate buffer in D2O (pH 6.0) and methanol d4 (1:1). (B). 1H NMR of Trigonella esculenta registered in phosphate buffer in D2O (pH 6.0) and methanol d4 (1:1). ABBREVIATIONS: aa, aspartic acid; al, alanine; c, cycloartane; fl, flavonoids; f, fructose; g, glucose; h, 4- hydroxyisoleucine; k, kaempferol; malic acid; q, quercetin; st, standard; s, sugar; t, trigonelline.
Figure 4.
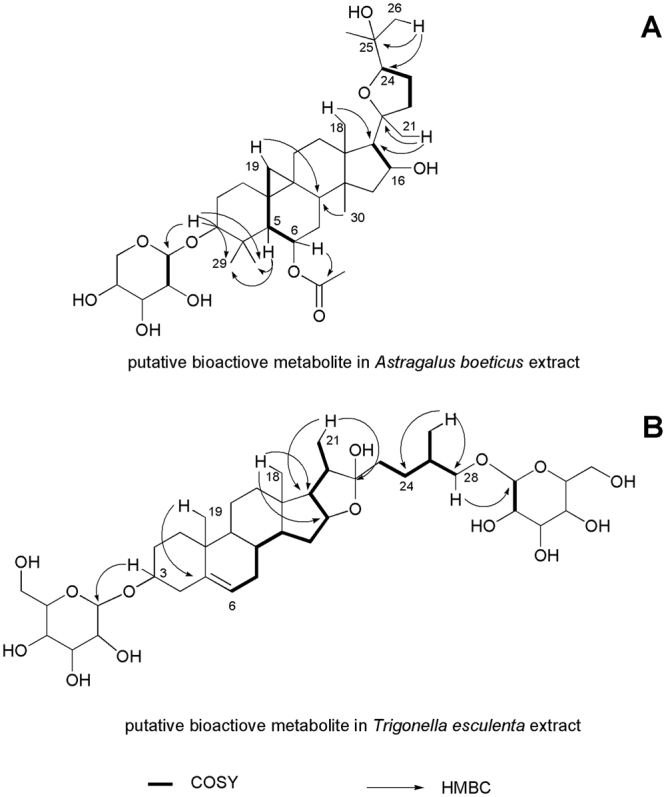
Main COSY and HMBC correlations of the putative bioactive metabolites in Astragalus boeticus and Trigonella esculenta extracts.
Trigonella esculenta
T. esculenta metabolome presented little variability in terms of secondary metabolites; indeed, the 1H spectrum was dominated by of 4-hydroxyisoleucine signals (Fig. 3B). In an attempt to see beyond these primary metabolites, the crude extract was purified on a Sep-pak C-18 cartridge and the resulting methanol eluate was analysed by NMR. In the up-field region of the spectrum, peculiar doublets and singlets between 4.2 and 5.2 ppm suggested the presence of triterpenoid saponins. In particular, two singlets at δH 0.83 and 1.04, alongside two doublets at δH 0.94 and 1.01 suggested the presence of a steroid moiety27. In the HMBC experiment (Fig. 4B), the doublet at δH 0.94 (δC 17.6) correlated either with the methine C-24 at δC 35.2 or a methylene carbinol C-28 at δC 75.9 (δH 3.70 and 3.40). This signal showed cross peaks with the doublet at δH 4.73 (δC 104.8), indicating a glycosylation site at position 28. Moreover, the doublet at δH 1.01 (δC 15.7) heterocorrelated with two methines at δC 40.8 and 64.6, and with the acetal carbon at δC 113.9. These data are consistent with the presence of a furostanol moiety in the molecule. A second site of glycosylation was identified at position 3; indeed, the carbinol carbon at δC 79.2 correlated with the anomeric proton at δH 4.40. Moreover, overlapped doublets between 1.20 and 1.30 ppm correlated in the HSQC experiment with carbons at δC 18.4, 18.1 and 17.9. Finally, the correlations of these protons with carbinol carbons supported the presence of three deoxy sugars.
Isolation and identification of the active metabolites from the cytotoxic plant extracts
Compound A from Astragalus boeticus
A. boeticus crude extract was partitioned between ethyl acetate and water; after purification through different chromatographic processes, the organic phase led to the isolation of the pure compound A28 (Fig. 5). It showed a molecular formula C37H60O10, according to the 13C NMR data and the positive ESI Q-TOF HRMS spectrum that displayed a sodiated adduct at m/z 687.4480. In the 1H NMR spectrum, characteristic signals of a cycloartane triterpene were detected: two methines at δH 0.61 and 0.40 (H-19) and seven singlet methyls at δH 1.27, 1.26, 1.22, 1.13, 1.09, 1.01, 0.99. The presence of a doublet at δH 4.26, as well as other protons resonating between 3.18 and 3.46 ppm, suggested the presence of sugar in the molecule. The 2D NMR experiments (COSY, TOCSY, NOESY, HSQC, CIGAR-HMBC, H2BC and HSQCTOCSY) were in agreement with the presence of a cycloatragenol as aglycone. In particular, in the CIGAR-HMBC experiment the H-6 proton at δH 4.75 showed a cross peak with the ester carbonyl at δC 171.7, which in turn correlated with the methyl at δC 1.99. These data suggested the presence of an acetate group at position 6. Moreover, a glycosylation site at position 3 was supported by the correlation between H-3 methine at δH 3.21 and the anomeric carbon at δC 107.4. The TOCSY, HSQCTOCSY and H2BC NMR experiments allowed the identification of the saccharide moiety as xylose, while the coupling constant value of the anomeric proton (6.0 Hz) agreed with a β configuration. Finally, the stereochemistry of compound A was defined using a NOESY experiment. Taken all together, these data enabled the identification of compound A as 6-O-acetyl-3-O-β-D xylopiranosylcycloastragenol. This was confirmed by tandem MS analysis of the pseudomolecular ion [M + Na]+ that showed the presence of the fragment ion at m/z 537.3399 and 627.3801, due to the loss of the xylose and the acetate, respectively.
Figure 5.
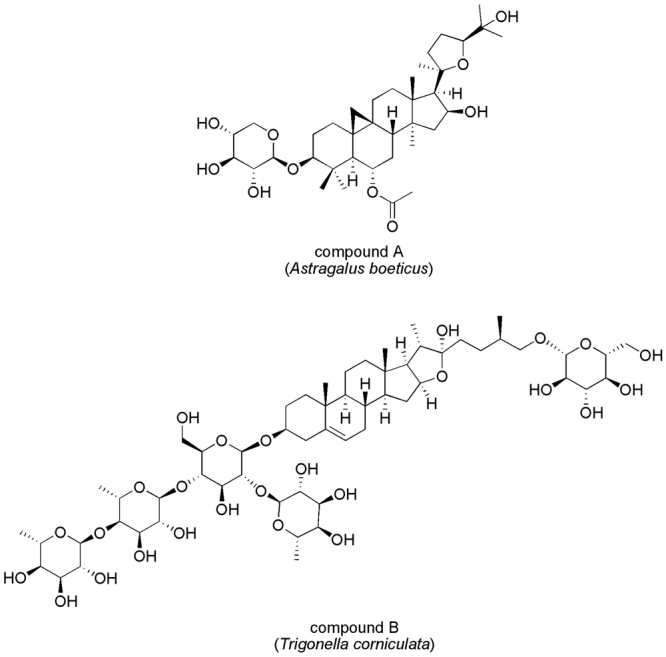
Bioactive constituents of Astragalus boeticus (compound A) and Trigonella esculenta (compound B) extracts.
Compound B from Trigonella esculenta
The crude extract of T. esculenta was chromatographed on Amberlite XAD-4 and eluted with water to eliminate polar metabolites. The saponin fraction, recovered by methanol, was fractionated through column chromatography and finally purified by RP-HPLC to obtain pure compound B29,30 (Fig. 5). It showed a molecular formula C57H94O26, according to the positive ESI Q-TOF HRMS analysis and 13C NMR data. The 1H NMR spectrum showed the signals of the steroidal aglycone as two singlet methyls at δH 0.84 and 1.05, and two doublets at δH 0.95 and 1.01.
In the 1H NMR spectrum, different anomeric protons suggested the presence of an oligosaccharide, which was located at C-3 carbon, thanks to the CIGAR-HMBC experiment. The HSQCTOCSY and H2BC experiment in combination with the Q-TOF HRMS analysis further confirmed this structure. Thus, compound B was unequivocally identified as [(25 R)-furost-5-ene-3β,22α,26-triol 3-O-α-L-rhamnopyranosyl-(1 → 4)-α-L-rhamnopyranosyl-(1 → 4)-[α-L-rhamnopyranosyl-(1 → 2)]-β-D-glucopyranosyl 26-O-β-D-glucopyranoside.
Anti-proliferative activity of pure compounds
In an attempt to understand whether the isolated compounds were actually responsible for the cytotoxicity of the crude extracts, their cytotoxicity was evaluated against a panel of colorectal cancer cell lines (Caco-2, HT-29, HCT-116). In these assays, a wide range of treatment concentrations was examined over 48 hours.
With regard to A. boeticus, after incubating the cells with compound A at concentrations below 50 µM, a reduction of approximately 50% of cell growth was observed (Table 1). This strong antiproliferative effect resembled closely what had been observed with the crude plant extract. Interestingly, this metabolite did not exert the same anti-proliferative effect on the three types of colon cancer cells tested, as its IC50 value was significantly lower for the HT-29 cells (IC50 = 3 µM). This may suggest a selective mode of action of compound A on this particular cell type.
Table 1.
IC50 values of compound A and B evaluated by MTT assays over 48 hours on Caco-2, HT-29, HCT-116 colorectal cancer cell lines.
| Active metabolites | Caco-2 | HT-29 | HCT-116 |
|---|---|---|---|
| Compound A | 50 µM | 3 µM | 40 µM |
| Compound B | 3 µM | 3 µM | 2 µM |
With regard to T. esculenta, compound B was able to recapitulate the cytotoxic activity of the crude plant extract (Table 1). After the incubation of Caco-2, HT-29 and HCT-116 cell lines, a strong anti-proliferative effect was detected and very low doses (<10 µM) reduced cell growth by approximately 50%, indicating that this metabolite was largely accountable for the anti-proliferative effect of the plant extract. Compound B displayed the same effect on Caco-2 and HT-29 (IC50 = 3 µM), while its activity was slightly higher in HCT-116 cell lines (IC50 = 2 µM).
To further validate that A and B were the active constituents of A. boeticus and T. esculenta, the other main secondary metabolites, which were previously identified in these plant derived-mixtures, were isolated and tested. In detail, we purified the flavonols quercitin and kaempferol from the first plant extract, and the amino acid 4-hydroxyisoleucine from the second. We subsequently evaluated their cytotoxicity on the selected human colon cancer cell lines, demonstrating that these have no significant effect under the examined conditions.
Discussion
Natural product research requires new strategies to renovate the traditional methodologies, which are too expensive and/or time consuming31,32. Metabolomics ameliorate the effectiveness of previous approaches restoring the relevance of natural products as source of novel potential anticancer agents33,34. Here, we integrate metabolomic strategies with biological assays to search secondary metabolites from Fabaceae species, which exert cytotoxicity against colon cancer cells.
We performed a detailed metabolomic analysis of fourteen Fabaceae species, unambiguously identifying 31 metabolites from these plants. With regard to the non-active species, there is a fragmented literature that described these from different points of view24,35–38. Nonetheless, the current research unveiled a more comprehensive picture of the studied species, showing their metabolomic profiles and pointing out the main secondary metabolites present in the mixture. Because of their strong cytotoxic effect on Caco-2, HT-29 and HCT-116 human colorectal cancer cell lines, A. boeticus and T. esculenta extracts were selected for further investigations. To our knowledge, there is a little available data about these selected plant extracts; however, previous published work on other species belonging to the same genus assisted us in the search and identification of the putative active constituents of our selected plants.
In Traditional Chinese Medicine (TCM) Astragalus genus is particularly widespread for its antiperspirant, diuretic, and tonic properties. In particular A. membranaceus, is very well-known in folk medicine for its anti-inflammatory and immunomodulatory effects mainly exerted by regulating the (NF)-κB signalling pathways39–41. Furthermore, recent studies have proven that cycloartane and oleanan-type saponins modulate the cytokine release and might contribute either to the anti-inflammatory or anti-proliferative effect of Astragalus spp.42. It has been also demonstrated that Astragalus saponins from A. membranaceus regulate cell invasiveness and angiogenesis in human gastric adenocarcinoma cells43.
Trigonella esculenta has been already investigated for its ethyl-galactoside44 and diosgenin contents45, yet no previous studies evaluated the anti-proliferative activity of this species. The majority of literature data refers to Trigonella foenum-graecum L. (Fenugreek), a medicinal and dietary plant to which were attributed a very wide range of biological properties46, especially those regarding to the hypocholesterolaemic and hypoglycaemic effect47,48. Notably, other previous works reported the potentiality of T. foenum-graecum as source of potential anti-cancer agents: in detail, anti-proliferative metabolites have been identified to be steroidal furostan-type saponins, such as diosgenin and protodioscin49,50.
In this work, we sought to identify the compounds responsible for plant extract cytotoxicity against colorectal cancer cells, and to this aim an extensive 2D NMR analysis of the active crude extracts was carried out followed by a bio-guided fractionation to isolate these metabolites. Consistently with the previous investigations, we found a cycloartane glycoside (compound A) and a protodioscin derivative (compound B) as active principles from A. boeticus and T. esculenta, respectively (Fig. 5).
A previous work described compound A and its capacity to inhibit nitric oxide production, identifying this metabolite as a potential anti-inflammatory agent27. Nevertheless, here the proliferation reducing activity of compound A was demonstrated for the first time. Supporting our findings, antineoplastic properties have already been associated with other cycloartane glycosides. Of these, astragaloside I – II – III isolated from A. membranaceus have been tested against a panel of different human cancer cells, which represent diverse common malignancies. The strongest anti-proliferative and apoptotic effect was observed in the leukemic (HL-60, HL-60/Dox and SKW-3) and in breast cancer (MDA-MB-231) cell lines, while the colorectal carcinoma НТ-29 was found to be the least responsive to the saponin treatment51. This latter finding is not in full agreement with our results, where compound A was found to be most active in HT-29 cells (IC50 = 3 µM) compared with the other studied colon cancer cell lines, Caco-2 (IC50 = 50 µM) and HCT-116 (IC50 = 40 µM). Another study described astragaloside II as a novel promising agent for reversal of multidrug resistance (MDR) mediated by P-glycoprotein in human hepatic cancer cells52.
Our work established for the first time the presence of compound B in Trigonella spp., albeit this metabolite has already been isolated from other genus. Previous evidence proved that fractions deriving from Livistona chinensis var subglobosa seeds containing compound B promote apoptosis in different human cancer cells and, thus, it could be used to both prevent and treat cancer (US 2010/0179098 A1). Another invention patent included this molecule in a pharmacological composition together with a histone deacetylase inhibitor, the combination of these compounds causes an increase of the apoptotic rate (US 2012/0058961 A1). Here, we found that compound B has a potent anti-proliferative effect towards the investigated panel of colon cancer cell lines, with a slight preferentiality for HCT-116.
Interestingly, compound A and B displayed an enhanced effect on HT-29 and HCT-116 cells, respectively. These cell lines are characterised by genetic defects in BRAF and KRAS/PIK3CA, respectively. KRAS mutation, or genetic variation in other intracellular downstream effectors of EGFR activation, such as BRAF, NRAS, and PIK3CA, are responsible for the intrinsic resistance to anti-EGFR therapies53,54. Moreover, the remarkable selectivity of compound A for HT-29 may has a potent clinical impact; since BRAF mutated mCRC patients have a very negative prognosis. In fact, for this pathology at present there is neither a standard chemotherapeutic treatment nor targeted therapies available. Although inhibition of BRAF oncoprotein by the small-molecule drug PLX4032 (vemurafenib) is highly effective in the treatment of melanoma, colon cancer patients associated with the same BRAF mutation have poor prognosis showing only a very limited response to this drug. As Vemurafenib treatment induces EGFR feedback activation, this may explain the refractoriness of BRAF (V600E) mutated colon cancers to this therapy55.
In conclusion, using an innovative and highly efficient screening approach we quickly identified two natural products (A and B) as potent cytotoxic molecules against human colorectal cancer cells, which exert resistance against anti-EGFR therapies. These findings encouraged further investigations to understand the mode of action of compounds A and B and their potential application in drug resistant colon cancer therapy. Obviously, different limitations are intrinsically associated to our in vitro experimental system; and for this reason, future experiments will be also addressed to evaluate the pharmacokinetic properties and the bioavailability of the active metabolites in animal models.
Materials and Methods
Plant material
Plant species were harvested in April 2014 at the “Castel Volturno” Nature Reserve (40°57.587′N, 14°00.105′E; southern Italy), identified and the voucher specimens were deposited at the Herbarium of DiSTABiF of Università degli Studi della Campania “Luigi Vanvitelli, as reported below: A. boeticus L, Lathyrus cicera L., Lathyrus clymenum L., Medicago minima (L.) L., Melilotus neapolitanus Ten., Ononis variegata L., Pisum sativum L. subsp. biflorum (Raf.) Soldano, Trifolium campestre Schreb., Trifolium cherleri L., Trifolium scabrum L. subsp. scabrum, Trigonella esculenta Willd., Vicia bhytinica (L.) L., Vicia pseudocracca Bertol., Vicia angustifolia L.. Leaf samples were collected and immediately frozen in liquid N2 to avoid unwanted enzymatic reactions and stored at −80 °C before the freeze-drying process. Lyophilized samples were powdered in liquid nitrogen and stored at −20 °C.
Extraction procedure for metabolomic analysis
An aliquot (50 mg) of freeze-dried and powdered plant material was transferred to a 2 mL microtube. 1.5 mL of phosphate buffer (Fluka Chemika, Buchs, Switzerland; 90 mM; pH 6.0) in D2O (Cambridge Isotope Laboratories, Andover, MA,USA) - containing 0.1% w/w trimethylsilylpropionic-2,2,3,3-d4 acid sodium salt (TMSP, Sigma–Aldrich, St. Louis, MO, USA)- and CD3OD (Sigma–Aldrich, St. Louis, MO, USA) (1:1) were added to the samples. The mixture was vortexed at room temperature for 1 min, ultrasonicated (Elma Transsonic Digital, Hohentwiel, Germanys) for 40 min, and centrifuged (Beckman Allegra™ 64 R, F2402H rotor; Beckman Coulter, Fullerton,CA, USA) at 13,000 rpm for 10 min. A volume of 0.65 mL was transferred to a 5-mm NMR tube and analyzed by NMR56.
NMR experiments
NMR spectra were recorded at 25 °C on a 300.03 MHz for 1H and 75.45 MHz for 13C on a Varian Mercury Plus 300 Fourier transform NMR. CD3OD was used as the internal lock. Each 1H NMR spectrum consisted of 256 scans with the following parameters: 0.16 Hz/point, acquisition time (AQ) = 1.0 s, relaxation delay (RD) = 1.5 s, 90° pulse width (PW) = 13.8 μs. A presaturation sequence was used to suppress the residual H2O signal. FIDs were Fourier transformed with LB = 0.3 Hz. The spectra were manually phased and baseline-corrected and calibrated to TMSP at 0.0 ppm.
High-resolution experiments were performed, in particular 2D-NMR spectra were used for extracts A. boeticus and T. esculenta extracts to identify the putative cytotoxic metabolites. Standard pulse sequences and phase cycling from Varian library were used for 1H, DQF-COSY, COSY, TOCSY, HSQC, H2BC, HSQCTOCSY, HMBC and CIGAR-HMBC experiments. COSY spectra were acquired with a 1.0 s relaxation delay and 2514 Hz spectral width in both dimensions. The window function for COSY spectra was sine-bell (SSB = 0). Proton-detected heteronuclear correlations were measured. Heteronuclear single-quantum coherence (HSQC) experiments (optimized for 1J(H,C) = 140 Hz) were performed in the phase sensitive mode with field gradient. The spectral width was 12000 Hz in f1 (13C) and 3000 Hz in f2 (1H) and 1.0 s of relaxation delay; the matrix of 1 k × 1 k data points was zero-filled to give a final matrix of 2 k × 2 k points. Heteronuclear 2 bond correlation (H2BC) spectra were obtained with T = 30.0 ms, and a relaxation delay of 1.0 s; the third-order low-pass filter was set for 130 < 1J(C,H) < 165 Hz. Heteronuclear multiple bond coherence (HMBC) experiment (optimized for nJ(H,C) = 8 Hz) was performed in the absolute value mode with field gradient. Typically, 1H–13C gHMBC were acquired with spectral width of 18116 Hz in f1 (13C) and 3140 Hz in f2 (1H) and 1.0 s of relaxation delay; the matrix of 1 k × 1 k data points was zero-filled to give a final matrix of 4 k × 4 k points; Qsine (SSB = 2.0). Constant time inverse-detection gradient accordion rescaled heteronuclear multiple bond correlation spectroscopy (CIGAR–HMBC) spectra (8 > nJ(H,C) > 5) were acquired with the same spectral width used for HMBC. Heteronuclear single-quantum coherence - total correlation spectroscopy (HSQC-TOCSY) experiments were optimized for nJ(H,C) = 8 Hz, with a mixing time of 90 ms. Free induction decays (FIDs) were Fourier transformed and the resulting spectra were manually phased and baseline-corrected and calibrated to TMSP at 0.0 ppm, using 1H NMR processor (ACDLABS 12.0, Toronto, Canada). For accurate mass measurements the purified compounds were analyzed by electrospray hybrid quadrupole orthogonal acceleration time-of-flight mass spectrometer (Q-TOF) fitted with a Z-spray electrospray ion source (Waters S.p.A.). All analyses were performed in both positive and negative ion mode. The capillary source voltage and the cone voltage were set at 3500 V and 35 V, respectively. The source temperature was kept at 80 °C and nitrogen was used as a drying gas (flow rate about 50 L/h). The time-of-flight analyzer of the mass spectrometer was externally calibrated with GFP from m/z 50 to 1600. Accurate mass data were collected by directly infusing samples (1.5 pmol/μL in CH3CN/H2O, 1:1) into the system at a flow rate of 15 μL/min. The acquisition and processing of data were performed with the MassLynx 4.1 software (Waters S.p.A., Manchester, UK).
Isolation of active metabolites
Extraction, isolation and identification of compound A from Astragalus boeticus
Dried leaves (24.0 g) of A. boeticus were powdered and underwent to three cycles of an ultrasound assisted extraction with a MeOH/H2O (1:1) solution (720 mL), obtaining a crude extract (7.1 g). This was dissolved in H2O and separated by liquid–liquid extraction using EtOAc as an extracting solvent. The EtOAc fraction (1 g) was chromatographed by SiO2 CC eluting with a solution with an increasing degree of polarity (CHCl3, Me2CO/ CHCl3, MeOH/ CHCl3). 21 fractions have been collected, number 12 was fractionated by Flash-CC eluting with MeOH/ CHCl3 (3:100) to obtain compound A (28 mg). Compound A (6-O-acetyl-3-O-β-d xylopiranosylcycloastragenol). [α]D25 = + 7,65 (c = 5,1 × 10⁻³, MeOH/H2O, 2:1).13C-NMR (CD3OD): see Table S1; 1H-NMR (CD3OD):see Table S1. Q-TOF HRMS (ESI+): m/z 703.3877 [M + K]+ (calcd. 703.3818 for C37H60O10K+), 687.4080 [M + Na]+ (calcd. 687.4079 for C37H60O10Na+), 627.3801 [M-AcOH + Na]+ (calcd. 627.3873 for C35H56O8Na+), 537.3399 [M-C5H10O5 + Na]+ (calcd. 537.3556 C32H50O5Na+), 477.3164 [M-AcOH-C5H10O5 + Na]+ (calcd. 477.3345 C30H46O3Na+).
Extraction, isolation and identification of compound B form Trigonella esculenta
Dried leaves (10.0 g) of T. esculenta Willd were powdered and underwent to three cycles of an ultrasound assisted extraction with a MeOH/H2O (1:1) solution (300 ml) obtaining a crude extract (5.0 g), which was dissolved in H2O and separated by liquid–liquid extraction using EtOAc as an extracting solvent. The aqueous fraction was chromatographed on Amberlite XAD-4 and XAD-7 with water and then with methanol. The alcoholic eluate from both XAD-4 and XAD-7 (1.2 g) was chromatographed by Sephadex LH-20 CC eluting with hydroalcoholic solution (MeOH/H2O) with an increasing percentage of methanol to collect 8 fractions (20 mL each). Fractions 2 and 3 have been purified by Flash CC eluting with the lower phase of CHCl3/MeOH/H2O (13:7:3) solution to give another fraction (74.0 mg), which in turn was chromatographed through HYDRO-RP 80 HPLC eluting with H2O/MeOH/MeCN (2:2:1) providing pure compound B (52.0). Compound B ([(25 R)-furost-5-ene-3β,22α,26-triol 3-O-α-L-rhamnopyranosyl-(1 → 4)-α-L-rhamnopyranosyl-(1 → 4)-[α-L-rhamnopyranosyl-(1 → 2)]-β-D-glucopyranosyl 26-O-β-D-glucopyranoside. [α]D25 = + 5,5 (c = 5,1 × 10⁻³, MeOH/H2O, 2:1).13C-NMR (CD3OD): S2; 1H-NMR (CD3OD): see Table S1;
Q-TOF HRMS (ESI+): m/z 1217.5895 [M + Na]+ (calcd. 1217.5926 for C57H94O26Na+), m/z 1177.6051 [M-OH]+ (calcd. 1177.6006 for C57H93O25+); TANDEM MS of 1177.6051: 1015.5361 [M-OH-Glc]+ (calcd. 1015.5478 for C51H83O20), 869.4803 [M-OH-Glc-Rha]+ (calcd. 869.4899 for C45H73O16), 723.4020 [M-OH-Glc-2Rha]+ (calcd. 723.4319 for C39H63O12), 577.3481 [M-OH-Glc-3Rha]+ (calcd. 577.3740 for C33H53O7), 415.3236 [M-OH-2Glc-3Rha]+ (calcd. 415.3212 for C27H43O3).
Cell Lines
The human HCT-116, HT-29, Caco-2 colorectal cancer cell lines were obtained from the American Type Culture Collection (ATCC) (Manassas, VA). HCT-116, HT-29 cancer cells were cultured in RPMI 1640 medium (Lonza, Cologne, Germany) supplemented with 10% fetal bovine serum, 2 mM L-glutamine, 50 U/ml penicillin and 100 µg/ml streptomycin (Lonza, Cologne, Germany). Caco-2 cell line was cultured in DMEM medium (Lonza, Cologne, Germany) supplemented with 10% fetal bovine serum, 2mM L-glutamine, 1% non-essential amino acid, 50 U/ml penicillin and 100 µg/ml streptomycin (Lonza, Cologne, Germany).
Proliferation Assay
Cell proliferation assay was measured with 3-(4,5-dimethylthiazol-2-yl)-2,5-diphenyltetrazolium bromide (MTT) assay. Briefly, cells in logarithmic growth phase were plated in 96-well plates and incubated for 24 hours before exposure to increasing doses of plant extracts (10, 50, 100, 150, 200 and 250 µg/ml), enriched in secondary metabolites by a Sep-pak C18 cartridge step. 48 hours after treatment, 50 µl of 1 mg/ml (MTT) were mixed with 200 μl of medium and added to the well. 1 hour after incubation at 37 °C, the medium was removed and the purple formazan crystals produced in the viable cells were solubilized in 100 μl of dimethyl sulfoxide and quantitated by measurement of absorbance at 570 nm with a plate reader. Results were reported as mean ± sd of % of cell growth respect to the control from six replicate analyses. The control was represented by 0.25% DMSO treatment corresponding to the higher amount of DMSO used for the tests.
Multivariate data analysis
The data matrix of cell growth percentage from control of the plant extracts treatments has been analyzed by multivariate analysis based on XLSTAT 2013 (Addinsoft, New York, NY, USA for Microsoft Office Excel 2010). Hierarchical cluster analysis (HCA), based on Euclidean distance as dissimilarity index and complete linkage as the agglomeration method, has been carried out to evaluate statistical differences between extracts. Furthermore, Principal component analysis (PCA) was also performed as ordination methods based on XLSTAT 2013.
Electronic supplementary material
Author Contributions
V.G. and M.S. designed the experiments, discussed and interpreted the results. A.E. selected and identified the plant species. V.G., M.S., V.B., and M.P. carried out experiments. A.C. and R.R. carried out the M.S. analyses. V.G. and M.S. wrote the manuscript. A.E., B.D.A., A.R., F.C. analysed the experimental data. A.E., B.D.A. interpreted the results. T.T., N.P., A.F. designed the experiments, discussed and interpreted the results and reviewed the manuscript. All authors revised the manuscript.
Competing Interests
The authors declare no competing interests.
Footnotes
Vittoria Graziani and Monica Scognamiglio contributed equally to this work.
Electronic supplementary material
Supplementary information accompanies this paper at 10.1038/s41598-018-23704-9.
Publisher's note: Springer Nature remains neutral with regard to jurisdictional claims in published maps and institutional affiliations.
Contributor Information
Teresa Troiani, Email: teresa.troiani@unicampania.it.
Nicoletta Potenza, Email: nicoletta.potenza@unicampania.it.
Antonio Fiorentino, Email: antonio.fiorentino@unicampania.it.
References
- 1.Newman DJ, Cragg GM. Natural products as sources of new drugs over the 30 years from 1981 to 2010. J Nat Prod. 2012;75(3):311–35. doi: 10.1021/np200906s. [DOI] [PMC free article] [PubMed] [Google Scholar]
- 2.Cragg, G. M, Newman, D. J. Natural products: a continuing source of novel drug leads. Biochim Biophys Acta.1830(6) 3670–95 (2013). [DOI] [PMC free article] [PubMed]
- 3.Mann, J. Natural products in cancer chemotherapy: past, present and future. Nat Rev Cancer. 2(2), 143–8 (2002). [DOI] [PubMed]
- 4.Paterson I, Anderson EA. Chemistry. The renaissance of natural products as drug candidates. Science. 2005;310(5747):451–3. doi: 10.1126/science.1116364. [DOI] [PubMed] [Google Scholar]
- 5.Wolfender J-L, Marti G, Ferreira Queiroz E. Advances in Techniques for Profiling Crude Extracts and for the Rapid Identificationof Natural Products: Dereplication, Quality Control and Metabolomics. Current Organic Chemistry. 2010;14(16):1808–32. doi: 10.2174/138527210792927645. [DOI] [Google Scholar]
- 6.Michel T, Halabalaki M, Skaltsounis AL. New concepts, experimental approaches, and dereplication strategies for the discovery of novel phytoestrogens from natural sources. Planta Med. 2013;79(7):514–32. doi: 10.1055/s-0032-1328300. [DOI] [PubMed] [Google Scholar]
- 7.Harvey AL. Natural products in drug discovery. Drug Discov Today. 2008;13(19–20):894–901. doi: 10.1016/j.drudis.2008.07.004. [DOI] [PubMed] [Google Scholar]
- 8.Verpoorte R, Choi YH, Kim HK. Ethnopharmacology and systems biology: a perfect holistic match. J Ethnopharmacol. 2005;100(1–2):53–6. doi: 10.1016/j.jep.2005.05.033. [DOI] [PubMed] [Google Scholar]
- 9.Nakabayashi R, Saito K. Metabolomics for unknown plant metabolites. Anal Bioanal Chem. 2013;405(15):5005–11. doi: 10.1007/s00216-013-6869-2. [DOI] [PubMed] [Google Scholar]
- 10.Lawaetz AJ, Schmidt B, Staerk D, Jaroszewski JW, Bro R. Application of rotated PCA models to facilitate interpretation of metabolite profiles: commercial preparations of St. John’s Wort. Planta Med. 2009;75(3):271–9. doi: 10.1055/s-0028-1112194. [DOI] [PubMed] [Google Scholar]
- 11.Yuliana ND, Khatib A, Choi YH, Verpoorte R. Metabolomics for bioactivity assessment of natural products. Phytother Res. 2011;25(2):157–69. doi: 10.1002/ptr.3258. [DOI] [PubMed] [Google Scholar]
- 12.Malvezzi M, et al. European cancer mortality predictions for the year 2016 with focus on leukaemias. Ann Oncol. 2016;27(4):725–31. doi: 10.1093/annonc/mdw022. [DOI] [PubMed] [Google Scholar]
- 13.Van Cutsem E, et al. Cetuximab and Chemotherapy as Initial Treatment for Metastatic Colorectal Cancer. New Engl J Med. 2009;360(14):1408–17. doi: 10.1056/NEJMoa0805019. [DOI] [PubMed] [Google Scholar]
- 14.Misale S, et al. Emergence of KRAS mutations and acquired resistance to anti-EGFR therapy in colorectal cancer. Nature. 2012;486(7404):532–6. doi: 10.1038/nature11156. [DOI] [PMC free article] [PubMed] [Google Scholar]
- 15.Troiani T, et al. Increased TGF-alpha as a mechanism of acquired resistance to the anti-EGFR inhibitor cetuximab through EGFR-MET interaction and activation of MET signaling in colon cancer cells. Clin Cancer Res. 2013;19(24):6751–65. doi: 10.1158/1078-0432.CCR-13-0423. [DOI] [PubMed] [Google Scholar]
- 16.Wink M. Evolution of secondary metabolites in legumes (Fabaceae) South African Journal of Botany. 2013;89:164–75. doi: 10.1016/j.sajb.2013.06.006. [DOI] [Google Scholar]
- 17.Dixon RA, Sumner LW. Legume natural products: understanding and manipulating complex pathways for human and animal health. Plant Physiol. 2003;131(3):878–85. doi: 10.1104/pp.102.017319. [DOI] [PMC free article] [PubMed] [Google Scholar]
- 18.Toyomura K, Kono S. Soybeans, Soy Foods, Isoflavones and Risk of Colorectal Cancer: a Review of Experimental and Epidemiological Data. Asian Pac J Cancer Prev. 2002;3(2):125–32. [PubMed] [Google Scholar]
- 19.Auyeung KK, Law PC, Ko JK. Novel anti-angiogenic effects of formononetin in human colon cancer cells and tumor xenograft. Oncol Rep. 2012;28(6):2188–94. doi: 10.3892/or.2012.2056. [DOI] [PubMed] [Google Scholar]
- 20.Kang HW, et al. Deguelin, an Akt inhibitor, down-regulates NF-kappaB signaling and induces apoptosis in colon cancer cells and inhibits tumor growth in mice. Dig Dis Sci. 2012;57(11):2873–82. doi: 10.1007/s10620-012-2237-x. [DOI] [PubMed] [Google Scholar]
- 21.Lee CK, et al. Isoliquiritigenin inhibits tumor growth and protects the kidney and liver against chemotherapy-induced toxicity in a mouse xenograft model of colon carcinoma. J Pharmacol Sci. 2008;106(3):444–51. doi: 10.1254/jphs.FP0071498. [DOI] [PubMed] [Google Scholar]
- 22.Ellington AA, Berhow MA, Singletary KW. Inhibition of Akt signaling and enhanced ERK1/2 activity are involved in induction of macroautophagy by triterpenoid B-group soyasaponins in colon cancer cells. Carcinogenesis. 2006;27(2):298–306. doi: 10.1093/carcin/bgi214. [DOI] [PubMed] [Google Scholar]
- 23.D’Abrosca B, et al. Plant bioassay to assess the effects of allelochemicals on the metabolome of the target species Aegilops geniculata by an NMR-based approach. Phytochemistry. 2013;93:27–40. doi: 10.1016/j.phytochem.2013.03.016. [DOI] [PubMed] [Google Scholar]
- 24.Esposito A, et al. Potential allelopathic interference of Melilotus neapolitana metabolites on three coexisting species of Mediterranean herbaceous plant community. Journal of Plant Interactions. 2008;3:199–210. doi: 10.1080/17429140801902108. [DOI] [Google Scholar]
- 25.Kitagawa I, Wang H, Saito M, Takagi A, Yoshikawa M. Saponin and sapogenol. XXXV. Chemical constituents of astragali radix, the root of Astragalus membranaceus Bunge. (2). Astragalosides I,II and IV, acetylastragaloside I and isoastragalosides I and II. Chemical & Pharmaceutical Bulletin. 1983;31(2):698–708. doi: 10.1248/cpb.31.698. [DOI] [Google Scholar]
- 26.Polat E, Bedir E, Perrone A, Piacente S, Alankus-Caliskan O. Triterpenoid saponins from Astragalus wiedemannianus Fischer. Phytochemistry. 2010;71(5–6):658–62. doi: 10.1016/j.phytochem.2009.11.013. [DOI] [PubMed] [Google Scholar]
- 27.Murakami T, Kishi A, Matsuda H, Yoshikawa M. Medicinal Foodstuffs. XVII. Fenugreek Seed. (3). Structures of New Furostanol-Type Steroid Saponins, Trigoneosides Xa, Xb, XIb, XIIa, XIIb, and XIIIa, from the Seeds of Egyptian Trigonellafoenum-graecum L. Chemical & Pharmaceutical Bulletin. 2000;48(7):994–1000. doi: 10.1248/cpb.48.994. [DOI] [PubMed] [Google Scholar]
- 28.Wang ZB, et al. Triterpenoids and Flavonoids from the Leaves of Astragalus membranaceus and Their Inhibitory Effects on Nitric Oxide Production. Chem Biodivers. 2015;12(10):1575–84. doi: 10.1002/cbdv.201400371. [DOI] [PubMed] [Google Scholar]
- 29.Munday SC, Wilkins AL, Miles CO, Holland PT. Isolation and structure elucidation of dichotomin, a furostanol saponin implicated in hepatogenous photosensitization of sheep grazing Panicum dichotomiflorum. Journal of Agricultural and Food Chemistry. 1993;41(2):267–71. doi: 10.1021/jf00026a025. [DOI] [Google Scholar]
- 30.Agrawal PK. Assigning stereodiversity of the 27-Me group of furostane-type steroidal saponins via NMR chemical shifts. Steroids. 2005;70(10):715–24. doi: 10.1016/j.steroids.2005.04.001. [DOI] [PubMed] [Google Scholar]
- 31.Balunas MJ, Kinghorn AD. Drug discovery from medicinal plants. Life Sci. 2005;78(5):431–41. doi: 10.1016/j.lfs.2005.09.012. [DOI] [PubMed] [Google Scholar]
- 32.Kinghorn A, et al. Novel Strategies for the Discovery of Plant-Derived Anticancer Agents. Pharmaceutical Biology. 2008;41:53–67. doi: 10.1080/1388020039051744. [DOI] [Google Scholar]
- 33.Verpoorte R, Choi YH, Mustafa NR, Kim HK. Metabolomics: back to basics. Phytochem Rev. 2008;7(3):525–37. doi: 10.1007/s11101-008-9091-7. [DOI] [Google Scholar]
- 34.Khoogar R, Kim BC, Morris J, Wargovich MJ. Chemoprevention in gastrointestinal physiology and disease. Targeting the progression of cancer with natural products: a focus on gastrointestinal cancer. Am J Physiol Gastrointest Liver Physiol. 2016;310(9):G629–44. doi: 10.1152/ajpgi.00201.2015. [DOI] [PMC free article] [PubMed] [Google Scholar]
- 35.Hanburya CD, Whiteb CL, Mullanc BP, Siddiquea KHM. A review of the potential of Lathyrus sativus L. and L. cicera L. grain for use as animal feed. Animal Feed Science and Technology. 2000;87:1–27. doi: 10.1016/S0377-8401(00)00186-3. [DOI] [Google Scholar]
- 36.Nithiyanantham S, Selvakumar S, Siddhuraju P. Total phenolic content and antioxidant activity of two different solvent extracts from raw and processed legumes. Cicer arietinum L. and Pisum sativum L. Journal of Food Composition and Analysis. 2012;27:52–60. [Google Scholar]
- 37.Wang N, Daun JK. Effect of variety and crude protein content on nutrients and certain antinutrients in field peas. J Sci Food Agric. 2004;84:1021–1029. doi: 10.1002/jsfa.1742. [DOI] [Google Scholar]
- 38.Sammour HR, Mustafa AE, Badr S, Tahr W. Genetic variability of some quality traits in Lathyrus spp. Germoplasm. Acta agric Slovenica. 2007;90:33–43. [Google Scholar]
- 39.Li X, et al. A review of recent research progress on the astragalus genus. Molecules. 2014;19(11):18850–80. doi: 10.3390/molecules191118850. [DOI] [PMC free article] [PubMed] [Google Scholar]
- 40.Lee DY, et al. Anti-inflammatory cycloartane-type saponins of Astragalus membranaceus. Molecules. 2013;18(4):3725–32. doi: 10.3390/molecules18043725. [DOI] [PMC free article] [PubMed] [Google Scholar]
- 41.Bagherwal P. Phytosaponin Adjuvants: A Better Option for Vaccines. International Journal of PharmTech Research. 2011;3:1837–42. [Google Scholar]
- 42.Yesilada E, Bedir E, Calis I, Takaishi Y, Ohmoto Y. Effects of triterpene saponins from Astragalus species on in vitro cytokine release. J Ethnopharmacol. 2005;96(1–2):71–7. doi: 10.1016/j.jep.2004.08.036. [DOI] [PubMed] [Google Scholar]
- 43.Auyeung KK, Woo PK, Law PC, Ko JK. Astragalus saponins modulate cell invasiveness and angiogenesis in human gastric adenocarcinoma cells. J Ethnopharmacol. 2012;141(2):635–41. doi: 10.1016/j.jep.2011.08.010. [DOI] [PubMed] [Google Scholar]
- 44.Varshney IP, Sood AR, Srivastava HC, Harshe SN. Isolation of ethyl galactoside from Trigonella esculenta Willd seeds. Planta Med. 1974;26(1):26–32. doi: 10.1055/s-0028-1097965. [DOI] [PubMed] [Google Scholar]
- 45.Mahna S, Raisinghani G, Jain S. Diosgenin production in induced mutants of Trigonella esculenta Willd. Fitoterapia. 1994;65(6):515–6. [Google Scholar]
- 46.Yadav UC, Baquer NZ. Pharmacological effects of Trigonella foenum-graecum L. in health and disease. Pharm Biol. 2014;52(2):243–54. doi: 10.3109/13880209.2013.826247. [DOI] [PubMed] [Google Scholar]
- 47.Mehrafarin A, et al. Bioengineering of Important Secondary Metabolites and Metabolic Pathways in Fenugreek (Trigonella foenum-graecum L.) Journal of Medicinal Plants. 2010;3(35):1–18. [Google Scholar]
- 48.Basch E, Ulbricht C, Kuo G, Szapary P, Smith M. Therapeutic applications of fenugreek. Altern Med Rev. 2003;8(1):20–7. [PubMed] [Google Scholar]
- 49.Shabbeer S, et al. Fenugreek: A naturally occurring edible spice as an anticancer agent. Cancer Biology & Therapy. 2014;8(3):272–8. doi: 10.4161/cbt.8.3.7443. [DOI] [PMC free article] [PubMed] [Google Scholar]
- 50.Prabhu A, Krishnamoorthy M. Anticancer activity of Trigonella foenum-graecum on Ehrlich Ascites carcinoma in Mus musculus system. Journal of Pharmacy Research. 2010;3(6):1181–3. [Google Scholar]
- 51.Ionkova I, Momekov G, Proksch P. Effects of cycloartane saponins from hairy roots of Astragalus membranaceus Bge., on human tumor cell targets. Fitoterapia. 2010;81(5):447–51. doi: 10.1016/j.fitote.2009.12.007. [DOI] [PubMed] [Google Scholar]
- 52.Huang C, et al. Reversal of P-glycoprotein-mediated multidrug resistance of human hepatic cancer cells by Astragaloside II. J Pharm Pharmacol. 2012;64(12):1741–50. doi: 10.1111/j.2042-7158.2012.01549.x. [DOI] [PubMed] [Google Scholar]
- 53.Van Cutsem E, Cervantes A, Nordlinger B, Arnold D, Group EGW. Metastatic colorectal cancer: ESMO Clinical Practice Guidelines for diagnosis, treatment and follow-up. Ann Oncol. 2014;25:1–9. doi: 10.1093/annonc/mdu260. [DOI] [PubMed] [Google Scholar]
- 54.Van Cutsem E, et al. Cetuximab plus irinotecan, fluorouracil, and leucovorin as first-line treatment for metastatic colorectal cancer: updated analysis of overall survival according to tumor KRAS and BRAF mutation status. J Clin Oncol. 2011;29(15):2011–9. doi: 10.1200/JCO.2010.33.5091. [DOI] [PubMed] [Google Scholar]
- 55.Prahallad A, et al. Unresponsiveness of colon cancer to BRAF(V600E) inhibition through feedback activation of EGFR. Nature. 2012;483(7387):100–U46. doi: 10.1038/nature10868. [DOI] [PubMed] [Google Scholar]
- 56.Kim HK, Choi YH, Verpoorte R. NMR-based metabolomic analysis of plants. Nat. Protoc. 2010;5:536–549. doi: 10.1038/nprot.2009.237. [DOI] [PubMed] [Google Scholar]
Associated Data
This section collects any data citations, data availability statements, or supplementary materials included in this article.