

Abstract
Consolidation of declarative memories requires hippocampal-neocortical communication. Although experimental evidence supports the role of sharp-wave ripples in transferring hippocampal information to the neocortex, the exact cortical destinations and the physiological mechanisms of such transfer are not known. We used a conducting polymer-based conformable microelectrode array (NeuroGrid) to record local field potentials and neural spiking across the dorsal cortical surface of the rat brain, combined with silicon probe recordings in the hippocampus, to identify candidate physiological patterns. Parietal, midline, and prefrontal, but not primary cortical areas, displayed localized ripple (100 to 150 hertz) oscillations during sleep, concurrent with hippocampal ripples. Coupling between hippocampal and neocortical ripples was strengthened during sleep following learning. These findings suggest that ripple-ripple coupling supports hippocampal-association cortical transfer of memory traces.
Association neocortex is an evolutionarily recent type of cortex characterized by higher-order neural circuits that mediate multi-modal, advanced information processing related to cognition. A key unifying feature of association cortices is their strong reciprocal anatomical and functional connectivity with medial temporal lobe structures (1–3). This connectivity is required for consolidation of declarative memory, which involves the transfer of information rapidly encoded in the hippocampus to long-term storage (4–6). Consolidation of hippocampus-dependent memory is accompanied by increased immediate early gene expression and structural changes in neural networks of association cortices (7). High-frequency, synchronous hippocampal oscillations, called ripples, are implicated in mediating memory consolidation by distributing compressed representations of waking experience to interconnected cortical networks during periods of quiescence or slow-wave sleep (4, 8, 9). Hippocampal ripples have been temporally linked to cortical sleep spindles and patterned neuronal firing in certain association cortices (10–12). Occurrence of hippocampal ripples is likewise influenced by ongoing cortical oscillations (13) and is linked to whole-brain patterns of activation and deactivation over an extended time scale relative to ripple duration (14).
We developed a conducting polymer-based conformable microelectrode array [NeuroGrid (15, 16)] capable of recording local field potentials (LFP) and neural spiking across the dorsal cortical surface of the rat brain, enabling large-scale electrophysiological monitoring without sacrificing spatiotemporal resolution. A combination of these large-scale NeuroGrids (Fig. 1A), with high-density NeuroGrids and penetrating silicon probes, allowed us to investigate hippocampal-neocortical communication in behaving rats (n = 16 rats). We first compared the relationship between hippocampal and neocortical activity across the dorsal cortical surface during non–rapid eye movement (NREM) sleep (n = 3 rats with large-scale NeuroGrids). Both hippocampus and neocortex exhibited characteristic LFP patterns including delta waves, spindles, and gamma activity (Fig. 1B). Bursts of transient high-frequency activity (“ripples”; 100 to 150 Hz) were prominent in the hippocampus (Fig. 1B, H traces). Unexpectedly, a subset of neocortical electrodes also displayed transient epochs of oscillatory activity in the ripple band (Fig. 1B and fig. S1). The large-scale and spatially continuous coverage of the NeuroGrid enabled us to identify the anatomical locations of the ripple-generating cortical areas. Sensory evoked potentials were used to provide physiologic landmarks for primary sensory areas. Ripple oscillations were only exceptionally observed in primary somatosensory, visual, or motor cortices (occurrence rate <0.05 Hz) but were prevalent in the posterior parietal cortex (PPC) and midline structures (M), such as cingulate and retrosplenial cortices (rate: 0.1 to 0.5 Hz) (Fig. 1C and fig. S2; P < 10−18). To further characterize the relationship among the neocortical areas, we examined interregional, cross-frequency power coupling “comodulograms” (17, 18) of the surface-recorded signals. Power-power coupling in the ripple band was high between PPC and midline structures, but low when primary sensory areas were included in the comparison (Fig. 1D). This dissociation was not present in other frequency bands, where power coupling was present in all comparisons. These findings suggested that ripple activity is a characteristic feature of association cortices. We thus investigated the presence of ripples in the medial prefrontal cortex (mPFC) using implantable probes across cortical layers of this region in three additional rats (19). Ripples were also present in the mPFC with rates of occurrence similar to those of PPC or midline structures (fig. S4, B and C).
Fig. 1. Identification and anatomical localization of cortical ripples in freely moving rats.
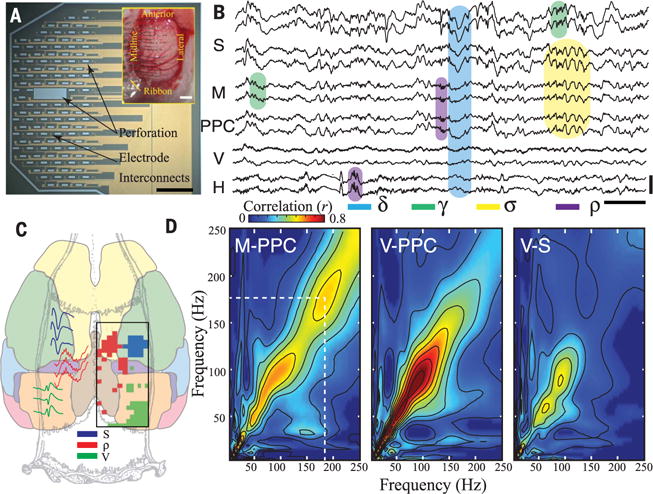
(A) Micrograph of a large-scale NeuroGrid consisting of uniformly distributed 15 μm by 15 μm electrodes and perforations over 5 mm by 9 mm area (scale bar, 1.5 mm). Inset: Large-scale NeuroGrid conforming to the dorsal surface of rat cortex from bregma anteriorly to lambda posteriorly (scale bar, 1 mm). (B) Sample wide-band LFP (0.1 to 1250 Hz) simultaneously acquired from multiple cortical areas and hippocampus with the large-scale NeuroGrid and a silicon probe (H). Sample recording includes somatosensory (S), midline (M), posterior parietal (PPC), and visual (V) cortices and hippocampal area CA1 (H). Shaded boxes illustrate delta (δ; blue), spindle (σ; yellow), and gamma (γ; green) as well as cortical and hippocampal ripple (ρ; purple) oscillations [scale bar: 0.5 s, 200 μV (top), 500 μV (bottom)]. (C) Anatomical map of neocortical ripple occurrence relative to somatosensory and visual cortex in a sample rat. Regions with somatosensory and visual evoked potential amplitude with greater than 3 standard deviations above the mean amplitude (based on an average of 97 somatosensory evoked potential and 320 visual evoked potential trials) are in blue and green, respectively. Regions with an occurrence rate of cortical ripples > 0.05 events per second are in red. Raw sample traces are shown on the left. See fig. S2A for data from additional two rats (total n = 3). (D) Sample comodulograms demonstrating cross-frequency coupling between midline (M), posterior parietal (PPC), primary visual (V), and somatosensory (S) cortices from the same session. Note strong comodulation centered at the ripple band between PPC and M cortices only. See fig. S3 for data from an additional rat.
Hippocampal ripples during NREM sleep often had a close temporal association with cortical ripples (Fig. 2A). The comodulograms of PPC and mPFC with hippocampus confirmed that cortical ripple band activity was coupled with the hippocampal ripple band and also revealed relationships with spindle band activity (Fig. 2B). We investigated the timing relationships between cortical ripples and characteristic NREM oscillations. The occurrence of hippocampal and cortical ripples was temporally coupled (Fig. 2C, left), with 13.5 ± 1.9% of hippocampal ripples co-occurring with cortical ripples within a window of ±50 ms (n = 10 rats). Cortical ripple events also had a significant cross-correlation with cortical spindles at 200 to 500 ms before the peak of spindle power, similar to the coupling observed between hippocampal ripples and cortical spindles (Fig. 2C, right, and fig. S4, C and D). Filtering LFP at delta frequency (0.5 to 4 Hz) surrounding cortical ripples (±2 s) demonstrated that cortical ripples tended to occur at the transition from “down” to “up” states of the cortical slow oscillation (Fig. 2D), which organizes NREM sleep into epochs of neural spiking and oscillatory activity, alternating with epochs of relative neural quiescence (13, 20, 21).
Fig. 2. Correlation of cortical ripples with other neocortical and hippocampal oscillations.
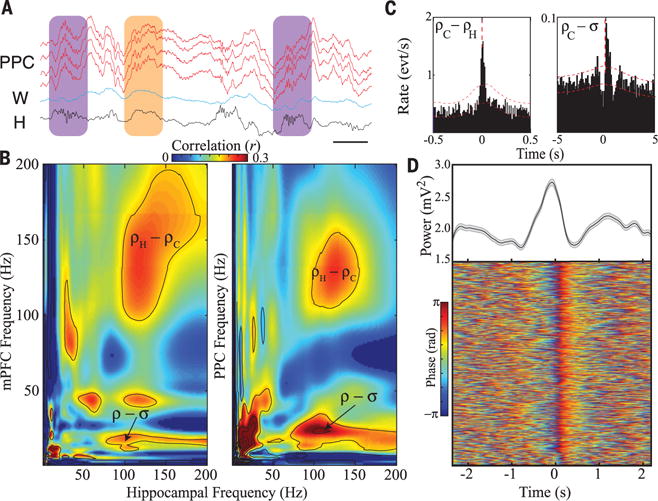
(A) Wide-band LFP traces (0.1 to 1250 Hz) from posterior parietal cortex (PPC, red), white matter (blue), and hippocampus (black). Hippocampal ripples coupled with cortical ripples of varying amplitude (purple); neocortical ripple in the absence of hippocampal ripple (orange; scale bar, 50 ms). (B) Comodulograms demonstrating cross-frequency power coupling between mPFC and hippocampus (left), as well as between posterior parietal cortex (PPC) and hippocampus (right), from different sample rats. Note strong comodulation centered at the ripple band in each case (total n = 3 rats with both mPFC and PPC implantation). (C) Cross-correlation between PPC and hippocampal ripples during NREM sleep (left; n = 12,976 PPC ripples, 7251 hippocampal ripples from three sessions in sample rat; see fig. S5 for data from nine additional rats for a total of n = 10 rats; red lines represent 95% confidence interval). Cross-correlation between ripples and sleep spindles in PPC (right; n = 8098 PPC ripples, 2442 PPC spindles from three sessions in sample rat; similar results from total n = 10 rats). (D) Average delta power with standard error (top; gray trace) and stacked epochs of delta phase (0.5 to 4 Hz) detected in infragranular layers of mPFC, both centered on occurrence of mPFC ripple (n = 812 ripples, 1 session in sample rat; similar results from a total of n = 3 rats).
Next, we focused on the spatial extent and physiological features of PPC ripples using high-density NeuroGrids (fig. S6A, n = 10 rats). PPC ripples had a mean peak frequency of 146 ± 5 Hz and a median duration of 53 ± 20 ms (fig. S6, B and C). PPC ripple occurrence was highest in NREM sleep (0.50 ± 0.2 events per second), intermediate during quiet wakefulness (0.10 ± 0.02 events per second), and low during REM sleep (0.01 ± 0.04 events per second; n = 9 sessions from 3 rats). PPC ripples were seen simultaneously over a maximum of 1 mm2 of cortical surface (Fig. 3, A and B). Oscillations with peak frequencies ranging from 50 to 150 Hz have been described in rodent cortex during REM sleep, as well as in human cortex (22–24). We identified oscillations in our data with a peak frequency of 70 to 80 Hz that were distinct from cortical ripples in regard to time of occurrence, coupling with hippocampal ripples, and anatomical distribution (fig. S7), suggesting that different types of high-frequency oscillations coexist in the neocortex.
Fig. 3. Electrophysiological characterization of PPC ripples.
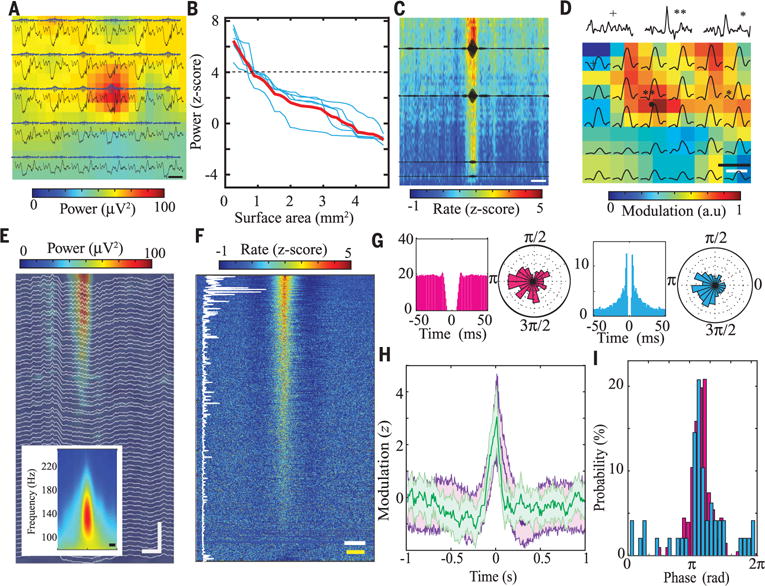
(A) Sample wide-band (0.1 to 1250 Hz, black) and filtered traces (100 to 150 Hz, gray with blue envelope) recorded by a high-density NeuroGrid (120-channel 6 × 5 array of tetrodes; fig. S6A) placed over PPC. Background color map shows spatially interpolated distribution of power in the ripple band (100 to 150 Hz; scale bar, 200 ms). (B) Simultaneous ripple band (100 to 150 Hz) power over cortical surface area (each blue line represents a different session, with red trace representing the mean and black dashed line representing the detection threshold; n = 5 sessions from 4 rats). (C) Normalized raster plot of multiple neurons’ modulation by PPC ripples recorded by the high-density NeuroGrid (70 electrodes, each line shows neural firing from one electrode), sorted by LFP ripple power (highest power at the top). Black superimposed traces show averaged filtered ripple LFP (100 to 150 Hz) at four different locations of the NeuroGrid (n = 831 ripples, single session; scale bar, 100 ms). (D) Mean firing rate of neurons (colored squares) on each tetrode of the NeuroGrid as well as the corresponding ripple power (black traces) during 100-ms time windows centered on PPC ripple peak (interpolated by a factor of 1 to give 12 × 10 electrodes). Black upper traces show ripple-centered sample histograms of neural firing from three electrodes [n = 797 ripples; spatial scale bar (black), 500 μm; time scale bar (white), 100 ms]. The reference region for ripple detection is noted by a black circle. (E) Sample depth profile of PPC ripples recorded by a linear silicon probe (64 sites) inserted across cortical layers (scale bar, 50 ms, 120 μm). Inset: Average PPC ripple time-frequency spectrogram (n = 100 ripples; scale bar 20 ms). (F) Normalized raster plot of neural firing during PPC ripples recorded by a silicon probe sorted on the basis of ripple-firing rate modulation. The vertical white trace shows the corresponding mean firing rate of each neuron during the entire session, illustrating that PPC ripples modulate both high– and low–firing rate neurons, albeit with different probability (n = 612 neurons; yellow scale bar, 100 ms; white scale bar, 10 Hz). (G) Autocorrelograms and polar plots of phase locking to PPC ripples for a putative interneuron (pink) and pyramidal cell (blue). (H) Average peri-event firing-rate histograms of representative neurons recorded by silicon probe (purple) and NeuroGrid (green) in the time window centered on PPC ripples (n = 612 neurons from sample 5 sessions in one rat, recorded by silicon probe; n = 134 neurons from sample 3 sessions in one rat, recorded by NeuroGrid). (I) Histograms of preferred ripple phase for pyramidal cells (blue) and interneurons (pink) (six sessions from two rats).
Ripple oscillations were associated with localized cortical neural firing, and larger-amplitude ripples had stronger spike entrainment (Fig. 3, C and D). In keeping with our ability to detect ripple-entrained neural firing with NeuroGrids from the cortical surface, LFP ripple power was confined to supragranular layers (Fig. 3E and fig. S4B). A large fraction of superficial neurons exhibited significant rate modulation during cortical ripples, and the strength of rate modulation was not strictly determined by baseline firing rate (Fig. 3F, vertical line). We clustered neural spikes into putative pyramidal cells and interneurons using a combination of waveform shape and firing rate (fig. S6E). Both cell types demonstrated entrained firing to cortical ripple oscillations, with preferred phases of firing (Fig. 3, G and H). The majority of putative pyramidal cells and interneurons (58% ± 4 and 49% ± 5, respectively; n = 3 sessions from 3 rats, recorded by both NeuroGrids and silicon probes) were significantly phase-locked to cortical ripples, with the pyramidal cells leading interneurons (Fig. 3I), similar to patterned firing observed with hippocampal ripples (25, 26).
Hippocampal-cortical interactions are believed to be critical for consolidation of hippocampal-dependent memory tasks (5, 8, 20). Both hippocampus and PPC are involved in supporting components of spatial behaviors, and PPC likely serves as a cortical integration site for hippocampally generated allocentric spatial information and egocentric spatial orientation to permit goal-directed navigation (27–30). Therefore, we asked whether and how cortical ripples are affected by spatial learning. Of the 10 rats implanted with a high-density NeuroGrid above the PPC and a silicon probe in the hippocampus, six were trained on a hippocampus-dependent cheeseboard maze task (31), and the remaining four rats served as a control group that did not undergo task learning but explored an open maze prior to sleep (Fig. 4A). Electrophysiological recordings were first performed in the home cage during a period of intermixed free behavior and sleep to establish average oscillation occurrence and coupling for each rat. Subsequently, the rats were initiated on the behavioral protocol, and we recorded during three sleep sessions in the home cage after each phase of the task: (i) postexploration sleep (SE): after free exploration of a cheeseboard maze with randomly placed water rewards; (ii) postlearning sleep 1 (S1): after first training session to retrieve water rewards from three locations on the same cheeseboard maze; and (iii) postlearning sleep 2 (S2): after second training session for the same three reward locations (Fig. 4A). The control group of rats (n = 4) was recorded during postexploration sleep only on consecutive days of exploration (SE) and did not advance through the learning portion of the protocol. Long-term memory for the reward locations was quantified by testing the rats’ retrieval of rewards from the three locations 24 hours after training (test); all rats had >90% performance as scored by ability to retrieve three water rewards per trial during the first 30-s access to the maze. Five training days (two training sessions per day) were recorded from each rat. Reward locations varied daily to induce new spatial learning (32).
Fig. 4. Coupling of hippocampal and PPC ripples during NREM sleep in a spatial memory task.
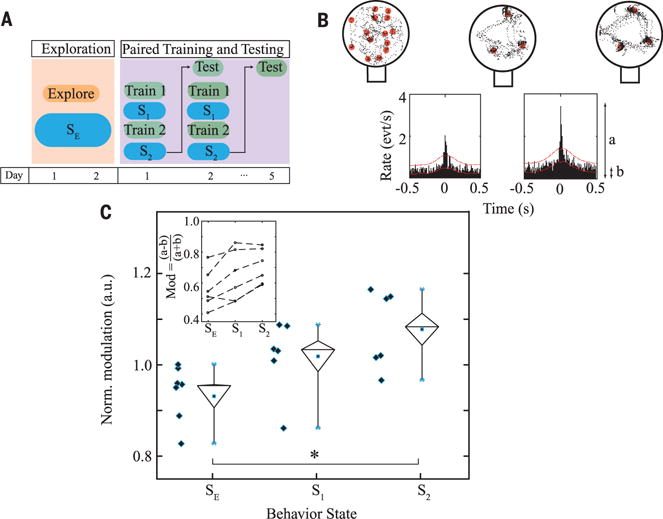
(A) Schematic of behavioral protocol. Blue boxes indicate sleep sessions for assessing coupling of hippocampal and PPC ripples. SE, sleep after exploration; S1 and S2, sleep sessions after first and second training sessions, respectively. (B) Top: sample path of a rat (black) over maze surface relative to water reward locations (red) during exploration (left), during last five trials of second training session (middle), and during five trials of testing 24 hours later (right). Bottom: sample cross-correlograms between PPC and hippocampal ripples during post-exploration (SE) sleep session (left; time 0 = occurrence of hippocampal ripple; n = 13,206 cortical ripples and 7252 hippocampal ripples) and posttraining sleep session (S2; right; n = 5225 cortical ripples and 3128 hippocampal ripples; red lines represent 95% confidence intervals). (C) Group statistics demonstrating progressive increase in hippocampal–PPC ripple coupling across sleep sessions occurring after sequential posttraining sleep sessions (S1 and S2) compared to after free exploration (SE). Inset demonstrates changes in coupling for each individual rat, with coupling modulation calculated as the ratio of the cross-correlogram peak [“a” in panel (B); maximal value within ±50 ms] to the baseline of the cross-correlogram [“b” in panel (B); midpoint of upper and lower boundary of 95% confidence interval averaged over 10 s of cross-correlation]. Normalized coupling modulation was calculated by subtracting the average coupling strength of hippocampal and PPC ripples during sleep before initiation of behavior protocol from the coupling strength obtained during SE, S1, and S2 for each rat (pooled over 5 days of training). Edges of the large diamond plot correspond to −1 standard error, median, and +1 standard error (from bottom to top), with embedded square representing the mean; whiskers show minimum and maximum values (n = 6, Kruskal–Wallis test; P = 0.013, Bonferroni correction; *P < 0.05 between groups as determined by post-hoc testing). Blue diamonds show values for individual rats.
The overall sleep structure was similar across the sleep sessions as characterized by the occurrence rates of neocortical spindles, hippocampal and cortical ripples, and NREM power spectra (fig. S8). By contrast, the strength of coupling between hippocampal and PPC ripples showed significant changes after different experiences (Fig. 4B). Hippocampal-PPC ripple coupling increased during postlearning sleep compared to postexploration sleep, a trend that was consistent across all six trained rats. Furthermore, multiple consecutive sessions of exploration in the control rats did not induce a change in hippocampal-PPC ripple coupling, and these coupling values were significantly less than those in trained rats (fig. S9, P = 0.02). The magnitude of coupling in the trained rats was also stronger after the second training session compared to after the first training session, demonstrating that the amount of training correlated with the strength of hippocampal-PPC ripple coupling (Fig. 4C).
In this study, we have identified ripple frequency oscillations that were present in association but not in primary sensory cortical areas. These association areas, including parietal, retrosplenial, anterior cingulate, and medial prefrontal cortex, are reciprocally anatomically and functionally connected with medial temporal lobe structures (1, 2) and exhibit extensive cortico-cortical connections (33). Hippocampal and neo-cortical ripples co-occur in these areas, reflecting either a direct hippocampal–entorhinal cortex–neocortex excitation (10, 14) or an indirect common drive by cortical slow oscillations (12, 20, 34, 35). The coordination of cortical ripples with “down” to “up” state transitions, and the correlation of both hippocampal and cortical ripples with sleep spindles, suggests that cortical ripples may form part of the hippocampal-cortical dialogue during NREM sleep. Following induction of long-term hippocampal-dependent memory, coupling of hippocampal and neocortical ripples increased significantly. Analogous to hippocampal ripples, cortical ripples may signify information transfer involving association cortex. Overall, our findings suggest that ripple oscillation mechanisms of NREM sleep in both hippocampal and neocortical association areas support memory consolidation. Note added in proof: After our manuscript went in press, a paper relevant to the findings presented here was published (36).
Supplementary Material
Acknowledgments
This work was supported by NIH grants UO1NS099705, U01NS090583, and MH107396 and Defense Advanced Research Projects Agency (DARPA) N66001-17-C-4002. The device fabrication was performed Cornell NanoScale Science & Technology Facility (CNF) at a member of the National Nanotechnology Coordinated Infrastructure (NNCI), which is supported by the National Science Foundation (grant ECCS-1542081). D.K. was supported through the Simons Foundation (junior fellow). J.N.G. was supported by the Pediatric Scientist Development Program. We thank O. Rauhala (University of Minnesota) and S. Rogers (NYU Langone Medical Center), M. Skvarla (CNF), R. Ilic (CNF), and M. Metzler (CNF) and Buzsaki Lab members for their support.
Footnotes
The authors declare that they have no competing interests. All data needed to evaluate the conclusions in the paper are present in the paper and/or the supplementary materials. Additional data related to this paper may be requested from the authors.
SUPPLEMENTARY MATERIALS
www.sciencemag.org/content/358/6361/369/suppl/DC1
Materials and Methods
References (37)
REFERENCES AND NOTES
- 1.Burwell RD, Amaral DG. J Comp Neurol. 1998;391:293–321. doi: 10.1002/(sici)1096-9861(19980216)391:3<293::aid-cne2>3.0.co;2-x. [DOI] [PubMed] [Google Scholar]
- 2.Buckner RL, Andrews-Hanna JR, Schacter DL. Ann N Y Acad Sci. 2008;1124:1–38. doi: 10.1196/annals.1440.011. [DOI] [PubMed] [Google Scholar]
- 3.Kahn I, Andrews-Hanna JR, Vincent JL, Snyder AZ, Buckner RL. J Neurophysiol. 2008;100:129–139. doi: 10.1152/jn.00077.2008. [DOI] [PMC free article] [PubMed] [Google Scholar]
- 4.Buzsáki G. Hippocampus. 2015;25:1073–1188. doi: 10.1002/hipo.22488. [DOI] [PMC free article] [PubMed] [Google Scholar]
- 5.Kitamura T, et al. Science. 2017;356:73–78. doi: 10.1126/science.aam6808. [DOI] [PMC free article] [PubMed] [Google Scholar]
- 6.Maingret N, Girardeau G, Todorova R, Goutierre M, Zugaro M. Nat Neurosci. 2016;19:959–964. doi: 10.1038/nn.4304. [DOI] [PubMed] [Google Scholar]
- 7.Maviel T, Durkin TP, Menzaghi F, Bontempi B. Science. 2004;305:96–99. doi: 10.1126/science.1098180. [DOI] [PubMed] [Google Scholar]
- 8.Ego-Stengel V, Wilson MA. Hippocampus. 2010;20:1–10. doi: 10.1002/hipo.20707. [DOI] [PMC free article] [PubMed] [Google Scholar]
- 9.Girardeau G, Benchenane K, Wiener SI, Buzsáki G, Zugaro MB. Nat Neurosci. 2009;12:1222–1223. doi: 10.1038/nn.2384. [DOI] [PubMed] [Google Scholar]
- 10.Peyrache A, Battaglia FP, Destexhe A. Proc Natl Acad Sci USA. 2011;108:17207–17212. doi: 10.1073/pnas.1103612108. [DOI] [PMC free article] [PubMed] [Google Scholar]
- 11.Wang DV, Ikemoto S. J Neurosci. 2016;36:10663–10672. doi: 10.1523/JNEUROSCI.1042-16.2016. [DOI] [PMC free article] [PubMed] [Google Scholar]
- 12.Siapas AG, Wilson MA. Neuron. 1998;21:1123–1128. doi: 10.1016/s0896-6273(00)80629-7. [DOI] [PubMed] [Google Scholar]
- 13.Sirota A, Csicsvari J, Buhl D, Buzsáki G. Proc Natl Acad Sci USA. 2003;100:2065–2069. doi: 10.1073/pnas.0437938100. [DOI] [PMC free article] [PubMed] [Google Scholar]
- 14.Logothetis NK, et al. Nature. 2012;491:547–553. doi: 10.1038/nature11618. [DOI] [PubMed] [Google Scholar]
- 15.Khodagholy D, et al. Sci Adv. 2016;2:e1601027. doi: 10.1126/sciadv.1601027. [DOI] [PMC free article] [PubMed] [Google Scholar]
- 16.Khodagholy D, et al. Nat Neurosci. 2015;18:310–315. doi: 10.1038/nn.3905. [DOI] [PMC free article] [PubMed] [Google Scholar]
- 17.Buzsáki G, et al. Neuroscience. 2003;116:201–211. doi: 10.1016/s0306-4522(02)00669-3. [DOI] [PubMed] [Google Scholar]
- 18.Canolty RT, et al. Science. 2006;313:1626–1628. doi: 10.1126/science.1128115. [DOI] [PMC free article] [PubMed] [Google Scholar]
- 19.Fujisawa S, Buzsáki G. Neuron. 2011;72:153–165. doi: 10.1016/j.neuron.2011.08.018. [DOI] [PMC free article] [PubMed] [Google Scholar]
- 20.Isomura Y, et al. Neuron. 2006;52:871–882. doi: 10.1016/j.neuron.2006.10.023. [DOI] [PubMed] [Google Scholar]
- 21.Eschenko O, Ramadan W, Mölle M, Born J, Sara SJ. Learn Mem. 2008;15:222–228. doi: 10.1101/lm.726008. [DOI] [PMC free article] [PubMed] [Google Scholar]
- 22.Menendez de laPrida L, Staba RJ, Dian JA. J Clin Neurophysiol. 2015;32:207–219. doi: 10.1097/WNP.0000000000000150. [DOI] [PMC free article] [PubMed] [Google Scholar]
- 23.Blanco JA, et al. Brain. 2011;134:2948–2959. doi: 10.1093/brain/awr212. [DOI] [PMC free article] [PubMed] [Google Scholar]
- 24.Scheffzük C, et al. PLOS ONE. 2011;6:e28489. doi: 10.1371/journal.pone.0028489. [DOI] [PMC free article] [PubMed] [Google Scholar]
- 25.Stark E, et al. Neuron. 2014;83:467–480. doi: 10.1016/j.neuron.2014.06.023. [DOI] [PMC free article] [PubMed] [Google Scholar]
- 26.Csicsvari J, Hirase H, Czurkó A, Mamiya A, Buzsáki G. J Neurosci. 1999;19:274–287. doi: 10.1523/JNEUROSCI.19-01-00274.1999. [DOI] [PMC free article] [PubMed] [Google Scholar]
- 27.O’Keefe J, Nadel L. The Hippocampus as a Cognitive Map. Oxford Univ Press; 1978. [Google Scholar]
- 28.Nitz DA. Nat Neurosci. 2012;15:1365–1367. doi: 10.1038/nn.3213. [DOI] [PubMed] [Google Scholar]
- 29.Whitlock JR, Sutherland RJ, Witter MP, Moser MB, Moser EI. Proc Natl Acad Sci USA. 2008;105:14755–14762. doi: 10.1073/pnas.0804216105. [DOI] [PMC free article] [PubMed] [Google Scholar]
- 30.Calton JL, Taube JS. Neurobiol Learn Mem. 2009;91:186–196. doi: 10.1016/j.nlm.2008.09.015. [DOI] [PMC free article] [PubMed] [Google Scholar]
- 31.Dupret D, O’Neill J, Pleydell-Bouverie B, Csicsvari J. Nat Neurosci. 2010;13:995–1002. doi: 10.1038/nn.2599. [DOI] [PMC free article] [PubMed] [Google Scholar]
- 32.Gelinas JN, Khodagholy D, Thesen T, Devinsky O, Buzsáki G. Nat Med. 2016;22:641–648. doi: 10.1038/nm.4084. [DOI] [PMC free article] [PubMed] [Google Scholar]
- 33.Carlyle BC, et al. Proc Natl Acad Sci USA. 2014;111:5036–5041. doi: 10.1073/pnas.1322360111. [DOI] [PMC free article] [PubMed] [Google Scholar]
- 34.Sirota A, et al. Neuron. 2008;60:683–697. doi: 10.1016/j.neuron.2008.09.014. [DOI] [PMC free article] [PubMed] [Google Scholar]
- 35.Battaglia FP, Sutherland GR, McNaughton BL. Learn Mem. 2004;11:697–704. doi: 10.1101/lm.73504. [DOI] [PMC free article] [PubMed] [Google Scholar]
- 36.Wilber AA, Skelin I, Wu W, McNaughton BL. Neuron. 2017;95:1406–1419.e5. doi: 10.1016/j.neuron.2017.08.033. [DOI] [PMC free article] [PubMed] [Google Scholar]
Associated Data
This section collects any data citations, data availability statements, or supplementary materials included in this article.