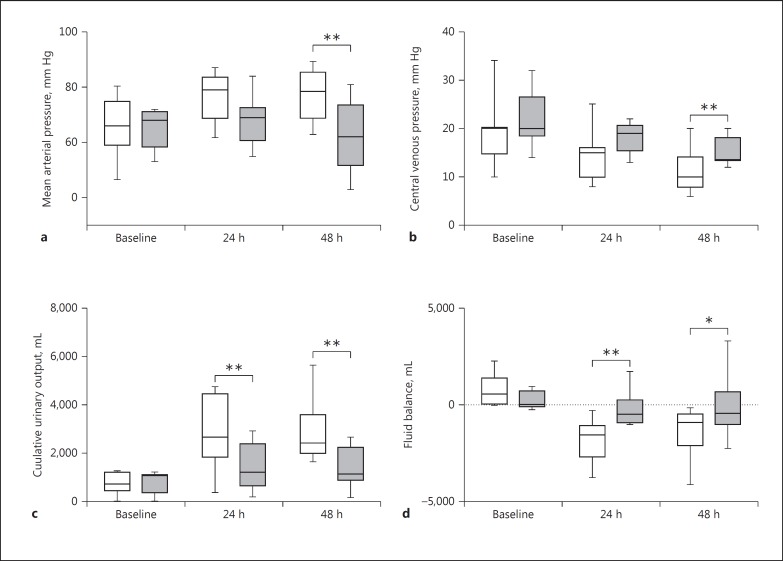
Fig. 3.
Box-and-whiskers plots of changes in mean arterial pressure (a), central venous pressure (b), 24-h urinary production (c), and 24-h fluid balance (d). Boxes indicate interquartile ranges and whiskers minimum and maximum values. □, IABP responders; ■, IABP non-responders. * p < 0.05, ** p < 0.01.

