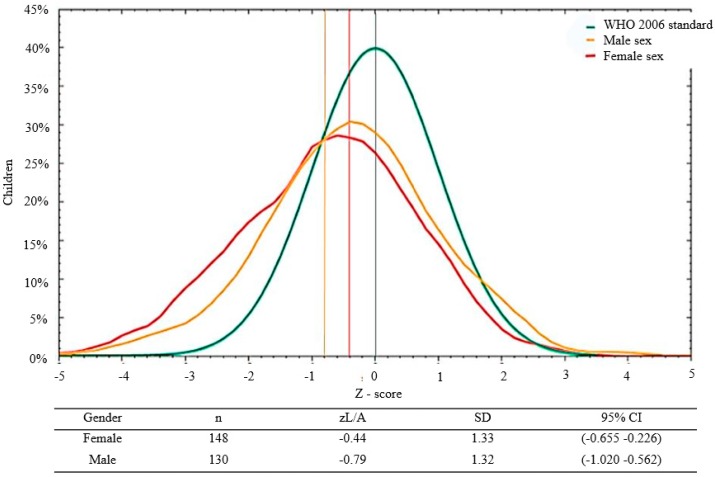
Figure 1.
Distribution of L/A z-scores by sex* in 278 infants and young children seen at the Klinik Saint Espri Health Center, Port au Prince, Haiti (August 2014). Footnote: The green line indicates the WHO 2006 standard; the yellow line represents males and the red line females. * ANOVA, p = 0.029.

