 The polymerase chain reaction and many isothermal amplifications are able to achieve super gene amplification.
Abstract
The polymerase chain reaction and many isothermal amplifications are able to achieve super gene amplification. Unfortunately, most commonly-used transduction methods, such as dye staining and Taqman-like probing, still suffer from shortcomings including false signals or difficult probe design, or are incompatible with multi-analysis. Here a universal and rational gene detection strategy has been established by translating isothermal amplicons to enzyme-free strand displacement circuits via three-way junction-based remote transduction. An assistant transduction probe was imported to form a partial hybrid with the target single-stranded nucleic acid. After systematic optimization the hybrid could serve as an associative trigger to activate a downstream circuit detector via a strand displacement reaction across the three-way junction. By doing so, the detection selectivity can be double-guaranteed through both amplicon–transducer recognition and the amplicon–circuit reaction. A well-optimized circuit can be immediately applied to a new target detection through simply displacing only 10–12 nt on only one component, according to the target. More importantly, this property for the first time enables multi-analysis and logic-analysis in a single reaction, sharing a single fluorescence reporter. In an applicable model, trace amounts of Cronobacter and Enterobacteria genes have been clearly distinguished from samples with no bacteria or one bacterium, with ultra-high sensitivity and selectivity.
Introduction
The polymerase chain reaction (PCR), a powerful amplification technique for amplifying nucleic acids, has been used to detect genes effectively for a long time.1,2 To further increase the experimental portability and realize point-of-care detection, a series of ultra-sensitive isothermal amplifications happening at constant temperature have been developed, including nucleic acid sequence-based amplification (NASBA),3 rolling circle amplification (RCA),4 helicase-dependent amplification (HDA),5 recombinase polymerase amplification (RPA)6 and loop-mediated isothermal amplification (LAMP),7etc. Unfortunately, whereas these reactions are exceedingly effective, their real-world applications are still seriously plagued by difficulties in selectively distinguishing the expected amplicons from spurious amplicons.8–10 Most commonly-used methods are based on detecting accumulated base pairs, accompanied by polymerization. For example, amplicons can be detected by the naked eye11 because of the pyrophosphate ions produced during amplification, which form white precipitates of magnesium pyrophosphate. Otherwise, real-time fluorescent detection can be achieved through dyes such as calcein12 and hydroxyl naphthol blue13 intercalating into nucleic base pairs. Even so, non-target parasites produced through primer–primer self-extension cannot be discriminated by means of the above methods. Shortness of sequence specificity has frequently led to false-positive reports.
With the purpose to increase the detection selectivity, sequence-specific methods, similar to the Taqman probe for PCR, have recently been imported into isothermal amplifications.14,15 Among all of the isothermal amplifications, LAMP is of special interest because (i) it could amplify both RNA and DNA templates upwards of ∼109-fold with only one polymerase and (ii) by using alternating extension and strand displacement reactions, the reaction finally yields long stem-loop concatamers containing four kinds of single-stranded loop sequences, usually 15 nt to 35 nt in length, that can right serve as inputs for downstream sequence-specific signalling probes. In an example developed by the Plaxo group,16 specific hybridization between one loop amplicon and a methylene blue (MB)-tagged antisense hairpin increases the distance between MB and the electrode, thus producing a reduced MB electrochemical signal. In our recent efforts, a one-step strand displacement (OSD) strategy that is even more specific than hybridization was engineered to monitor loop amplicons through real-time fluorescence17 and off-the-shelf devices including glucometers18 and pregnancy test strips.19 Subsequently, in order to enhance the sensitivity and signal amplitude, we further cascaded the OSD reaction from one step to multiple steps, forming an enzyme-free circuit named the catalytic hairpin assembly (CHA).20 However, all of the above methods require the component sequences to be completely rebuilt according to the different target amplicons. They are, therefore, expensive and sophisticated, and there is always the risk of bad design, especially for multi-analysis.
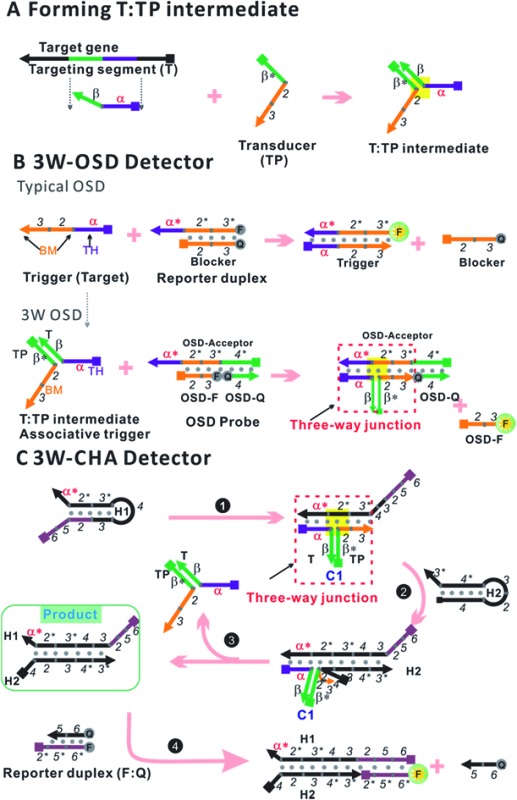
To transport different input oligonucleotides into one set of well-designed output probes, universal and intelligent signal transduction strategies are in urgent requirement. Here we put forward one solution based on importing a three-way junction (3WJ) based design. An essential part of the design is building an intermediate structure (T:TP) through partial hybridization between the target oligonucleotide (T) and a transducer probe (TP, Fig. 1A). T:TP contains two single-stranded overhangs that are domain α and domain 2–3, from the target T and transducer TP, respectively. Only if T:TP is formed can domain α and domain 2–3 associate closely enough to form an integrated trigger to initialize downstream reactions (e.g. OSD or CHA). In other words, in such a manner direct detection of the target T is replaced by indirect detection of the T:TP hybrid. This design has shown several exclusive advantages. First, the detection selectivity can be double-guaranteed through two specific reactions, which are TP–T recognition and the T:TP–OSD/CHA reaction, respectively. High resolution for alleles is thus achieved. Second, a well-optimized OSD probe or CHA circuit can be immediately applied to a new target through simply displacing domain α* (on the respective component) according to domain α of the target. Finally, but more importantly, this property enables multi-analysis and logic-analysis in a single reaction for the first time, sharing a single fluorescence reporter. In an applicable model, mixtures of LAMP amplicons of the genes of two foodborne bacteria, Cronobacter and Enterobacteria, have been clearly distinguished from samples with no bacteria or one bacterium, with ultra-high sensitivity and selectivity.
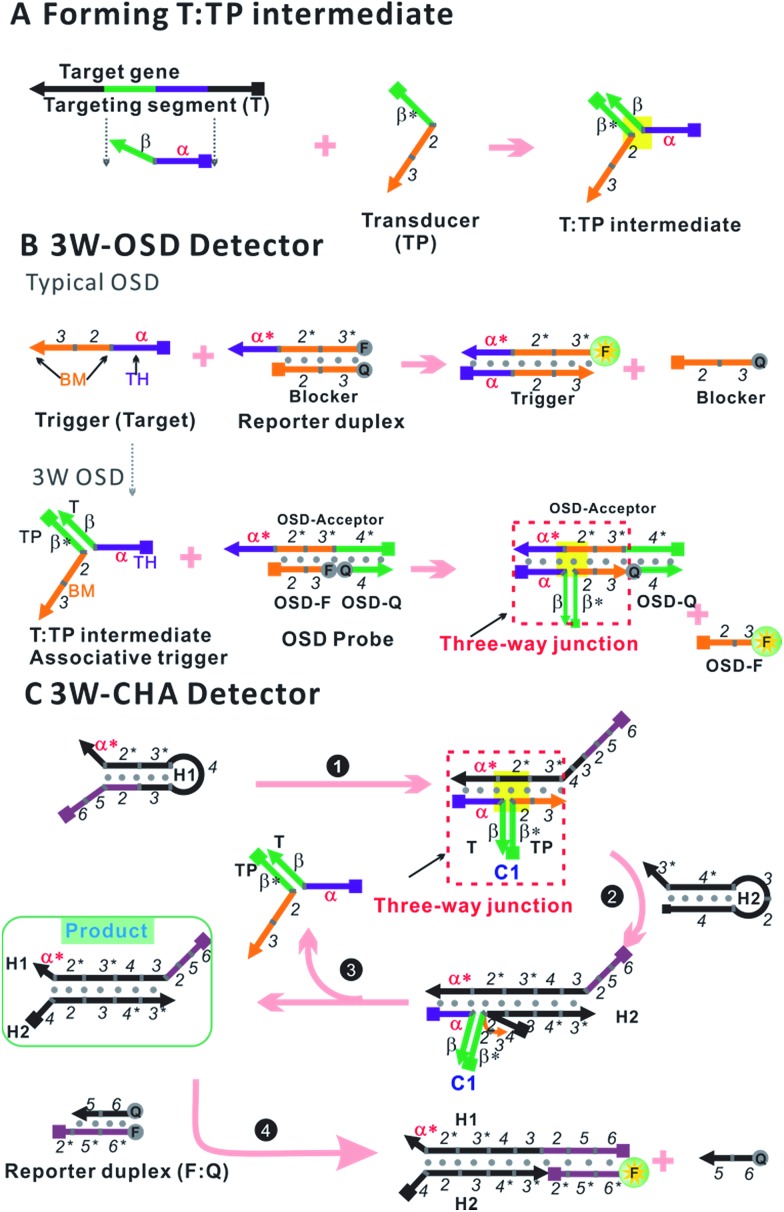
Fig. 1. Design schematic for three-way junction-based transduction. (A) Scheme for T:TP intermediate formation. (B) Scheme for a detector based on a typical one-step strand displacement reaction (OSD) and three-way junction-based OSD (3W-OSD). (C) Scheme for a detector based on three-way junction-based CHA (3W-CHA). The nucleic acid strands are represented by domains named as characters or numbers. Asterisks (*) are used to represent complementary sequences.
Results and discussion
Designing one-step and multi-step detectors based on three-way junction-based transduction
The one-step toehold-mediated strand displacement (OSD) reaction is well-known for its extraordinary capability to make nucleic acid detection more specific, more robust, and easier to be integrated and programmed.20–29 In a typical OSD scheme (Fig. 1B, top), the target, widely called the trigger, is defined by two single-stranded segments. The short segment (domain α, typically ∼6–12 nt) serves as a toehold (TH) to bind with its complementary sticky end on the reporter duplex (acceptor:blocker). Following this initial step, the longer segment, called the branch migration domain (BM, domain 2–3, typically more than ∼12 nt), triggers a branch migration process that finally displaces the blocker (sequence 2–3) away from the reporter duplex. Usually, fluorescein amidite (FAM) and a black quencher label the acceptor and blocker, respectively. Fluorescence recovery led by dissociation of the quencher can be used to monitor the OSD process. Besides directly serving as detectors, several OSD processes can be cascaded, forming different types of multi-step molecular machines known as enzyme-free nucleic acid circuits.20,23–29 The catalytic hairpin assembly (CHA) is one of these circuits with a signal amplification function. In a typical CHA pathway (Fig. S1†), the trigger (commonly called C1) initializes the first OSD reaction that opens a hairpin structure called H1. Thereafter, domain 3 in H1 is released as a toehold for the second OSD reaction that opens the other hairpin called H2, forming a C1:H1:H2 intermediate. Since C1 interacts with H1 merely via α–α* binding, it will automatically dissociate from the intermediate, leaving the H1:H2 duplex as the final product. The dissociated C1 can be recycled into the next round of the OSD reaction without being consumed, like a catalyst. To monitor the CHA reaction, H1:H2 can be designed to trigger one more OSD reaction, displacing the FAM-labelled strand (F) away from the quencher-labelled strand (Q).
In previous studies, we and other researchers have successfully employed various targets as triggers for OSD or CHA reactions, including oligonucleotides, aptamers, microRNAs, and isothermal amplicons.17,20,26,27,30,31 Through these methods, sequence-specific detection of these targets could be realized over a wide temperature range from 4 °C to 60 °C.31,32 In order to realize a universal well-designed output OSD or CHA to detect different input targets, we make an important modification on the trigger. As shown in Fig. 1A, the TH domain (α) and BM domain (2–3) of the trigger are virtually separated into two sequences. The TH domain (α) is embedded in the target sequence (T, defined as α–β), while the BM domain (2–3) is in a designed transducer sequence (TP, defined as β*–2–3). It is supposed that only if T and TP bond with each other via stable β-β* hybridization, can the TH domain (α) and the BM domain (2–3) function correspondingly to initialize an effective OSD or CHA reaction. In other words, in such a manner direct detection of the target T is replaced by indirect detection of T:TP as an associative trigger. Due to the T:TP:OSD-acceptor (in OSD) or T:TP:H1 (in CHA) forming a three-way junction-based structure (highlighted in yellow in Fig. 1A and B, bottom, and C) during the reaction, we name the two detection strategies 3W-OSD detection and 3W-CHA detection, respectively. Using the above design, a well-optimized OSD probe or CHA circuit can be immediately applied to a new target through simply displacing domain α* (on the component OSD-acceptor or H1) according to domain α of the target. Specially for the 3W-OSD detector, we make another modification on the typical OSD reporter duplex (Fig. 1B, bottom), in which the acceptor probe (OSD-acceptor) is extended with domain 4*, which is a piece of constructive sequence and is completely non-relevant to the trigger. It is only used to localize its complementary strand (domain 4, OSD-Q), a signalling probe labelled with a quencher. Once the OSD reaction happens, the OSD-F strand (domain 2–3) labelled with FAM can be released, lighting up its fluorescence. Thus, all the other sequences that are critical to the efficiency of OSD, or those that are expensively labelled, remain unchanged.
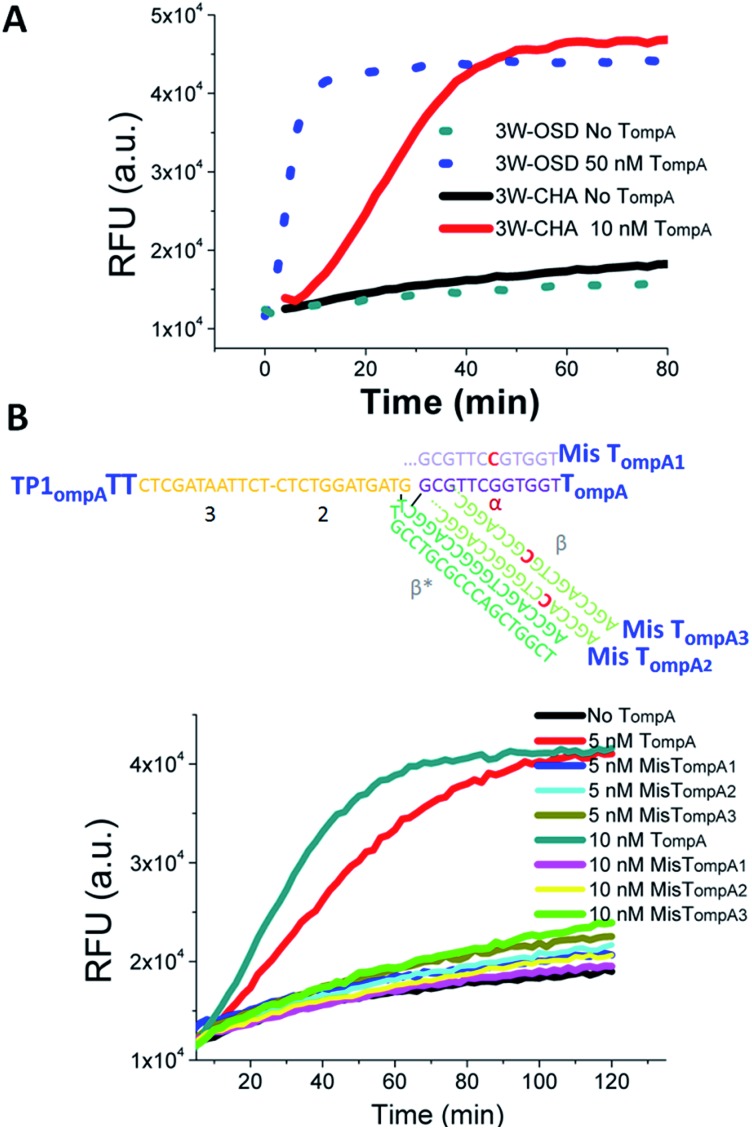
In initial proof-of-concept experiments, the functions of the 3W-OSD and 3W-CHA detectors were assayed and compared with a selected single-stranded fragment in Cronobacter (gene ompA), shortened as TompA. With applying the detectors to monitor isothermal amplicons in a real-time manner as the ultimate goal, the component sequences were for the first time designed for LAMP running temperatures, as high as 55 °C to 60 °C (the rule set for the sequence design will be explained in the next section). As shown in Fig. 2A, the TompA:TP complex successfully triggered both the OSD and CHA reactions but with very different sensitivities. For OSD detection, the concentration of released FAM (represented by the final fluorescence enhancement) would be theoretically equivalent to that of TompA. By contrast, for CHA detection, the concentration of released FAM would be theoretically equivalent to that of the lesser of H1 and H2 (here, H1). Therefore, in the example presented in Fig. 2A, 10 nM TompA with CHA detection (in the presence of 50 nM H1) can produce a fluorescence signal equal to that of 50 nM TompA with OSD detection. According to our previous studies, CHA using a linear trigger could amplify tens- to hundreds-fold in comparison with OSD.20 Due to such a high sensitivity, we only focused on the 3W-CHA detector in further studies.
Fig. 2. Proof-of-concept detection of a single-stranded oligonucleotide using three-way junction-based transduction. (A) Fluorescence kinetic curves for samples with and without TompA, using 3W-OSD detection and 3W-CHA detection, respectively. (B) Fluorescence kinetic curves for samples with TompA, MisTompA1, MisTompA2, MisTompA3, or without TompA, using 3W-CHA detection. 3W-OSD detector components added: TPompATT, OSD-acceptor, OSD-F and OSD-Q. 3W-CHA detector components added: TP1ompATT, CHA1-H1ompA, CHA1-H2, CHA1-F and CHA1-Q. The fluorescence signals were collected at a wavelength of 530 ± 20 nm, under excitation at 485 ± 20 nm. This applies to all the other fluorescence figures.
It should be noted that the introduction of a single mutation at the middle of either domain α or domain β in TompA can almost completely inhibit the CHA catalytic reaction (Fig. 2B). The excellent allele discrimination is double-guaranteed by two specific reactions, which are TP–T recognition via β*–β hybridization and T:TP-H1 recognition via α–α* hybridization, respectively.
Rule set for the design of the T:TP associative trigger
The reaction rate of any OSD reaction has been proven to be highly relevant to the length of the toehold and the stability of the transition state, where the first base pair is formed between the acceptor and the BM domain of the trigger.21,26 These two key factors were taken into consideration during our optimization to make a robust high-temperature 3W-CHA detector. Several important hints could be found from previous studies carried out at ambient temperature: (i) when the toehold binding is sufficiently strong, strand displacement across a three-way junction can happen efficiently.23,33–37 However, very strong toehold binding, which leads to irreversible interactions, is undesirable in the case of CHA.20 This is because C1, the catalyst of CHA, has to automatically dissociate from the C:H1:H2 intermediate to realize self-regeneration. For a sequence containing 50% GC bases, a TH domain (domain α) with ∼10 nt was proven to be effective enough at ambient temperature.26,38,39 (ii) It has been proven that compared with the condition without bulged nucleotides, a few bulged nucleotides (such as double thymidines) located in the three-way junction region could provide higher stacking energies and thus enable the easier assembly of short oligomers (ten to fifteen nucleotides).40–42 This hints that the addition of double-bulged thymidines (TT) on TP at the TH-BM transition location might be helpful to further stabilize the DNA three-way junction and thus promote the branch migration process. (iii) A high-temperature OSD or CHA reaction could be realized through extending the base numbers of each component until the binding free energy of each domain matches that at ambient temperature.17,31
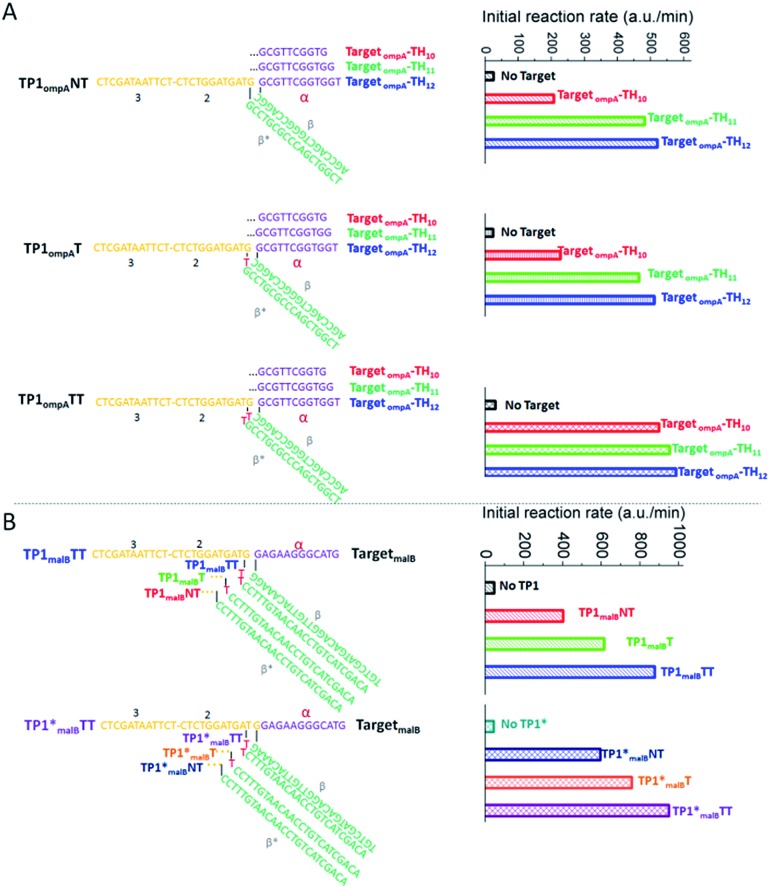
According to the above hints, we designed three TP sequences for TompA that separately contain two (TP1ompATT), one (TP1ompAT) or no (TP1ompANT) bulged thymidines at the TH-BM transition location (Fig. 3A). Meanwhile, we designed three TompA-derived targets with different lengths of domain α to ensure sufficiently strong toehold binding and efficiently fast dissociation. These were 10 nt (TompA_TH10), 11 nt (TompA_TH11), and 12 nt (TompA_TH12), respectively. The sequences of all the other components or domains were designed following the rules summarized in our previous studies,20,31 and kept constant for all the tests. For example, domain β was designed to be 18 nt to ensure stable hybridization of T and TP. Sequences of domain 2–3 in TP, H2, F, Q, and H1 (except domain α*) were directly taken from a well-behaved high-temperature CHA circuit (named CHA1) designed to detect the Zaire Ebolavirus gene.32 The CHA1 components here were named CHA1-H1ompA, CHA1-H2, CHA1-F, and CHA1-Q.
Fig. 3. Optimization of CHA efficiency based on strand displacement across a three-way junction. (A) Sequence design and initial reaction rates of CHA reactions using Ts with different bases in domain α, and using TPs with and without bulged thymidines. T was derived from TompA. 3W-CHA detector components added: CHA1-H1ompA, CHA1-H2, CHA1-F and CHA1-Q. (B) Sequence design and initial reaction rates of CHA reactions using TmalB and TPs with and without bulged thymidines, with and without one-base inter-domain bridging. 3W-CHA detector components added: CHA1-H1malB, CHA1-H2, CHA1-F and CHA1-Q.
Fig. 3A lists the initial CHA rates of the total twelve T and TP combinations, representing the reaction efficiencies. It suggests that the addition of bulged thymidines could indeed promote the 3W-CHA reaction. Especially for TP1ompATT, the addition of bulged thymidines always provided the largest promotion, no matter how long domain α was. As shown at the top of Fig. 3B, this conclusion was further verified when we changed the single-stranded mimic target TompA to an Enterobacteria gene (malB). The relevant sequences were easily designed via changing domain α* of CHA1-H1ompA and domain β* of TP according to TmalB. Even so, with the increase of toehold (domain α) length, the promotion induced by adding bulged thymidines became less and less obvious. Especially for the case using TompA, when domain α was as long as 12 nt, the promotion of the initial reaction rate was nearly negligible.
Besides the above optimization, we also explored another possibility that may drive 3W-CHA faster. It has recently been reported that inter-domain bridging43 arising from the translocation of one nucleotide from the BM domain (2–3 domain – 1 nt) to the TH (α domain + 1 nt) domain may sometimes relieve the distinct separation of domains and thus exhibit excellent performance in boosting strand displacement across a three-way junction. During our preliminary test (bottom of Fig. 3B), introducing one-base inter-domain bridging provided only slight promotion in the case of adding one or no bulged thymidines. No promotion was observed in the case of adding two bulged thymidines.
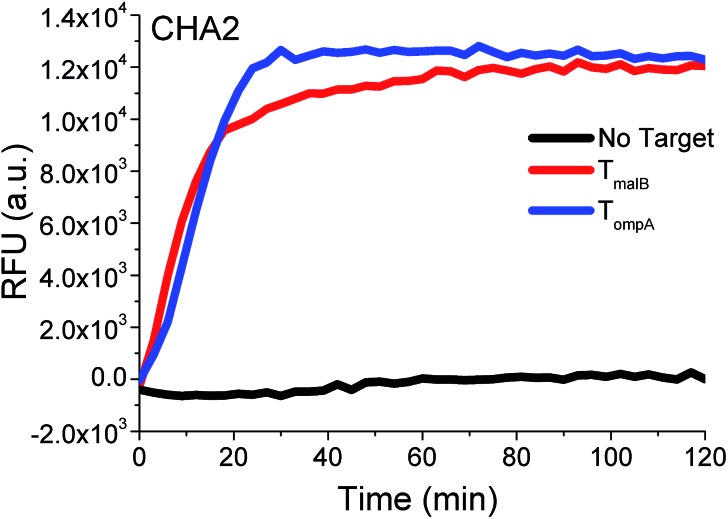
According to the above series of studies, it can be concluded that TH with 12 nt in domain α and TP with double-bulged thymidines may indeed increase the 3W-CHA reaction rate in most cases, functioning just like remote transduction in which a toehold-intermediated strand displacement reaction is induced across a linker and junction. Therefore, the rule according to this conclusion would be followed by all further experiments, also including those producing red and black kinetic curves shown in Fig. 2A and B. Immediate support for the generality of this rule is shown in Fig. 4, where the rule was applied to another circuit (called CHA2) to detect both TompA and TmalB. Both targets could produce fast 3W-CHA fluorescence signals with negligible background signals. Notably, we don’t encourage using inter-domain bridging because its promotion is not obvious and the design is more tricky and complex.
Fig. 4. Proof of universality using another set of CHA components (CHA2) to detect TmalB and TompA. For the detection of TompA, TP2ompATT and CHA2-H1ompA were used as TP and CHA2-H1. For the detection of TmalB, TP2malBTT and CHA2-H1malB were used as TP and CHA2-H1.
Coupling 3W-OSD or 3W-CHA to LAMP detection
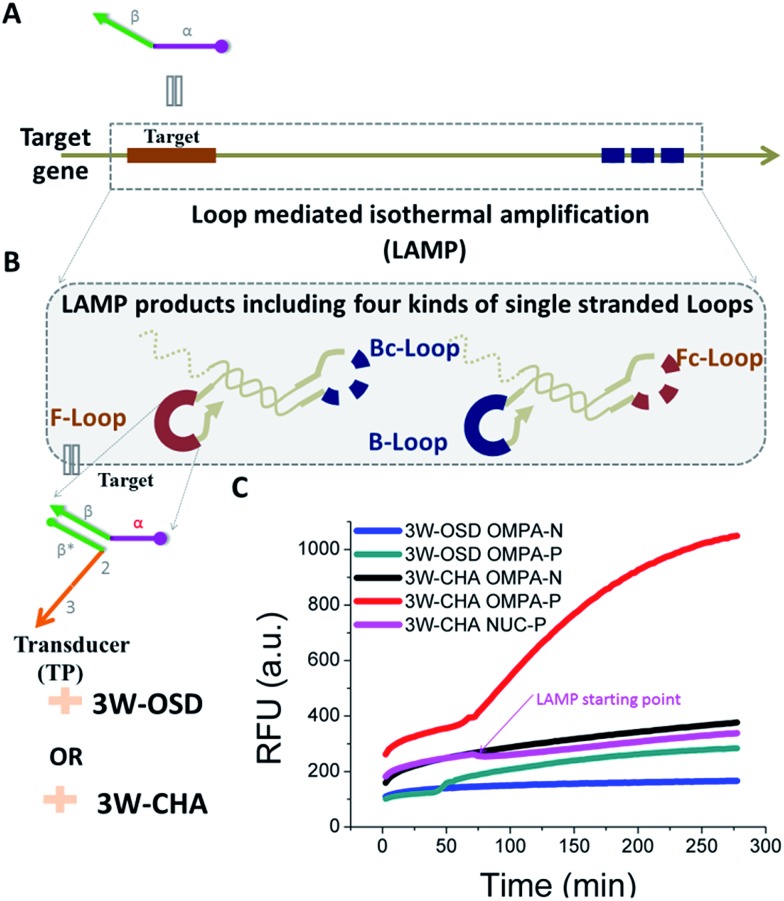
Through the above optimization, we have demonstrated a rule set via well-used 3W-CHA to detect single-stranded oligonucleotide targets. As a more applicable demonstration, we further tested the possibility of 3W-CHA to detect isothermal amplification for real-world gene targets. The LAMP reaction was selected as a model. In detail, 31 nt TompA was proposed as one of the loop sequences (Fig. 5A) among the LAMP amplicons amplified from the ompA gene. A LAMP primer set that could realize such a proposal was self-designed and pre-tested using electrophoresis (Fig. S2†). During the experiment, the LAMP primer set, TP1ompATT, and components of CHA1 (including CHA1-H1ompA, CHA1-H2, CHA1-F and CHA1-Q) were pre-mixed together (Fig. 5B), with or without the addition of the ompA synthetic gene template. Right after Bst 2.0 polymerase (Bst 2.0) was added, the process of LAMP-3W-CHA detection was initialized and monitored in real-time using a fluorescence plate reader. As shown in Fig. 5C, the reaction with 2000 copies of ompA started to show a climbing kinetic curve (in red) right after about 50 min, while the negative control sample always showed steady-state fluorescence (in black) throughout the 300 min detection window. This indicated that TP1ompATT could successfully bind with the TompA sequence embedded in the LAMP loop amplicons, thereafter forming a stable associative trigger to start 3W-CHA detection. In a parallel experiment, 3W-OSD detection was also proven to be functional for detecting LAMP amplicons, but with a lower signal amplitude (Fig. 5C, blue and green curves).
Fig. 5. Coupling 3W-OSD or 3W-CHA to isothermal gene detection. (A) Scheme of the target gene. (B) Schematic of using 3W-OSD detection or 3W-CHA detection to probe loop amplicons of the LAMP reaction for the target gene. (C) Comparison of real-time 3W-CHA detection with real-time 3W-OSD detection during the LAMP reaction, with and without 2000 copies of the ompA gene template. 3W-OSD detector components added: TPompATT, OSD-Acceptor, OSD-F and OSD-Q. 3W-CHA detector components added: TP1ompATT, CHA1-H1ompA, CHA1-H2, CHA1-F and CHA1-Q.
To further test the ability of the 3W-CHA detector to avoid false results, ompA and the primer set were replaced with those for the Staphylococcus aureus nuclease (nuc) gene. The results suggested that the massive LAMP amplicons of the nuc gene didn’t generate a false increase of fluorescence. The slight fluorescence decrease shown in the background curve (at about 100 min) resulted from the frustration that the polymerization side-products (e.g. ppi) made to FAM.
Besides functioning as a real-time detector during the LAMP reaction, 3W-CHA can also be added into the amplicons after the LAMP reaction has finished. The main advantages of the “end-point” reaction are that the detection doesn’t have to be executed at the high temperature required for running LAMP, and that the signalling technology can be more flexible, potentially extending to electrochemistry, colorimetry, and so on. As shown in Fig. S3,† using 3W-CHA as an end-point detector of LAMP displayed very similar sensitivity and efficiency to a real-time detector. LAMP amplicons amplified from as few as 20 copies of ompA were clearly recognized.
Multiplex and logic detection with the 3W-CHA detector
The realization of easy and rapid testing or even point-of-care detection depends not only on simple molecular design but also on portable signalling devices. The traditional methods that achieve multiplex or logic detection can generally be divided into two groups. One is one-tube multi-channel detection, in which multiple analytes are transduced into multiple signal probes with different color emissions or redox potentials.44,45 The other is multi-tube one-channel detection, in which the detection of each analyte proceeds in a separate tube. In this case one signal probe is enough to detect all of the analytes.46,47 Both methods involve high technical barriers to fabricating a portable or even off-the-shelf device. As previously demonstrated in Fig. 4, to detect any new target oligonucleotides we only have to change the sequences of domain α* of CHA1-H1 and domain β* of TP according to the new targets. In other words, the sequences and components labelled as critical to the detection efficiency remain unchanged. Based on this property, here we introduce the most brilliant advantage of the 3W-CHA detector, through which multiplex detection could potentially be executed in one tube, and with one signal channel.
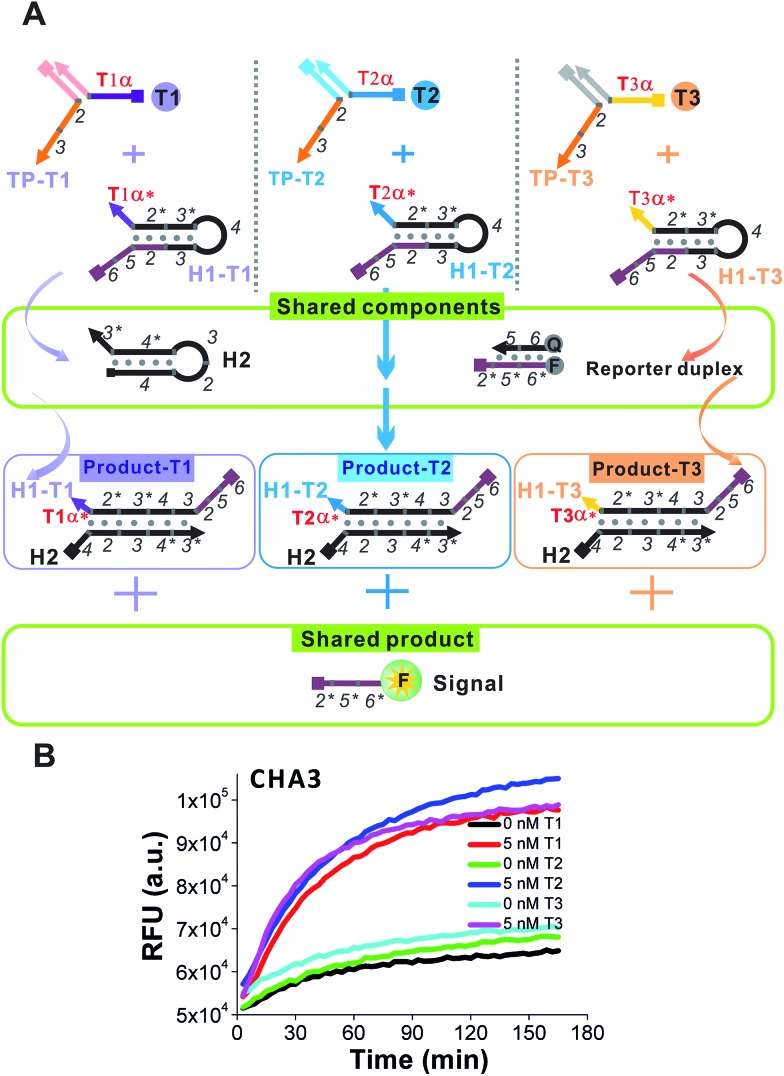
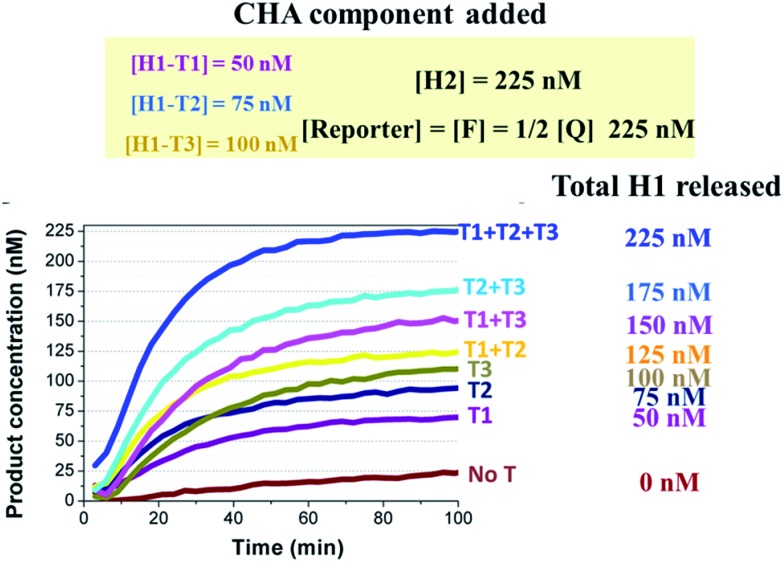
A proof-of-concept design for the triplex assay is shown in Fig. 6A. Three sequence-specific TPs (TP1, TP2 and TP3) and CHA H1s (H1-T1, H1-T2 and H1-T3) were designed for three different oligonucleotide target Ts (T1, T2 and T3), respectively, that were randomly designed and contained little sequence cross-talk with each other. Domains 2–3 of these three TPs were identical, which guaranteed that the three associated triggers (T1:TP1, T2:TP2 and T3:TP) could share the same H1 (except domain α*), H2 and reporter duplex (F and Q) in the following CHA detection. As shown in Fig. 6B, since the difference between T1:TP1, T2:TP2 and T3:TP3 was merely the domain α sequence, the CHA reactions triggered separately by each associative trigger could easily achieve almost triplet-like efficiencies. This is an important premise to realize multiplex detection. In our following multiplex scheme, multiple signal probes or multiple tubes were replaced by different concentrations of H1s for each different T. For example, the concentration of H1-T1 was 50 nM, whereas the concentration of H1-T2 was 75 nM and the concentration of H1-T3 was 100 nM. These H1s all share 225 nM H2 and 225 nM reporter duplex. Such a design allowed T1, T2 and T3 to release up to 50 nM, 75 nM and 100 nM of fluorescent FAM reporter, respectively, no matter how much of each T was added. Thereafter, recognition of the target in each of 8 situations (no target, T1, T2, T3, T1 + T2, T1 + T3, T2 + T3, and T1 + T2 + T3) can easily be realized via reading the plateau fluorescence (FAM concentration) released after 3W-CHA detection (Fig. 7). More quantitative data could be obtained after calculating the initial CHA reaction rate (Fig. S4†).
Fig. 6. (A) Design schematic for the principle of one-tube one-channel multi-analysis. (B) Demonstration of the triplet-like response of the 3W-CHA detector for each of three targets, T1, T2 or T3. For detection of each T1, TP1 and H1-T1 were used. For detection of each T2, TP2 and H1-T2 were used. For detection of each T3, TP3 and H1-T3 were used. For the other components of CHA, H2, F and Q were used for the detection of all three Ts.
Fig. 7. One-tube one-channel detection of T1, T2 and T3. The concentrations of H1 were different for each target. Therefore, the existence and type for no target, a single target, two targets, and three targets could be distinguished by reading the final steady-state fluorescence of the CHA reaction. Whenever present, the concentration of T1, T2 or T3 was 5 nM.
Note that in the above demonstration we adapted end-point 3W-CHA detection to function at 37 °C. Another CHA circuit (CHA3) was adapted and proven to function perfectly at 37 °C. The purpose was to display the temperature flexibility of the end-point strategy. We still added two bulged thymidines to the TPs. Meanwhile, the TH domain α* on each H1 was designed to be 10 nt. The purpose of doing so was to match the toehold binding energy with that of 12 nt from 55 °C to 60 °C.
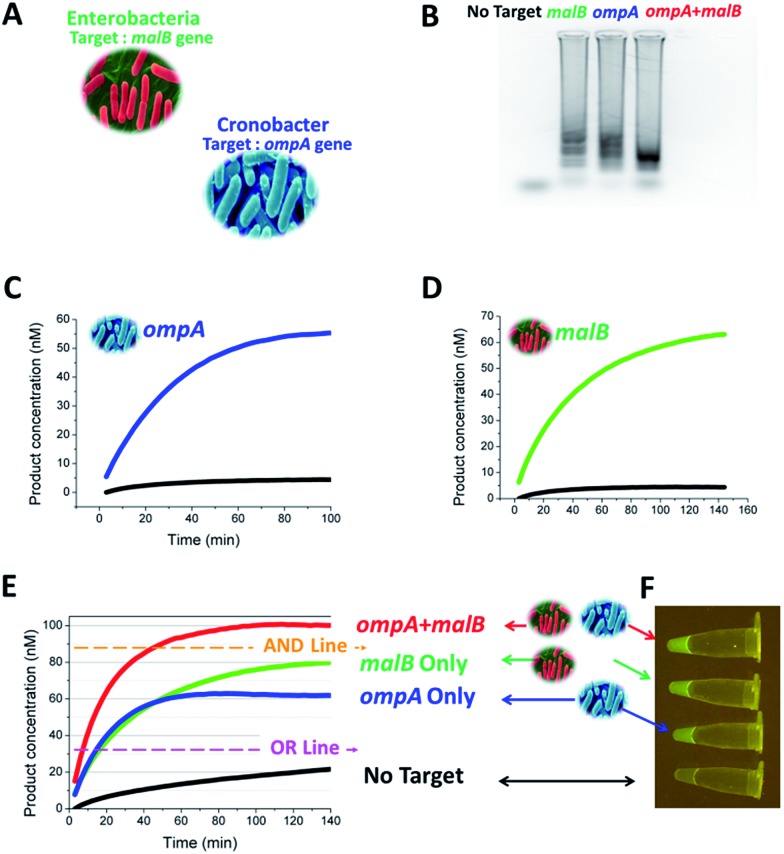
After the above proof-of-concept demonstration, we moved the end-point multiplex detection strategy forwards to the detection of ompA and malB genes (Fig. 8A). The TP and CHA component sequences used for the two genes were the same as those used in Fig. 4. As a prelude to mixing the LAMP and CHA ingredients, we verified the formation of appropriate LAMP amplicons from ompA and malB, separately, and from the mixture of ompA and malB, via agarose gel electrophoresis (Fig. 8B). After the LAMP reaction, the samples with or without the target genes were added into a probe mixture containing 40 nM CHA2-H1ompA and 60 nM CHA2-H1malB. The results of the single and multiplex assays are listed in Fig. 8C–E, respectively. In Fig. 8E, the plateau of the fluorescence curves can be used as a reference to judge the components of the target gene. The judgement could be also logical. For example, to recognize the existence of either ompA or malB, the fluorescence readout was set to be higher than the OR line but lower than the AND line, whereas to recognize the existence of both ompA and malB, the fluorescence readout should cross the threshold of the AND line. Therefore the detection could easily be defined as a Boolean OR gate or AND gate. From Fig. 8F, the results of the OR gate could even be recognized by the naked eye via observing the green color excited by the blue LED source. A portable device that can carry out this colorimetric detection has been home-built and is shown in Fig. S5.†
Fig. 8. One-tube one-channel detection of ompA and malB genes. (A) Sources of the ompA and malB genes. (B) Gel image of the LAMP amplicons amplified from no target, ompA, malB, and a mixture of both. (C) Responses of 3W-CHA to single ompA LAMP amplicons in (B). 3W-CHA detector components added: TP2ompATT, CHA2-H1ompA, CHA2-H2, CHA2-F and CHA2-Q. (D) Responses of 3W-CHA to single malB LAMP amplicons in (B). 3W-CHA detector components added: TP2malBTT, CHA2-H1malB, CHA2-H2, CHA2-F and CHA2-Q. (E) Multi-analysis responses of 3W-CHA to LAMP amplicons in (B). 3W-CHA detector components added: TP2ompATT, CHA2-H1ompA, TP2malBTT, CHA2-H1malB, CHA2-H2, CHA2-F and CHA2-Q. (F) Fluorescence images for the 3W-CHA reactions in (E) at 140 min.
Comparison between three types of universal transduction strategies
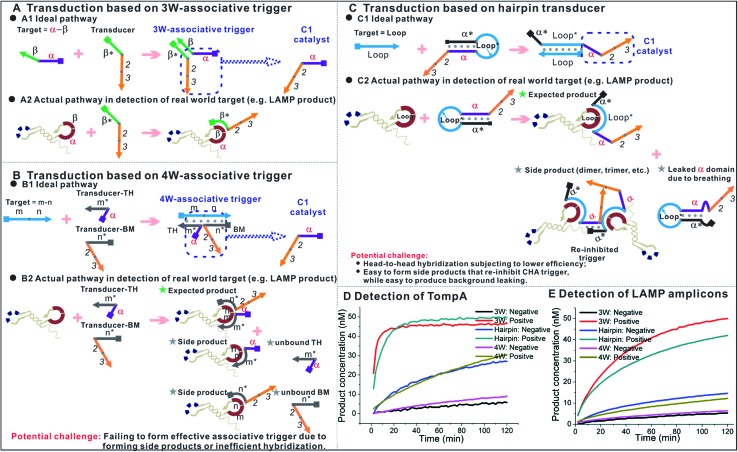
As a matter of fact, besides three-way junction-based transduction (Fig. 9A1), there are other strategies that could universally transduce different ssDNAs to OSD or nucleic acid circuit detection. For example, we have previously demonstrated that the OSD reaction across a four-way junction structure could also happen effectively, under optimized conditions.38,39 As shown in Fig. 9B1, in such a transduction, the TH domain (α) and BM domain (2–3) of an OSD trigger are separated into two transducers. Each transducer contains an extension (m* and n*, respectively) that can hybridize with partial sequences in the target ssDNA (m–n). Therefore, an effective OSD or CHA reaction can’t be activated unless the TH and BM domains are spatially organized by the target to form a four-way junction-based associative trigger (4W-associative trigger). In another example shown in Fig. 9C1,9 universal transduction could also be realized via building a hairpin transducer in which the TH domain (α) of the OSD trigger or CHA catalyst is blocked by the hairpin stem. The hairpin loop sequence (Loop*) is designed as the anti-sense of the ssDNA target (Loop). Upon binding with the target, the hairpin stem is opened and thus releases the TH domain and re-activates the trigger. For both examples shown in Fig. 9B1 and C1, the target sequence is completely non-relevant to the downstream OSD or CHA components, and the strategies seem to be more competitive than three-way junction-based transduction. Even so, it is hard to achieve one-tube one-channel multi-analysis with both strategies. In addition, they both show certain potential shortcomings in detecting real-world targets, such as the formation of side products shown in Fig. 9B2 and C2, and higher design barriers to achieving efficient signals (a detailed explanation is shown in the ESI†). Using the ompA gene as a model target, here we rationally design the hairpin transducer, transducer-TH and transducer-BM according to our previous optimization.9,39 The comparison between the three transduction strategies shows that the one using the 3W-associative trigger provides the highest signal-to-background ratio in response to the single-stranded LAMP loop mimic (TompA, Fig. 9D). Such a priority is even enlarged during the detection of real LAMP products amplified from the ompA gene (Fig. 9E). It demonstrates the higher practicability of the 3W-associative trigger in detecting real-world targets.
Fig. 9. Comparison between three types of universal transduction strategies. (A) Ideal pathway (A1) and actual pathway in the detection of isothermal amplicons (A2) using transduction based on a 3W-associative trigger. (B) Ideal pathway (B1) and actual pathway in the detection of isothermal amplicons (B2) using transduction based on a 4W-associative trigger. (C) Ideal pathway (C1) and actual pathway in the detection of isothermal amplicons (C2) using transduction based on a hairpin transducer. (D) and (E) Comparison between three types of universal transduction strategies using the ompA gene as a model target. (D) Detection of 0 nM (negative) and 20 nM (positive) LAMP loop mimic (TompA) using the three strategies. (E) Detection of LAMP products amplified from 0 copies (negative) and 2000 copies (positive) of the ompA gene using the three strategies. 3W, 4W and hairpin in the label represent the strategies using a 3W-associative trigger, 4W-associative trigger, and hairpin transducer, respectively. All the comparisons were done under the same buffer conditions and with the same concentrations of TP2ompATT, hairpin transducer, and transducer-TH (20 nM) at 55 °C. CHA components added: CHA2-H1ompA (for 3W-transduction), CHA2-H1 (for 4W- and hairpin transduction), CHA2-H2, CHA2-F and CHA2-Q.
Experimental
Materials
All the oligonucleotides were synthesized by Sangon Biotech (Shanghai, China), and the sequences are presented in ESI Table S1.† All the modified sequences were purified with high-pressure liquid chromatography and the unmodified sequences were purified with ultra-polyacrylamide gel electrophoresis. The concentrations of the sequences were determined by measuring the absorbance at 260 nm using a DeNovix DS-11+ FX spectrophotometer (DeNovix Inc., Wilmington, DE, USA). All the oligonucleotides were stored in H2O or 1 × TE (pH 7.5) at –20 °C. Bst 2.0 DNA polymerase and 10 × isothermal buffer (10 × Iso) were purchased from New England Biolabs (Ipswich, MA, U.S.A.). All reagents were of analytical grade unless otherwise indicated. Buffers used here were: 1 × TNaK (20 mM Tris–HCl, 140 mM NaCl, 5 mM KCl, pH 7.5, 5 mM Mg2+) and 1 × Iso (20 mM Tris–HCl, 10 mM (NH4) 2SO4, 50 mM KCl, 4 mM MgSO4, 0.1% Tween 20, pH 8.8).
One-step (3W-OSD) detection
In standard 3W-OSD detection, different concentrations of the target T (e.g. TompA) were hybridized with 100 nM TP (e.g. TPompATT) in 1 × TNak buffer via a standard annealing process, in which mixtures were heated at 95 °C for 5 min and cooled down to room temperature at a rate of 0.1 °C s–1. Note! This annealing process can be applied to all the other annealing steps mentioned in the following experiments. Then, the above mixtures were added to the OSD probe system containing a OSD-acceptor:OSD-F:OSD-Q complex pre-annealed in 1 × TNak buffer. The final concentrations of each component were as follows: [OSD-acceptor] = [OSD-F] = 1/2 [OSD-Q] = 50 nM, [TPompATT] = 100 nM. For fluorescence reading, 2 μM (dT)21 was also added to all of the reaction solutions to prevent loss due to adsorption to plastic. 17 μL of each reaction solution was recorded every 2 minutes at 55 °C on a Cytation™ 5 imaging multi-mode plate reader (Biotek, Winooski, U.S.A.).
Multi-step amplifier (3W-CHA) detection
In standard 3W-CHA detection, different concentrations of the target T were mixed with 80 nM TP in 1 × TNak buffer. Some of this mixture was further mixed with 200 nM H1, 800 nM H2, and 200 nM reporter duplex (containing 200 nM F and 400 nM Q) in 1 × TNak buffer in a 1 : 1 : 1 : 1 volume ratio. H1 and H2 were pre-annealed separately. The final concentrations of each component were as follows: [H1] = 1/4[H2] = [F] = 1/2[Q] = 50 nM, [TP] = 20 nM. For fluorescence reading, 2 μM (dT)21 was also added to all of the reaction solutions to prevent loss due to adsorption to plastic. 17 μL of each reaction solution was recorded every 3 minutes at 55 °C on a Cytation™ 5 imaging multi-mode plate reader (Biotek, Winooski, U.S.A.).
Standard LAMP reaction and gel electrophoresis
The primer mixture was prepared ahead, containing 5 μM each of B3 and F3 and 20 μM each of BIP and FIP. The reaction mixtures including 1 μL of different copies of the synthetic target genes, 4 μL of primer mixture, 5 μL of 4 mM dNTPs, 1 μL of 100 mM MgCl2 and 10 μL of 5 M betaine in a total volume of 50 μL of 1 × isothermal buffer (20 mM Tris–HCl, 10 mM (NH4) 2SO4, 10 mM KCl, 2 mM MgSO4, 0.1% Triton X-100, pH 8.8) were annealed to 95 °C for 2 min, followed by chilling on ice for another 2 min. Then 3 μL (8U) of Bst 2.0 DNA polymerase was added to the above mixtures to initiate the LAMP reactions. The reactions were incubated for 1.5 h at 55 °C, followed by heating to 80 °C for 20 min to denature the polymerase. Afterwards, the products were kept at 4 °C until they were analyzed by electrophoresis on 1% BBI LE agarose gel. Each well was loaded with 8 μL of the LAMP product and an additional 2 μL of 6 × orange loading dye (40% glycerol, 0.25% orange G). The electrophoresis gel was developed at 120 V for 20 min.
LAMP detection with 3W-CHA
Real-time LAMP-3W-CHA detection was prepared in almost the same manner as the standard LAMP reaction, with the exception that the TP (e.g. TP1ompATT) and CHA components (CHA1-H1ompA, CHA1-H2 and reporter F:Q duplex) were added to the reaction mixtures between the steps of primer annealing and addition of Bst 2.0 polymerase. The final reaction contained 50 nM CHA1ompA-H1, 200 nM CHA1-H2 and 50 nM reporter duplex (containing 50 nM CHA1-F and 100 nM CHA1-Q). Subsequently, 20 μL of the above reaction solutions were transferred into 0.2 mL tubes sitting in a COYOTE Mini-8 Portable Real-time PCR system (Coyote Bioscience, Inc., Beijing, China). Fluorescence signals were collected every 3 min at 55 °C. Note! For real-time LAMP detection the free 3′ end of all the TPs and CHA components were pre-labeled with inverted dT to avoid polymerase extension. End-point LAMP-3W-CHA detection was carried out in the same manner as standard 3W-CHA detection for an oligonucleotide (e.g. TompA), except that the oligonucleotide target was replaced by a LAMP amplicon.
Multiplex target detection
The procedure for proof-of-concept multiplex target detection at 37 °C was similar to that for standard 3W-CHA detection with a little modification. Different target Ts were annealed with the corresponding 20 nM TPs (T1 with TP1, T2 with TP2 and T3 with TP3) in the same tube in 1 × TNak buffer. Some of the mixtures were further mixed with H1 mix (200 nM H1-T1, 300 nM H1-T2 and 400 nM H1-T3), 900 nM H2, and 900 nM reporter duplex (containing 900 nM F and 1.8 μM Q) in 1 × TNak buffer in a 1 : 1 : 1 : 1 volume ratio. For fluorescence reading, 2 μM (dT)21 was also added to all of the reaction solutions to prevent loss due to adsorption to plastic. 17 μL of each reaction solution was recorded every 3 minutes at 55 °C on a Cytation™ 5 imaging multi-mode plate reader (Biotek, Winooski, U.S.A.).
Multiplex LAMP detection was conducted by mixing 4 μL of the ompA primers mixture and 4 μL of the malB primers mixture, seeding with 1 μL each of different DNA templates (other ingredients were used following the standard LAMP reaction). Some 8 μL of the 50 μL LAMP reaction was annealed with 0.8 μL of 500 nM TP2ompATT and 0.8 μL of 625 nM TP2malBTT. All of the above mixture was further mixed with 2.5 μL of H1 mix (containing 400 nM CHA2-H1ompA and 600 nM CHA2-H1malB), 2.5 μL of 1.6 μM CHA2-H2 and 2.5 μL of reporter duplex (containing 1 μM CHA2-F and 2 μM CHA2-Q) in isothermal buffer. For fluorescence reading, 17 μL of each reaction solution was recorded every 3 minutes at 55 °C in a COYOTE Mini-8 Portable Real-time PCR system (Coyote Bioscience, Inc., Beijing, China).
Conclusions
In conclusion, efficient isothermal amplification was integrated with a selective CHA signal amplification circuit through a simple three-way junction structure. This design has been developed as a universal and rational gene detection strategy to increase both the specificity and the convenience of isothermal amplicon detection. Furthermore, this method can discriminate allelic genes based on a single mismatch. As a distinguished advantage, multiplex targets can be detected through only one 3W-CHA reaction, with a single signal probe. Therefore, 3W-CHA can be regarded as a useful aid for nucleic acid detection, and is worthy to be modified for applications in real-world diagnostics. We are working towards using this universal detection strategy for evaluating other analogous biological targets, such as protein complexes and microRNA.
Conflicts of interest
There are no conflicts to declare.
Supplementary Material
Acknowledgments
This work was financially supported by the National Natural Science Foundation of China (21505129) and the Natural Science Foundation of Jilin Province (20160101296JC).
Footnotes
†Electronic supplementary information (ESI) available. See DOI: 10.1039/c7sc03190d
References
- Moore P. Nature. 2005;435:235–238. doi: 10.1038/435235a. [DOI] [PubMed] [Google Scholar]
- Khodakov D., Wang C., Zhang D. Y. Adv. Drug Delivery Rev. 2016;105:3–19. doi: 10.1016/j.addr.2016.04.005. [DOI] [PubMed] [Google Scholar]
- Compton J. Nature. 1991;350:91–92. doi: 10.1038/350091a0. [DOI] [PubMed] [Google Scholar]
- Liu D., Daubendiek S. L., Zillman M. A. J. Am. Chem. Soc. 1996;118:1587–1594. doi: 10.1021/ja952786k. [DOI] [PMC free article] [PubMed] [Google Scholar]
- Vincent M., Xu Y., Kong H. EMBO Rep. 2004;5:795–800. doi: 10.1038/sj.embor.7400200. [DOI] [PMC free article] [PubMed] [Google Scholar]
- Piepenburg O., Williams C. H., Stemple D. L. PLoS Biol. 2006;4:e204. doi: 10.1371/journal.pbio.0040204. [DOI] [PMC free article] [PubMed] [Google Scholar]
- Notomi T., Okayama H., Masubuchi H. Nucleic Acids Res. 2000;28:e63. doi: 10.1093/nar/28.12.e63. [DOI] [PMC free article] [PubMed] [Google Scholar]
- Paris D. H., Imwong M., Faiz A. M. Am. J. Trop. Med. Hyg. 2007;77:972–976. [PubMed] [Google Scholar]
- Li B., Chen X., Ellington A. D. Anal. Chem. 2012;84:8371–8377. doi: 10.1021/ac301944v. [DOI] [PMC free article] [PubMed] [Google Scholar]
- Kimura Y., de Hoon M. J., Aoki S. Nucleic Acids Res. 2011;39:e59. doi: 10.1093/nar/gkr041. [DOI] [PMC free article] [PubMed] [Google Scholar]
- Mori Y., Nagamine K., Tomita N. Biochem. Biophys. Res. Commun. 2001;289:150–154. doi: 10.1006/bbrc.2001.5921. [DOI] [PubMed] [Google Scholar]
- Tomita N., Mori Y., Kanda H. Nat. Protoc. 2008;3:877–882. doi: 10.1038/nprot.2008.57. [DOI] [PubMed] [Google Scholar]
- Goto M., Honda E., Ogura A. BioTechniques. 2009;46:167–172. doi: 10.2144/000113072. [DOI] [PubMed] [Google Scholar]
- Kouguchi Y., Fujiwara T., Teramoto M. Mol. Cell. Probes. 2010;24:190–195. doi: 10.1016/j.mcp.2010.03.001. [DOI] [PubMed] [Google Scholar]
- Tanner N. A., Zhang Y., Evans T. C. BioTechniques. 2012;53:81–89. doi: 10.2144/0000113902. [DOI] [PubMed] [Google Scholar]
- Hsieh K., Patterson A. S., Ferguson B. S. Angew. Chem. 2012;51:4896–4900. doi: 10.1002/anie.201109115. [DOI] [PMC free article] [PubMed] [Google Scholar]
- Jiang Y. S., Bhadra S., Li B. Anal. Chem. 2015;87:3314–3320. doi: 10.1021/ac504387c. [DOI] [PubMed] [Google Scholar]
- Du Y., Hughes R. A., Bhadra S. Sci. Rep. 2015;5:11039. doi: 10.1038/srep11039. [DOI] [PMC free article] [PubMed] [Google Scholar]
- Du Y., Pothukuchy A., Gollihar J. D. Angew. Chem. 2017;56:992–996. doi: 10.1002/anie.201609108. [DOI] [PMC free article] [PubMed] [Google Scholar]
- Li B., Ellington A. D., Chen X. Nucleic Acids Res. 2011;39:e110. doi: 10.1093/nar/gkr504. [DOI] [PMC free article] [PubMed] [Google Scholar]
- Zhang D. Y., Winfree E. J. Am. Chem. Soc. 2009;131:17303–17314. doi: 10.1021/ja906987s. [DOI] [PubMed] [Google Scholar]
- Liu J., Cao Z., Lu Y. Chem. Rev. 2009;109:1948–1998. doi: 10.1021/cr030183i. [DOI] [PMC free article] [PubMed] [Google Scholar]
- Yin P., Choi H. M., Calvert C. R. Nature. 2008;451:318–322. doi: 10.1038/nature06451. [DOI] [PubMed] [Google Scholar]
- Stojanovic M. N., Stefanovic D., Rudchenko S. Acc. Chem. Res. 2014;47:1845–1852. doi: 10.1021/ar5000538. [DOI] [PMC free article] [PubMed] [Google Scholar]
- Dirks R. M., Pierce N. A. Proc. Natl. Acad. Sci. U. S. A. 2004;101:15275–15278. doi: 10.1073/pnas.0407024101. [DOI] [PMC free article] [PubMed] [Google Scholar]
- Zhang D. Y., Turberfield A. J., Yurke B. Science. 2007;318:1121–1125. doi: 10.1126/science.1148532. [DOI] [PubMed] [Google Scholar]
- Jung C., Ellington A. D. Acc. Chem. Res. 2014;47:1825–1835. doi: 10.1021/ar500059c. [DOI] [PMC free article] [PubMed] [Google Scholar]
- Wang F., Lu C. H., Willner I. Chem. Rev. 2014;114:2881–2941. doi: 10.1021/cr400354z. [DOI] [PubMed] [Google Scholar]
- Xuan F., Hsing I. M. J. Am. Chem. Soc. 2014;136:9810–9813. doi: 10.1021/ja502904s. [DOI] [PubMed] [Google Scholar]
- Bhadra S., Ellington A. D. Nucleic Acids Res. 2014;42:e58. doi: 10.1093/nar/gku074. [DOI] [PMC free article] [PubMed] [Google Scholar]
- Jiang Y. S., Li B., Milligan J. N. J. Am. Chem. Soc. 2013;135:7430–7433. doi: 10.1021/ja4023978. [DOI] [PMC free article] [PubMed] [Google Scholar]
- Zhu Z., Tang Y., Jiang Y. S. Sci. Rep. 2016;6:36605. doi: 10.1038/srep36605. [DOI] [PMC free article] [PubMed] [Google Scholar]
- Genot A. J., Zhang D. Y., Bath J. J. Am. Chem. Soc. 2011;133:2177–2182. doi: 10.1021/ja1073239. [DOI] [PubMed] [Google Scholar]
- Zhao Y., Qi L., Chen F. Biosens. Bioelectron. 2013;41:764–770. doi: 10.1016/j.bios.2012.10.009. [DOI] [PubMed] [Google Scholar]
- Chen X. J. Am. Chem. Soc. 2012;134:263–271. doi: 10.1021/ja206690a. [DOI] [PMC free article] [PubMed] [Google Scholar]
- Wang M., Mao Z., Kang T. S. Chem. Sci. 2016;7:2516–2523. doi: 10.1039/c6sc00001k. [DOI] [PMC free article] [PubMed] [Google Scholar]
- Zhu J., Wang L., Xu X. Anal. Chem. 2016;88:3817–3825. doi: 10.1021/acs.analchem.5b04889. [DOI] [PubMed] [Google Scholar]
- Tang Y., Zhu Z., Lu B. Chem. Commun. 2016;52:13043–13046. doi: 10.1039/c6cc07153h. [DOI] [PubMed] [Google Scholar]
- Li B., Jiang Y., Chen X. J. Am. Chem. Soc. 2012;134:13918–13921. doi: 10.1021/ja300984b. [DOI] [PMC free article] [PubMed] [Google Scholar]
- Leontis N. B., Kwok W., Newman J. S. Nucleic Acids Res. 1991;19:759–766. doi: 10.1093/nar/19.4.759. [DOI] [PMC free article] [PubMed] [Google Scholar]
- van Buuren B. N., Overmars F. J., Ippel J. H. J. Mol. Biol. 2000;304:371–383. doi: 10.1006/jmbi.2000.4224. [DOI] [PubMed] [Google Scholar]
- Wu B., Girard F., van Buuren B. Nucleic Acids Res. 2004;32:3228–3239. doi: 10.1093/nar/gkh645. [DOI] [PMC free article] [PubMed] [Google Scholar]
- Ang Y. S., Tong R., Yung L. Y. Nucleic Acids Res. 2016;44:e121. doi: 10.1093/nar/gkw447. [DOI] [PMC free article] [PubMed] [Google Scholar]
- Xu Y., Liu Y., Wu Y. Anal. Chem. 2014;86:5611–5614. doi: 10.1021/ac5010458. [DOI] [PubMed] [Google Scholar]
- Liu Y., Wei M., Li Y. Anal. Chem. 2017;89:3430–3436. doi: 10.1021/acs.analchem.6b04176. [DOI] [PubMed] [Google Scholar]
- Fang X., Chen H., Yu S. Anal. Chem. 2011;83:690–695. doi: 10.1021/ac102858j. [DOI] [PubMed] [Google Scholar]
- Soe M. J., Rohde M., Mikkelsen J. Clin. Chem. 2013;59:436–439. doi: 10.1373/clinchem.2012.193664. [DOI] [PubMed] [Google Scholar]
Associated Data
This section collects any data citations, data availability statements, or supplementary materials included in this article.


