

ABSTRACT
The difference in the adult height of mammals, and hence in endochondral bone formation, is not yet fully understood and may serve to identify targets for bone and cartilage regeneration. In line with this hypothesis, the intra‐species disparity between the adult height of Great Danes and Miniature Poodles was investigated at a transcriptional level. Microarray analysis of the growth plate of five Great Danes and five Miniature Poodles revealed 2,981 unique genes that were differentially expressed, including many genes with an unknown role in skeletal development. A signaling pathway impact analysis indicated activation of the cell cycle, extracellular matrix receptor interaction and the tight junction pathway, and inhibition of pathways associated with inflammation and the complement cascade. In additional validation steps, the gene expression profile of the separate growth plate zones for both dog breeds were determined. Given that the BMP signaling is known for its crucial role in skeletal development and fracture healing, and BMP‐2 is used in orthopaedic and spine procedures for bone augmentation, further investigations concentrated on the BMP pathway.The canonical BMP‐2 and BMP‐6 signaling pathway was activated in the Great Danes compared to Miniature Poodles. In conclusion, investigating the differential expression of genes involved in endochondral bone formation in small and large breed dogs, could be a game changing strategy to provide new insights in growth plate development and identify new targets for bone and cartilage regeneration. © 2017 The Authors. Journal of Orthopaedic Research® published by Wiley Periodicals, Inc. on behalf of the Orthopaedic Research Society. J Orthop Res 36:138–148, 2018.
Keywords: canine, growth plate, endochondral bone formation, microarray, BMP pathway
Longitudinal growth is the result of endochondral bone formation in the growth plate of long bones. The growth plate is divided into three zones: the reserve, proliferative, and hypertrophic zone. In the latter, chondrocytes stop proliferating, increase in volume, and eventually undergo apoptosis or trans‐differentiation in order to become osteoblasts. The mechanisms underlying endochondral bone formation are tightly regulated by systemic and local factors and determine the growth rate and closure of the growth plate during puberty, resulting in an adult height that is different for each individual.1
The orchestrated process of endochondral bone formation at the growth plate level has been extensively studied, not only to provide insight into the regulation of longitudinal bone formation, but also to study fracture healing.2 Even more so, it is considered a model to develop new regenerative strategies3, 4 addressing large bone defects.5 As intramembranous bone formation is often not successful in the regeneration of these defects due to inadequate blood supply, these defects might profit from secondary bone formation, as chondrocytes can withstand the low oxygen tension.4 Thus far, mutations that cause dysregulation of endochondral bone formation have given insights in the main endocrine and local regulators,6 including the endocrine regulators growth hormone (GH) and insulin‐like growth factor (IGF) but also the local indian hedgehog (IHH)/parathyroid hormone related peptide (PTHrP) and the bone morphogenetic protein (BMP) pathway.
A game changer that can provide insight into the regulation of endochondral bone formation, is the study of variation in adult height. Height is a highly heritable trait.7 A recent meta‐analysis of over 50 genome wide association studies (GWAS) involving more than 180,000 individuals (GIANT GWAS) identified more than 180 loci associated with adult height explaining as little as 10–15% of the heritability of height in humans.8 Thus, a large part of the heritable factors that contribute to adult height are not accounted for by the SNP based GWAS. A part of this heritability could be explained by non‐DNA sequence‐linked information, for example, by the epigenetic heredity of DNA methylation.9 In addition, other innovative approaches have been employed where genes related to the regulation of endochondral bone formation have also been identified by comparing human GWAS studies with the spatial and temporal gene expression pattern of postnatal rats.10
In this study, dogs (Canis lupus familiaris) were chosen because of the extreme intra‐species differences in adult height, for example, compare Chihuahuas and Great Danes with an average shoulder height of 20 and 75 cm, respectively. In addition, the canine growth plate resembles that of humans11; it closes with puberty, as opposed to small rodents. In addition, the development of specific breed standards has resulted in small populations selected on specific size related traits.12 Furthermore, we have shown that signaling pathways related to bone growth are differentially expressed in small and large breed dogs at the growth plate level13 and may facilitate the pace of bone formation.
The overall aim of this study was to investigate the differential expressed (DE) genes involved in endochondral bone formation of small and large breed dogs in order to provide insights in the regulation of longitudinal bone formation and to identify novel bone and cartilage regenerative strategies. For this purpose, microarray analysis of the whole growth plate of Great Danes (a large breed dog) and of Miniature Poodles (a small breed dog) was employed. In addition, given that BMP signaling is well known for its important regulatory function during postnatal growth14 and fracture healing, we investigated the differential expression of the BMP‐pathway in the growth plates of small‐ and large‐breed dogs.
MATERIALS AND METHODS
Animals
Tissue was obtained from animals used in in vivo experiments described previously.15 All procedures were approved by the Utrecht University Ethics Committee for Animal Care and Use. In this study, five Great Danes (median body weight 24.9 ± 2.4 kg) and five Miniature Poodles (median body weight 3.5 ± 0.7 kg) were raised until the age of 21 weeks on a balanced diet.
Collection and Processing of Tissue Samples
After 21 weeks, dogs were euthanized and the growth plate and adjacent metaphysis (1 mm) of the 8th rib were collected, immediately frozen in liquid nitrogen, and stored at −70°C until further processing. In this way, each sample contained all the phases of endochondral bone formation. A single costal growth plate is responsible for longitudinal growth and its closure is an important indicator of skeletal maturity.16 In addition, the morphology and morphometry of the rib growth plate is similar to other rapidly growing growth plates.17 At 21 weeks, both breeds are at the same developmental stage, based on ossification of the secondary ossification centers.15 Histological characteristics of the growth plate of this subset of dogs were consistent with the growth plate characteristics described earlier in Tryfonidou et al.13 In the growth plate of the Great Dane, the relative ratio of the hypertrophic zone compared to the total growth plate width was significantly larger (38.3% ± 4.3) compared to the Miniature Poodle (29.4% ± 2.2) while the relative ratio of the proliferative zone was significantly smaller in the Great Danes (61.7% ± 4.7) compared to the Miniature Poodles (70.6% ± 2.2).
Tissue samples were grinded in pre‐cooled cups of a micro‐dismembrator (Micro‐Dismembrator U, B. Braun Biotech International, Melsungen, Germany), using two cycles of 2,200 rpm for 45 s. Total RNA was isolated with the RNeasy Mini Kit (Qiagen, 74104, Venlo, the Netherlands) including on‐column DNase‐I treatment (Qiagen, 74104). Total RNA was quantified spectrophotometrically (Nanodrop ND‐1000, Isogen Life Science, De Meern, the Netherlands). RNA integrity number values ranged between 7.2 and 9.8 (RNA 6000 nano assay; 2100 Bioanalyzer, Agilent Technologies Netherlands B.V, Amstelveen, the Netherlands).
Gene Expression Profiling With a Two‐Color Microarray on Whole Growth Plate Tissue
A two‐color microarray with a reference design experiment was performed with 44k Canine Gene Expression Microarrays V1 (G2519F, Agilent Technologies Netherlands B.V.). RNA amplification and labeling were performed18 on an automated system (Caliper Life Sciences, Waltham, MA) with 3 μg total RNA from each sample. Hybridization was performed on an HS4800PRO system supplemented with QuadChambers (Tecan Benelux B.V.B.A., Giessen, the Netherlands), using 500–1000 ng labeled cRNA per channel.19 One half of the RNA was labeled with cy5 against cy3 labeled common reference RNA on dual‐channel arrays; the second half was analyzed in dye swap. The RNA common reference pool, used as a mathematical intermediate between Great Danes and Miniature Poodles, consisted of RNA from different canine organs, such as liver, spleen, kidney, lung, heart, intestine, and bone.
Hybridized slides were scanned on an Agilent scanner (G2565BA) at 100% laser power, 30% photo multiplier tube (PMT) detector voltage. After automated data extraction using Imagene 8.0 (BioDiscovery, El Segundo, CA), Loess normalization was performed20 on mean spot intensities. Dye bias was corrected based on a within‐set estimate.21 This resulted in normalized red and green values that were used as input for further analysis of the DE‐genes from the growth plates of Great Danes and Miniature Poodles, using the LIMMA22 package for R 2.15.2. DE‐ genes with a cut‐off difference in expression of 1.3 and p < 0.05 after Benjamini Hochberg correction were used in further analyses. When multiple probes annotated the same gene, the probe that showed the highest significant difference was used. The probes that were not annotated against the ENSEMBL CanFam3.1v70 genome build were excluded from further analysis. The data has been deposited in NCBI's Gene Expression Omnibus and is freely accessible through GEO Series accession number GSE53277.
Validation of the Microarray by Quantitative PCR
The micro array data was validated by RT‐qPCR of the whole growth plate tissue samples employed in the microarray (n = 5 per group) and on the separate growth plate zones separated by dissection as described by Nilsson et al.14
Briefly, 50 µm thick midsagittal cryosections of the costal growth plate and adjacent bone were mounted on Microscope KP+ slides (KP‐3056, Klinipath B.V., Duiven, the Netherlands) and stored at −70°C until further processing. After 15 s of thawing, sections were dehydrated in ice cold 70% ethanol for 30 s, followed by 95% ethanol for 30 s, counterstained with Hematoxylin followed by two times 5 s washing in ice‐cold Diethylpyrocarbonate (DEPC)‐treated Milli‐Q water. Cryosections were dehydrated again in ice‐cold 70% ethanol for 30 s and subsequently in ice‐cold 100% ethanol for 30 s. Thereafter, cryosections were submerged in fresh xylene at room temperature. Within 90 min, six to seven midsagital sections were dissected under a stereoscope. After discarding the perichondrium, the primary spongiosa was dissected and collected (Bone), followed by the hypertrophic zone (HZ), the proliferative zone (PZ), and the reserve zone (RZ) of the growth plate without discarding tissue. The growth plate zones were dissected based on histological hallmarks. In addition, the HZ was distinguished from the PZ based on representative collagen type X immunostaining for each donor.
Mean total RNA varied between zones and in Miniature Poodles versus Great Danes, being, respectively, 934 and 1,935 ng for the RZ; 2,145 and 4,448 ng for the PZ, 1,200 and 2,681 ng for the HZ, and 8,164 and 15,375 ng for Bone. The mean RIN value was 7.1 (range 6.5–8.3).
cDNA synthesis was performed using iScript (BioRad, Veenendaal, the Netherlands) according to standard operation protocols with random hexamer and oligo‐dT primers. The primers were designed with PerlPrimer v1.1.21 software (http://perlprimer.sourceforge.net/) and were based on sequences that are available in public databases (www.ensembl.org or www.ncbi.nlm.nih.gov). For each target the optimal, Tm was obtained using a gradient RT‐qPCR, and the formed amplicons were checked using gel electrophoresis and sequencing analysis for correct size and sequence respectively. Quantitative PCR was performed using a MyIQ real‐time PCR detection system and IQ SYBR Green SuperMix (both from Bio‐Rad) according to the manufacturer's protocols. Standard curves consisted of fourfold serial dilutions of the cDNA template and were prepared by plotting the log of the starting amount versus the threshold cycle. For each standard curve, the amplification efficiency was between 90% and 110%. To normalize expression and the amount of the template, the expression of three reference genes, hypoxanthine guanine phosphoribosyl transferase (HPRT), glyceraldehyde‐3‐phosphate dehydrogenase (GAPDH), and ribosomal protein S19 (RPS19), was determined for each experimental sample (Supplementary file S1). The normalized gene expression is displayed in the figures as the relative gene expression of that sample compared to the mean Ct value of all samples. Hereby, relative expression of all transcripts regardless of the gene is illustrated.
Signaling Pathway Impact Analysis (SPIA) and Statistical Analysis
The canine Ensembl IDs were converted to their human homologue Entrez IDs and a SPIA was performed using R 2.15.2.23 The efficiency corrected CT method was used to calculate relative gene expression.24 Statistical comparisons of the CT values of the different groups were performed using a Student's t‐test (normally distributed data) or nonparametric Mann–Whitney U‐test. For the RT‐qPCR of the dissected zones the available sample number was limited (n = 3 and n = 4 per zone for GD an MP, respectively). Therefore, in order to obtain a normal distribution, the Ct values were calculated using log transformed Ct values. Subsequently, a linear model was build, employing “zone” or “breed” as a fixed effect for the comparison within each breed and within each growth plate zone, respectively (lme4 v1.1‐12).25 Comparisons between all zones within one breed were evaluated using a general linear hypothesis and Turkey's all pair comparisons (multcomp v1.4‐6).26 Only the significant differences showing a fold change of >2 were regarded as biologically relevant.
Western Blot
In order to validate the differential expression of the BMP pathway on a functional level the protein phosphorylation of SMAD 2, SMAD3, and SMAD 1/5 was investigated using Western blot. Total protein was extracted from tissue samples (five Miniature Poodles and five Great Danes), grinded as described earlier, using radioimmunoprecipitation assay (RIPA) buffer containing Phenylmethylsulfonyl fluoride (PMSF, 1 mM, 93482, Sigma‐Aldrich Chemie N.V., Zwijndrecht, the Netherlands) and Aprotinin (1 μg/ml A6279, Sigma) in order to inhibit proteases and activated Sodium Orthovanadate (Na3VO4, 1 mM, 450243, Sigma) in order to inhibit phosphatases. Protein concentrations were assessed using the DC Protein Assay from Bio‐rad Laboratories (Cat # 500‐0116, Bio‐rad) according to the manufacturers protocol. Each sample was 1:1 diluted in buffer solution containing 10% SDS (51213, Lonza Benelux B.V., Breda, the Netherlands), 0.5 M Tris–HCL, 0.05% bromophenolblue, 20% glycerol (7757, Sigma G), and DL‐Dithiothreitol (DTT, D0632, Sigma–Aldrich) and subsequently 15 μg of protein was loaded per lane. Proteins were fractionated by electrophoresis using a Criterion TGX precast Gel (5671024, Bio‐Rad Laboratories GmBH, München, Germany.) and electroblotted on a Nitrocellulose Membrane (9004‐70‐0, Bio‐Rad Laboratories, Inc. Germany). After blocking with ECl Blocking Agent (4%, RPN2125, GE Healthcare, Hoevelaken, the Netherlands) dissolved in Tris‐buffered saline containing 0.1% Tween20 (TBST0.1) for 60 min, the membrane was incubated overnight at 4°C with the primary antibody against Phospho‐Smad1/Smad5 (#9511, Cell signalling, Danvers, MA, 1:500 in 4% BSA in TBST0.1), Phospho‐Smad2 (#3101, Cell signaling, 1:500 in 4% BSA in TBST0.1), Phospho‐Smad3 (#9530, Cell signaling, 1:500 in 4% BSA in TBST0.1). Subsequently, membranes were washed with TBST0.1 and incubated for 60 min at room temperature with a HRP‐conjugated secondary anti‐rabbit (R&D Systems, Minneapolis, MN, USA, 1:20.000 in TBST0.1) (or anti‐mouse [HAF007, RD, 1:20.000 in TBST0.1]) antibody, depending on the primary antibody. Protein expression was detected using the ECL Advanced Western Blotting Kit (Amersham RPN2135, GE Healthcare) in a ChemiDoc XRS System (Bio‐Rad Laboratories, Veenendaal, the Netherlands). Image Lab software (Bio‐rad) was used to obtain the images and compute the integrated densities. Thereafter, the membrane was stripped using Pierce Restore Western Blot stripping Buffer (Rockford, IL, USA) and incubated overnight at 4°C with actin antibody (pan‐Ab5, Neomarkers LabVision Corp, Fremont, CA, 1:2,000 in 4% BSA in TBST0.1). The integrated densities of target proteins (Phospho‐Smad‐1/5,‐2, and ‐3) were corrected for the integrated density of actin in the corresponding sample.
The different integrated densities between the Great Dane and Miniature Poodle samples were considered significant if p < 0.05, using the Student's t‐test as described before.
RESULTS
Microarray
Inherent to the study design, the cRNA profiles of Great Danes (n = 5) and Miniature Poodles (n = 5) were different, indicating that the growth plates had a different composition in the two breeds. This can be explained by morphological differences of the growth plate: The growth plate of Great Danes had a larger hypertrophic zone and a relatively larger proliferation zone than the growth plate of Miniature Poodles.13 Expression analysis revealed 4,764 DE‐probes in the two breeds. mRNAs that are very abundant in one of the breeds can cause specific RNA peaks to show up in the size distribution of the cRNA profiles (Supplementary file S2).
Annotation against the ENSEMBL CanFam3.1v70 genome build identified 3,523 unique DE‐probes, representing 2,981 unique DE‐genes, of which 1,202 were up‐regulated, and 1,779 were down‐regulated in Great Danes compared with Miniature Poodles (Fig. 1). Among the 50, most significant up‐regulated genes (Supplementary file S3) were genes that regulate chondrocyte differentiation and influence pathways that are associated with skeletal development, including SOX9 and cartilage oligomeric matrix protein (COMP). Among the DE‐genes that were down‐regulated (Supplementary file S3), many were for calcium binding proteins (S100A8, S100A9, and S100A12), which are associated with osteoblast differentiation and calcification of the cartilage matrix,27 or for blood‐related genes, such as hemoglobin subunit A.
Figure 1.
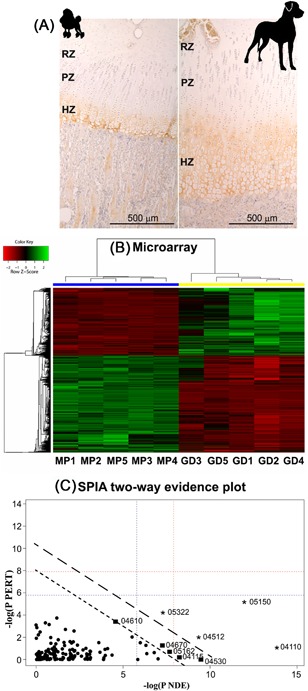
Microarray analysis design. (A) Representative histological images of the growth plate of the Miniature Poodle and the Great Dane. Collagen type X immunostaining distinguishes the reserve and proliferative (RZ and PZ, respectively) from the hypertrophic zone (HZ). (B) The microarray heat map shows genes that were up‐regulated (green) and down‐regulated (red) in Great Danes relative to Miniature Poodles and was normalized by centring the mean for every gene. Clustering of the genes is displayed by the lines on the left side. On the upper side clustering of the canine samples is shown for the Great Danes (GD, yellow) and Miniature Poodles (MP, blue). (C) Signaling pathway impact analysis (SPIA) two‐way evidence plot. The global probability value is calculated by combining the probability value of the number of differentially expressed (DE) genes in the pathway (NDE) and the probability value (pPERT) of the total perturbation accumulation in the pathway. The ‐log (pNDE) and ‐log (pPERT) are plotted against each other. The uninterrupted lines are the thresholds (long = p < 0.01, short = p < 0.05). The dots with corresponding identity numbers indicate the pathways investigated in the microarray analysis as described in Table 1.
Validation of the Microarray With RT‐qPCR
The 10 DE‐genes with the greatest between‐breed difference in expression in the growth plate tissue revealed greater differences with RT‐qPCR than with semi‐quantitative microarray analysis (Fig. 2, n = 5 per group). The microarray data is influenced by the histomorphometric differences between the growth plate of Great Danes and Miniature poodles, that is, the HZ is relatively and absolutely larger in Great Danes compared with Miniature Poodles. As such the differences found in the microarray analysis employing whole growth plate tissue could be also due to the presence of a relatively higher number of hypertrophic chondrocytes in the RNA pool of Great Danes compared with Miniature Poodles. In order to investigate this aspect, additional validation steps were undertaken and the gene expression profile of the separate growth plate zones was determined for both dog breeds.
Figure 2.
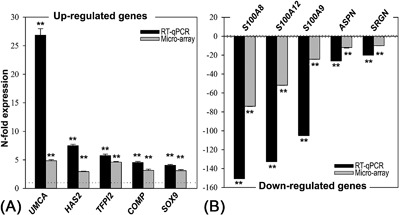
RT‐qPCR validation of the microarray analysis from the top five up‐regulated (A) and down‐regulated (B) genes. Relative gene expression in Great Danes is given in black bars (RT‐qPCR) and gray bars (microarray) as mean ± SD. Data for Miniature Poodles are set as 1 and −1 for every gene (dotted line); Significant differential regulation of the Great Dane compared with the Miniature Poodle is given (**p < 0.01).
As a first step, proper dissection of the growth plate zones (Fig. 3) was confirmed with the aid of gene expression profiles of the markers for the state of differentiation of the chondrocytes. PTHrP, a RZ marker,28 was highest expressed in the RZ, being 27‐ and 115‐fold higher expressed in the RZ versus PZ and HZ, respectively in both dog breeds. Similarly, Secreted frizzled‐related protein 5 (SFRP5), also a RZ marker,29 was 900‐fold higher expressed in the RZ versus HZ in both dog breeds. Growth differentiation factor 10 (GDF‐10), a PZ marker, was significantly higher expressed in the PZ in both dog breeds. PTHR1 and IHH, genes primarily expressed in the preHZ zone and in early hypertrophic chondrocytes of the postnatal growth plate,30 were significantly higher expressed in the PZ compared with all other growth plate zones in both MP and GD, confirming that the transitional preHZ zone was included in the PZ samples.28 The latter is further supported by the significantly higher alkaline phosphatase (ALP) in the PZ compared with the RZ. Furthermore, proper dissection of the HZ was supported by the significantly higher expressed IHH and Collagen X in the HZ compared with the RZ and Bone.14, 28
Figure 3.

Validation of the dissection of the growth plates by RT‐qPCR. Relative gene expression in Miniature Poodles (MP, black bars) and Great Danes (GD, gray bars) is given for the reserve (RZ), proliferative (PZ), and hypertrophic zone (HZ), and for Bone as mean ± SD. For each dog breed, the significant differences (p < 0.05) between growth plate zones are indicated.
The five up‐ and down‐regulated DE‐genes as defined from the microarray were also determined for both dog breeds for the RZ, PZ, HZ, and Bone (Fig. 4). From the top five up‐regulated DE‐genes, the upper zone of growth plate and cartilage matrix associated gene (UCMA), hyaluronan synthase 2 (HAS2), and tuftelin interacting protein 2 (TFIP2) were significantly higher in Great Danes compared with Miniature Poodles. However, COMP and SOX9, were significantly lower in Great Danes compared with Miniature Poodles in the RZ and PZ, contradicting the findings from the microarray analysis. From the top five down‐regulated DE‐genes all but Serglycin (SRGN) were significantly lower in Great Danes compared with Miniature Poodles, in line with the microarray analysis.
Figure 4.
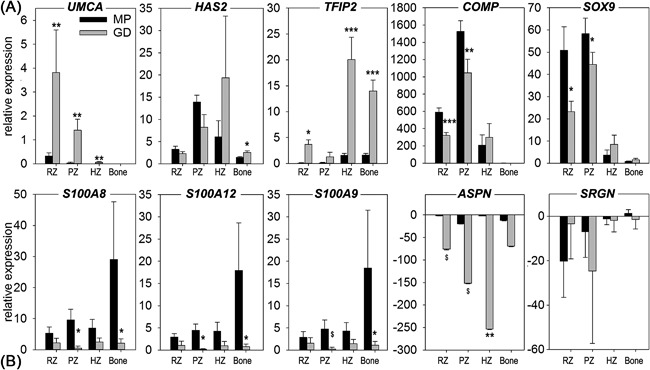
Validation of the top five up‐ and down‐regulated genes in the dissected growth plates by RT‐qPCR. Relative gene expression in Miniature Poodles (MP, black bars) and Great Danes (GD, gray bars) is given for the reserve (RZ), proliferative (PZ), and hypertrophic zone (HZ) and for Bone as mean ± SD. For ASPN and SRGN, the downregulation is expressed in negative numbers (employing the formula −1/relative expression), due to limited expression in relation to other transcripts. $ p = 0.05–0.1; *p < 0.05; **p < 0.01; ***p < 0.001 indicate significant difference between dog breeds within the same growth plate zone or bone.
Signaling Pathway Impact Analysis
SPIA identified several enriched Kyoto Encyclopaedia of Genes and Genomes (KEGG) pathways (Fig. 1, Table 1). An advantage of SPIA is that this analysis calculates which pathways are significantly up‐regulated, by combining the over‐representation of DE‐genes in a certain pathway with the effect of changes in the expression of these genes on the perturbation of the pathway, thereby incorporating pathway topology.23 In Great Danes relative to Miniature Poodles, there was activation of pathways associated with enhanced cell proliferation and matrix production by the different members of the cyclin protein family; activation of extracellular matrix–receptor interactions, with up‐regulation of many collagen, integrin, and laminin genes; activation of the tight‐junction pathway; and activation of the p53 pathway.
Table 1.
Signaling Pathway Impact Analysis (SPIA) of the Microarray
| Name | Gene ontology biological process | ID | pSize | NDE | pNDE | tA | pPERT | pG | pGFdr | Status |
|---|---|---|---|---|---|---|---|---|---|---|
| Staphylococcus aureus infection | Complement activation, protein activation cascade, humoral immune response | 5,150 | 31 | 18 | 0 | −19.384 | 0.006 | 0 | 0 | ↓ |
| Cell cycle | Multiple processes related to cell cycle including DNA‐dependent DNA replication, spindle assembly checkpoint, and others | 4,110 | 105 | 44 | 0 | 8.582 | 0.339 | 0 | 0 | ↑ |
| Systemic lupus erythematosus | Negative regulation of transcription of nuclear large rRNA transcript from RNA polymerase I promoter, (activation of) immune respons | 5,322 | 54 | 22 | 0.001 | −8.322 | 0.015 | 0 | 0.005 | ↓ |
| ECM‐receptor interaction | Multiple processes related to ECM‐receptor interaction including cell adhesion, collagen fibril organization, endodermal cell differentiation, cell‐matrix adhesion, cell migration, and others | 4,512 | 64 | 27 | 0 | 4.922 | 0.138 | 0 | 0.005 | ↑ |
| Tight junction | Myofibril assembly, cell–cell junction organization | 4,530 | 101 | 38 | 0 | 0.066 | 0.991 | 0.001 | 0.022 | ↑ |
| Leukocyte transendothelial migration | Integrin‐mediated signaling pathway, cellular response to organic substance, nitrogen compound, and oxygen‐containing compound, cell adhesion, regulation of localization | 4,670 | 89 | 32 | 0.001 | −11.221 | 0.279 | 0.002 | 0.037 | ↓ |
| p53 signaling pathway | (regulation of) Mitotic cell cycle phase transition, regulation of protein kinase activity, cellular response to radiation | 4,115 | 51 | 22 | 0 | 0.66 | 0.828 | 0.002 | 0.037 | ↑ |
| Measles | Multiple processes regarding inflammatory responses including positive regulation of interleukin‐2 biosynthetic process, activation of innate immune response, cytokine‐mediated signaling pathway, positive regulation of transcription from RNA polymerase II promoter, positive regulation of cell proliferation, and others | 5,162 | 98 | 35 | 0 | −3.853 | 0.5 | 0.002 | 0.037 | ↓ |
| Complement and coagulation cascades | Complement activation (classical and alternative pathway), regulation of complement activation | 4,610 | 54 | 19 | 0.01 | −23.344 | 0.033 | 0.003 | 0.046 | ↓ |
| Toxoplasmosis | Arachidonic acid secretion, lipopolysaccharide‐mediated signaling pathway, phospholipid metabolic process, response to peptide | 5,145 | 101 | 34 | 0.002 | 5.997 | 0.279 | 0.004 | 0.053 | ↑ |
| HTLV‐I infection | Multiple processes regarding cell cycle including positive regulation of transcription from RNA polymerase II promoter, regulation of cell communication, cellular component organization, regulation of cellular metabolic process, and others | 5,166 | 213 | 61 | 0.004 | 11.501 | 0.132 | 0.005 | 0.053 | ↑ |
| Influenza A | Multiple process related to the immune response including regulation of protein localization, cytokine‐mediated signaling pathway, pattern recognition receptor signaling pathway, response to virus, regulation of glucose transport, cell surface receptor signaling pathway, and others | 5,164 | 118 | 38 | 0.003 | −7.441 | 0.221 | 0.005 | 0.053 | ↓ |
| Antigen processing and presentation | Multiple processes regarding the regulation of immune response including positive regulation of transferase activity, regulation of protein ubiquitination, cytokine‐mediated signaling pathway, antigen processing and presentation of peptide antigen via MHC class I and class II, activation of innate immune response, and others | 4,612 | 39 | 17 | 0.001 | −1.049 | 0.54 | 0.005 | 0.053 | ↓ |
| Focal adhesion | Multiple processes regarding cell adhesion including the integrin‐mediated signaling pathway, the enzyme linked receptor protein signaling pathway, the cellular response to amino acid stimulus, collagen fibril organization, endodermal cell differentiation, transforming growth factor beta receptor signaling pathway, regulation of cellular component movement and others | 4,510 | 158 | 50 | 0.001 | 0.837 | 0.944 | 0.007 | 0.066 | ↑ |
| Malaria | Retinoid metabolic process | 5,144 | 37 | 16 | 0.002 | −0.57 | 0.589 | 0.008 | 0.072 | ↓ |
| Mineral absorption | Cellular iron ion homeostasis, ferrous iron transport, copper ion transport, inorganic cation import into cell | 4,978 | 32 | 14 | 0.003 | 0 | 1 | 0.02 | 0.168 | ↓ |
| Regulation of actin cytoskeleton | Multiple processes regarding cell adhesion, cell assembly and cell migration including the integrin‐mediated signaling pathway, filopodium assembly, myofibril assembly, (positive regulation of) cell migration, positive regulation of catalytic activity, intracellular signal transduction, cellular response to chemical stimulus, and others | 4,810 | 173 | 47 | 0.027 | 12.016 | 0.219 | 0.037 | 0.281 | ↑ |
| Arrhythmogenic right ventricular cardiomyopathy | Cell communication, cell adhesion, cellular component organization, integrin‐mediated signaling pathway, cell adhesion mediated by integrin, endodermal cell differentiation, cell migration, muscle cell development | 5,412 | 60 | 20 | 0.016 | 0.386 | 0.375 | 0.037 | 0.281 | ↑ |
| TGF‐beta signaling pathway | SMAD protein signal transduction, positive regulation of osteoblast differentiation, BMP signaling pathway, cartilage and bone development, proteoglycan metabolic process, positive regulation of transcription from RNA polymerase II promoter | 4,350 | 62 | 15 | 0.303 | 11.474 | 0.024 | 0.043 | 0.303 | ↑ |
| VEGF signaling pathway | Positive regulation of endothelial cell chemotaxis by VEGF‐activated vascular endothelial growth factor receptor signaling pathway, positive regulation of blood vessel endothelial cell migration, arachidonic acid secretion, positive regulation of glucose import, phospholipid metabolic process | 4,370 | 57 | 19 | 0.019 | 4.154 | 0.402 | 0.045 | 0.303 | ↑ |
Pathways have a name and a specific identification number (ID) and consist of a number of genes (pSize). A pathway was activated (↑) or inhibited (↓) in the microarray analysis of growth plate samples from Great Danes compared with Miniature Poodles if the global probability value (pG) is <0.05. The pG is calculated by combining the probability value (pNDE) of the number of differentially expressed (DE) genes in the pathway (NDE) and the probability value (pPERT) of the total perturbation accumulation in the pathway (tA). The pG is adjusted for multiple comparisons with false discovery rate (FDR) and results in the final probability value (pGFdr). The gene ontology biological processes associated with the genes that are differentially expressed in the respective pathway were provided.
Pathways for Staphylococcus aureus infection, systemic lupus erythematosus, complement, and coagulation cascades showed a significant reduced activity in Great Danes compared with Miniature Poodles. In these pathways, components of the complement system were over‐represented, including different subcomponents of complement 1 (C1) and the C5a anaphylatoxin chemotactic receptor. In addition, the expression of genes for fragments of the MHC class II antigen was down‐regulated, contributing to the inhibition of the pathways mentioned above and to the inhibition of antigen processing and presentation pathways, although the latter regulation was not significant. Furthermore, the TGF‐β and vascular endothelial growth factor (VEGF) signaling pathways, tended to be up‐regulated in Great Danes.
Canonical BMP Signaling Pathway
BMP‐2 and BMP‐6 registered a dissimilar mRNA expression in the microarray analysis (fold change values 1.7 vs. 2.5, respectively, p < 0.05) in Great Danes compared with Miniature Poodles. Given that they are both known for their role in the regulation of bone formation, additional validation steps where undertaken and representative genes of the canonical BMP pathway were measured in the whole growth plate tissue (to validate the microarray findings) and in the separate zones of the growth plate.
In the whole growth plate tissue BMP‐2, BMP‐6, and BMP receptor 1b (BMPR1b) were significantly higher expressed in Great Danes compared with the Miniature Poodles (Fig. 5A), while the remaining genes (i.e., BMPR1a, BMPR2, ID1) did not differ, confirming the microarray analysis. Semi‐quantitative protein expression revealed that the activation of SMAD‐1/5, ‐2, and ‐3 was significantly higher in the Great Dane compared with the Miniature Poodle as significantly more phosphorylated SMADs were present in the Great Dane (Fig. 5B). In addition, the microarray analysis showed that in the Miniature Poodle members of the SMAD‐independent (mitogen‐activated protein kinase [MAPK]) BMP signaling pathway, MAP2K6 (or MKK6) and MAPK14 (or p38α) were upregulated, with 1.4 and 1.8, respectively, compared to the Great Dane.
Figure 5.
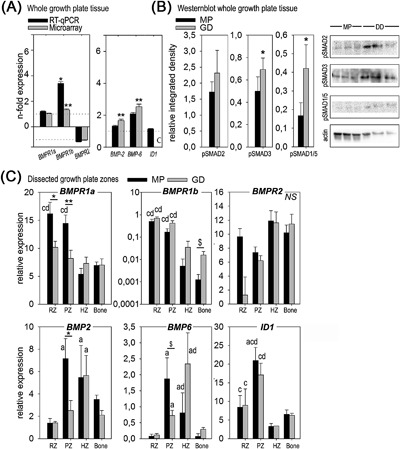
Validation of the canonical BMP signaling pathway. (A) For the whole growth plate tissue relative gene expression in Great Danes (GD) is given in black bars (RT‐qPCR) and gray bars (microarray) as mean ± SD. Data for Miniature Poodles (MP) are set as 1 and −1 for every gene (dotted line). *p < 0.05 and **p < 0.01 GD versus MP. One of the genes measured with RT‐qPCR (ID1) was not annotated in the microarray (C). (B) Integrated density of phosphorylated SMAD2, SMAD3, and SMAD1/5 determined by Western blot in the whole growth plate tissue of MP (black bars) and GD (gray bars) with representative blots. *p < 0.05 (C) Relative gene expression in the canonical BMP signaling pathway in MP (black bars) and GD (gray bars) is given for the reserve (RZ), proliferative (PZ), and hypertrophic zone (HZ), and for Bone as mean ± SD. Within each dog breed the significant differences (p < 0.05) between the given growth plate zone and the RZ, PZ, HZ, and Bone is indicated with a, b, c, and d, respectively. Differences within each growth plate between dog breeds are given with $ p = 0.05–0.1; *p < 0.05; and **p < 0.01.
At the level of the separate growth plate zones, BMPR1a and BMPR1b were significantly higher expressed in the RZ (only in the Miniature Poodles) and PZ (both dog breeds) compared with HZ and Bone, while BMPR2 expression did not differ between growth plate zones regardless of the dog breed (Fig. 5C). While BMPR1a did not differ in the whole growth plate tissues, it was significantly higher in the RZ and PZ of Miniature Poodles compared with Great Danes. BMPR1b expression tended to be 10‐fold higher in Bone of Great Danes compared with Miniature Poodles. Both BMP‐2 and BMP‐6 were significantly higher in the PZ and HZ compared with RZ in both dog breeds, while BMP‐6 was also significantly higher in the HZ compared with Bone in both dog breeds. Interestingly, contrary to the microarray array findings and consequent validation by RT‐qPCR of whole growth plate tissue, BMP‐2 and BMP‐6 were significantly higher in the PZ of Miniature Poodles compared with Great Danes. ID1 and noggin (data not shown) expression, a down‐stream target of BMP‐mediated SMAD 1/5/8 signaling, did not differ between Great Danes and Miniature Poodles. ID1 was significantly higher in the RZ and PZ compared with the HZ in both dog breeds, while its expression was also significantly higher in the PZ compared with Bone in both dog breeds.
DISCUSSION
Almost 3,000 genes were found to be differentially expressed between large and small breed dogs, many of which are associated with different phases of chondrocyte maturation during endochondral bone formation. For example, of the genes up‐regulated in Great Danes compared with Miniature Poodles, the UCMA gene and the NK3 homeobox 2 (Nkx3‐2) gene stimulate early chondrocyte differentiation,31, 32 and BCL2/adenovirus interacting protein 3 (BNIP3) regulates chondrocyte apoptosis.33 This is consistent with the complex mechanisms underlying differences in height, which are probably associated with changes in the equilibrium between the various systemic and local factors that regulate the rate of endochondral bone formation. Furthermore, pathways related to skeletal development, such as the TGF‐β and VEGF signaling pathways, tended to be up‐regulated in Great Danes compared with Miniature Poodles. Given the well‐known chondrogenic effect of TGF‐β,34 the up‐regulation of TGF‐β signaling may facilitate an increased rate of endochondral bone formation in large breed dogs compared with small breed dogs. The VEGF pathway might be activated in order to facilitate angiogenesis during the final phase of endochondral bone formation in the growth plate.
The BMP signaling pathway, known to be related to (endochondral) bone development and fracture healing, seemed to be activated in the Great Dane in the whole growth plate samples at the protein level, including the SMAD 1/5 and SMAD 2/3 downstream signaling. Both pathways have been shown to be activated by BMP signaling in canines.35 Notably, also SMAD‐independent (mitogen‐activated protein kinase [MAPK]) BMP signaling was differentially regulated. In the Great Dane compared to the Miniature Poodle, MAP2K6 (or MKK6) and MAPK14 (or p38α) were downregulated. The latter is predominantly expressed in the prehypertrophic zone36 and influences chondrocyte differentiation. Given that inhibition of MAPK14 delays hypertrophic differentiation in micro‐mass cultures,37 it is plausible that the lower MAPK14 expression in the Great Dane can partially explain the phenotypic difference at the growth plate level: Great Danes have an absolutely larger proliferative zone compared to Miniature Poodles. This indicates that both canonical and non‐canonical BMP signaling pathway might play an important role in the regulation of the pace of endochondral bone formation.
Interestingly, the spatial expression profile of the canonical BMP pathway differed between Great Danes and Miniature Poodles. The higher expression of BMP‐2 and BMP‐6 in the hypertrophic zone of Great Danes resembles the BMP expression profile reported in growth plates of 7 days old rats and of mid‐gestation human fetuses.14, 38 Notably, BMP‐2 and BMP‐6 expression peaked in the proliferative zone of Miniature Poodles being more in line with the BMP expression profile found in older animals, that is, 6‐39 and 10‐week‐old rats.38 As such, it cannot be excluded that the observed differences in spatial expression between Great Danes and Miniature Poodles represent a difference in “bone‐age”, that is, a difference in biological maturity rather than chronological age. In line with this, large breed dogs close their growth plates at a later chronological age than small breed dogs.
Previously, the PTHrP/IHH feedback loop and the IGF‐I pathway have been suggested to support the higher rates of chondrocyte proliferation and hypertrophy in Great Danes, and in turn could explain the growth plate phenotype and rapid growth rate seen in large breed dogs.13 Interestingly, microarray data show that the variation in height between the two dog breeds is regulated by genes and pathways that are less well recognized as being associated with skeletal development; for example, the down‐regulation of the pathways involved in the immune system. Although osteoimmunology is gaining interest, not much is known about the role of the complement system in the growth plate.40 The complement system, and more specifically C1, seems to contribute to the turnover of cartilage into bone during endochondral ossification because several studies have shown that C1 is present in epiphyseal cartilage41 and ossification centers.42 How these systems affect chondrocyte proliferation and hypertrophy and facilitate differences in longitudinal growth and final height remains to be determined.
In addition to complement cascade and immune response pathway, other interesting differentially regulated pathways, related to the cell cycle pathway, were found. Important genes for cell proliferation and cell cycle procession such as TGF‐β2 and Cell division cycle 23 (CDC23) were upregulated in the Great Dane by 1.6 and 1.3, respectively, while genes related to the G1‐phase of the cell cycle, including Cell division protein kinase 6 (CDK6), Cyclin D2, which is able to activate CDK6, and Cyclin E1 and E2, which are activated by activation of CDK6, and genes related to DNA replication cell division cycle 6 (CDC6), origin recognition complexes (ORC1 and 6), and Minichromosome maintenance protein complexes (MCM4‐7) were upregulated in the Miniature Poodles. These genes regulate the transition of a proliferative chondrocyte toward hypertrophy43, 44 and may explain the smaller proliferative zone observed in the Miniature Poodles.
Limitations of the Microarray Study
Microarray analysis detected smaller breed‐related differences in gene expression than did RT‐qPCR. However, this is not unexpected given the limited sensitivity of semi‐quantitative analyses. The second limitation is inherent to the study design. The feasibility of using differences in the height of adult dogs to identify potential targets to be employed in bone and cartilage regenerative strategies was investigated using tissue samples containing a mixture of the whole growth plate and adjacent primary cancellous bone in order to have a representative sample including all phases of the process of endochondral bone formation. As such, we demonstrated that whole growth plate tissue analysis can provide a first impression of potential candidates, while subsequent analysis at the separate growth plate zone levels provides a better understanding of the pathways regulating the rate of endochondral bone formation. This differential spatial regulation observed in Great Danes and Miniature Poodles may also provide regenerative strategies for tissue‐specific challenges regarding bone and cartilage regeneration. For example, in hypertrophic non‐union fracture, differentially regulated genes at the hypertrophic zone level could be used as potential candidates. For cartilage regeneration, the proliferative zone may provide cues for new treatment strategies. Additional analysis focussing on the spatial and temporal expression at transcriptional level, including RNA and small (non‐coding) RNAs will be necessary in order to elucidate all the different mechanisms that contribute to variation in height and pace of (endochondral) bone formation, from genes to epigenetics.
CONCLUSION
In this study, gene expression differences in the growth plate of Great Danes and Miniature Poodles were related to distinct differences in adult height, and hence in the pace of endochondral bone formation in these breeds. The described canine animal model is based on a vast intraspecies physiological disparity in height but with comparative growth plate physiology between dogs and humans as opposed to rodent models. Next to the expected candidates already identified as being associated with bone or cartilage development, a number of genes were detected that have not previously been associated with bone/cartilage development. Therefore, the described canine model seems to have the potential to serve as a model for identifying new local factors that regulate the pace of endochondral bone formation, which will ultimately provide us with more insights in both fine tuning of the development of the growth plate as well as interesting new bone and cartilage regenerative strategies.
AUTHORS’ CONTRIBUTIONS
MAT and FMR designed the study. MT, FMR, DvL, MJAGK, and MAT participated in data acquisition, analysis and interpretation. MAT, MT, FMR, DvL, MJAGK, BPM, JA, LCP, and AMB participated in drafting and revising the paper. All authors have read and approved the final submitted manuscript.
Supporting information
Additional supporting information may be found in the online version of this article.
File S1. Primers used by RT‐PCR for the validation of the microarray and for assessment of the expression of osteogenic lineage related genes.
File S2. cRNA profiles.
File S3. Top 50 genes that were up‐regulated or down‐regulated in Great Danes compared with Miniature Poodles.
ACKNOWLEDGMENTS
The authors wish to acknowledge Harry van Engelen for his valuable technical assistance in sampling the material. Funding was provided by the AO Foundation (Grant S‐10‐48T) and supported by the Dutch Arthritis Foundation (LLP 22 and 12). The founding body provided advice on the study design prior to initiation of the project.
Conflict of interest: None.
REFERENCES
- 1. Mackie EJ, Tatarczuch L, Mirams M. 2011. The skeleton: a multi‐functional complex organ: the growth plate chondrocyte and endochondral ossification. J Endocrinol 211:109–121. [DOI] [PubMed] [Google Scholar]
- 2. Vortkamp A, Pathi S, Peretti GM, et al. 1998. Recapitulation of signals regulating embryonic bone formation during postnatal growth and in fracture repair. Mech Dev 71:65–76. [DOI] [PubMed] [Google Scholar]
- 3. Scotti C, Tonnarelli B, Papadimitropoulos A, et al. 2010. Recapitulation of endochondral bone formation using human adult mesenchymal stem cells as a paradigm for developmental engineering. Proc Natl Acad Sci USA 107:7251–7256. [DOI] [PMC free article] [PubMed] [Google Scholar]
- 4. Gawlitta D, Farrell E, Malda J, et al. 2010. Modulating endochondral ossification of multipotent stromal cells for bone regeneration. Tissue Eng B Rev 16:385–395. [DOI] [PubMed] [Google Scholar]
- 5. Dimitriou R, Jones E, McGonagle D, et al. 2011. Bone regeneration: current concepts and future directions. BMC Med 9:66. [DOI] [PMC free article] [PubMed] [Google Scholar]
- 6. van der Eerden BC, Karperien M, Wit JM. 2003. Systemic and local regulation of the growth plate. Endocr Rev 24:782–801. [DOI] [PubMed] [Google Scholar]
- 7. Lettre G. 2011. Recent progress in the study of the genetics of height. Hum Genet 129:465–472. [DOI] [PubMed] [Google Scholar]
- 8. Lango Allen H, Estrada K, Lettre G, et al. 2010. Hundreds of variants clustered in genomic loci and biological pathways affect human height. Nature 467:832–838. [DOI] [PMC free article] [PubMed] [Google Scholar]
- 9. Simeone P, Alberti S. 2014. Epigenetic heredity of human height. Physiol Rep 2:pii: e12047. [DOI] [PMC free article] [PubMed] [Google Scholar]
- 10. Lui JC, Nilsson O, Chan Y, et al. 2012. Synthesizing genome‐wide association studies and expression microarray reveals novel genes that act in the human growth plate to modulate height. Hum Mol Genet 21:5193–5201. [DOI] [PMC free article] [PubMed] [Google Scholar]
- 11. Kilborn SH, Trudel G, Uhthoff H. 2002. Review of growth plate closure compared with age at sexual maturity and lifespan in laboratory animals. Contemp Top Lab Anim Sci 41:21–26. [PubMed] [Google Scholar]
- 12. Parker HG, Shearin AL, Ostrander EA. 2010. Man's best friend becomes biology's best in show: genome analyses in the domestic dog. Annu Rev Genet 44:309–336. [DOI] [PMC free article] [PubMed] [Google Scholar]
- 13. Tryfonidou MA, Hazewinkel HA, Riemers FM, et al. 2010. Intraspecies disparity in growth rate is associated with differences in expression of local growth plate regulators. Am J Physiol Metab 299:E1044–E1052. [DOI] [PubMed] [Google Scholar]
- 14. Nilsson O, Parker E a, Hegde A, et al. 2007. Gradients in bone morphogenetic protein‐related gene expression across the growth plate. J Endocrinol 193:75–84. [DOI] [PubMed] [Google Scholar]
- 15. Tryfonidou MA, Holl MS, Vastenburg M, et al. 2003. Hormonal regulation of calcium homeostasis in two breeds of dogs during growth at different rates. J Anim Sci 81:1568–1580. [DOI] [PubMed] [Google Scholar]
- 16. Hoppenfeld S, Lonner B, Murthy V, et al. 2004. The rib epiphysis and other growth centers as indicators of the end of spinal growth. Spine (Phila Pa 1976) 29:47–50. [DOI] [PubMed] [Google Scholar]
- 17. Goedegebuure SA, Hazewinkel HA. 1986. Morphological findings in young dogs chronically fed a diet containing excess calcium. Vet Pathol 23:594–605. [DOI] [PubMed] [Google Scholar]
- 18. Roepman P, de Koning E, van Leenen D, et al. 2006. Dissection of a metastatic gene expression signature into distinct components. Genome Biol 7:R117. [DOI] [PMC free article] [PubMed] [Google Scholar]
- 19. van de Peppel J, Kemmeren P, van Bakel H, et al. 2003. Monitoring global messenger RNA changes in externally controlled microarray experiments. EMBO Rep 4:387–393. [DOI] [PMC free article] [PubMed] [Google Scholar]
- 20. Yang YH, Dudoit S, Luu P, et al. 2002. Normalization for cDNA microarray data: a robust composite method addressing single and multiple slide systematic variation. Nucleic Acids Res 30:e15–e15. [DOI] [PMC free article] [PubMed] [Google Scholar]
- 21. Margaritis T, Lijnzaad P, van Leenen D, et al. 2009. Adaptable gene‐specific dye bias correction for two‐channel DNA microarrays. Mol Syst Biol 5:266. [DOI] [PMC free article] [PubMed] [Google Scholar]
- 22. Gentleman R, Carey V, Huber W, et al. 2005. Bioinformatics and computational biology solutions using R and Bioconductor. New York: Springer. [Google Scholar]
- 23. Tarca AL, Draghici S, Khatri P, et al. 2009. A novel signaling pathway impact analysis. Bioinformatics 25:75–82. [DOI] [PMC free article] [PubMed] [Google Scholar]
- 24. Schmittgen TD, Livak KJ. 2008. Analyzing real‐time PCR data by the comparative CT method. Nat Protoc 3:1101–1108. [DOI] [PubMed] [Google Scholar]
- 25. Bates D, Mächler M, Bolker BM, et al. 2015. Fitting linear mixed‐effects models using lme4. J Stat Softw 67:1–48. [Google Scholar]
- 26. Hothorn T, Bretz F, Westfall P. 2008. Simultaneous inference in general parametric models. Biom J 50:346–363. [DOI] [PubMed] [Google Scholar]
- 27. Zreiqat H, Howlett CR, Gronthos S, et al. 2007. S100A8/S100A9 and their association with cartilage and bone. J Mol Histol 38:381–391. [DOI] [PubMed] [Google Scholar]
- 28. Chau M, Forcinito P, Andrade AC, et al. 2011. Organization of the Indian hedgehog‐parathyroid hormone‐related protein system in the postnatal growth plate. J Mol Endocrinol 47:99–107. [DOI] [PMC free article] [PubMed] [Google Scholar]
- 29. Lui JCK, Andrade AC, Forcinito P, et al. 2010. Spatial and temporal regulation of gene expression in the mammalian growth plate. Bone 46:1380 –1390. [DOI] [PMC free article] [PubMed] [Google Scholar]
- 30. Kindblom JM, Nilsson O, Hurme T, et al. 2002. Expression and localization of Indian hedgehog (Ihh) and parathyroid hormone related protein (PTHrP) in the human growth plate during pubertal development. J Endocrinol 174:R1–R6. [DOI] [PubMed] [Google Scholar]
- 31. Kawato Y, Hirao M, Ebina K, et al. 2012. Nkx3.2 promotes primary chondrogenic differentiation by upregulating Col2a1 transcription. PLoS ONE 7:e34703. [DOI] [PMC free article] [PubMed] [Google Scholar]
- 32. Tagariello A, Luther J, Streiter M, et al. 2008. Ucma—a novel secreted factor represents a highly specific marker for distal chondrocytes. Matrix Biol 27:3–11. [DOI] [PubMed] [Google Scholar]
- 33. Oshima Y, Akiyama T, Hikita A, et al. 2008. Pivotal role of Bcl‐2 family proteins in the regulation of chondrocyte apoptosis. J Biol Chem 283:26499–26508. [DOI] [PMC free article] [PubMed] [Google Scholar]
- 34. Li T‐F, O'Keefe RJ, Chen D. 2005. TGF‐β signaling in chondrocytes. Front Biosci A J Virtual Libr 10:681. [DOI] [PMC free article] [PubMed] [Google Scholar]
- 35. Bach FC, Miranda‐Bedate A, van Heel FWM, et al. 2016. Bone morphogenetic protein‐2, but not mesenchymal stromal cells, exert regenerative effects on canine and human nucleus pulposus cells. Tissue Eng Part A 23:233–242. [DOI] [PubMed] [Google Scholar]
- 36. Hutchison MR. 2013. Mice with a conditional deletion of the neurotrophin receptor TrkB are dwarfed, and are similar to mice with a MAPK14 deletion. PLoS ONE 8:e66206. [DOI] [PMC free article] [PubMed] [Google Scholar]
- 37. Stanton LA, Sabari S, Sampaio AV, et al. 2004. P38 MAP kinase signalling is required for hypertrophic chondrocyte differentiation. Biochem J 378:53–62. [DOI] [PMC free article] [PubMed] [Google Scholar]
- 38. Anderson HC, Hodges PT, Aguilera XM, et al. 2000. Bone morphogenetic protein (BMP) localization in developing human and rat growth plate, metaphysis, epiphysis, and articular cartilage. J Histochem Cytochem 48:1493–1502. [DOI] [PubMed] [Google Scholar]
- 39. Sakou T, Onishi T, Yamamoto T, et al. 1999. Localization of Smads, the TGF‐beta family intracellular signaling components during endochondral ossification. J Bone Miner Res 14:1145–1152. [DOI] [PubMed] [Google Scholar]
- 40. Schoengraf P, Lambris JD, Recknagel S, et al. 2013. Does complement play a role in bone development and regeneration? Immunobiology 218:1–9. [DOI] [PubMed] [Google Scholar]
- 41. Toyoguchi T, Yamaguchi K, Nakagawa K, et al. 1996. Change of complement C1s synthesis during development of hamster cartilage. Cell Tissue Res 285:199–204. [DOI] [PubMed] [Google Scholar]
- 42. Sakiyama H, Nakagawa K, Kuriiwa K, et al. 1997. Complement Cls, a classical enzyme with novel functions at the endochondral ossification center: immunohistochemical staining of activated Cls with a neoantigen‐specific antibody. Cell Tissue Res 288:557–565. [DOI] [PubMed] [Google Scholar]
- 43. Moro T, Ogasawara T, Chikuda H, et al. 2005. Inhibition of Cdk6 expression through p38 MAP kinase is involved in differentiation of mouse prechondrocyte ATDC5. J Cell Physiol 204:927–933. [DOI] [PubMed] [Google Scholar]
- 44. Ito K, Maruyama Z, Sakai A, et al. 2013. Overexpression of Cdk6 and Ccnd1 in chondrocytes inhibited chondrocyte maturation and caused p53‐dependent apoptosis without enhancing proliferation. Oncogene 33:1862–1871. [DOI] [PubMed] [Google Scholar]
Associated Data
This section collects any data citations, data availability statements, or supplementary materials included in this article.
Supplementary Materials
Additional supporting information may be found in the online version of this article.
File S1. Primers used by RT‐PCR for the validation of the microarray and for assessment of the expression of osteogenic lineage related genes.
File S2. cRNA profiles.
File S3. Top 50 genes that were up‐regulated or down‐regulated in Great Danes compared with Miniature Poodles.