

Abstract
Background
Variations in care for pregnant women have been reported to affect pregnancy outcomes.
Methods
This study examined data for all 3136 Medicaid beneficiaries enrolled at American Association of Birth Centers (AABC) Center for Medicare and Medicaid Innovation Strong Start sites who gave birth between 2012 and 2014. Using the AABC Perinatal Data Registry, descriptive statistics were used to evaluate socio‐behavioral and medical risks, and core perinatal quality outcomes. Next, the 2082 patients coded as low medical risk on admission in labor were analyzed for effective care and preference sensitive care variations. Finally, using binary logistic regression, the associations between selected care processes and cesarean delivery were explored.
Results
Medicaid beneficiaries enrolled at AABC sites had diverse socio‐behavioral and medical risk profiles and exceeded quality benchmarks for induction, episiotomy, cesarean, and breastfeeding. Among medically low‐risk women, the model demonstrated effective care variations including 82% attendance at prenatal education classes, 99% receiving midwifery‐led prenatal care, and 84% with midwifery‐ attended birth. Patient preferences were adhered to with 83% of women achieving birth at their preferred site of birth, and 95% of women using their preferred infant feeding method. Elective hospitalization in labor was associated with a 4‐times greater risk of cesarean birth among medically low‐risk childbearing Medicaid beneficiaries.
Conclusions
The birth center model demonstrates the capability to achieve the triple aims of improved population health, patient experience, and value.
Keywords: birthing centers, cesarean birth, Medicaid
1. INTRODUCTION
The birth center model has been recognized as a high quality alternative to hospitalization for healthy, childbearing women.1, 2, 3, 4, 5 Recently, there has been renewed interest in birth settings and risk appropriate levels of care.6, 7, 8, 9 In 2015, risk appropriate care and birth settings were the topic of the American College of Obstetricians and Gynecologists and the Society for Maternal‐Fetal Medicine Obstetric Care Consensus Statement.7 Although the document emphasizes the importance of intensive level III and level IV care for women with medical risk factors, it does not address access to appropriate Level 1 care across the United States, including the enhanced care components of Level 1 birth center care.
Approximately 85% of childbearing women in the United States are medically low risk.10 The health care delivery system promotes higher levels of care, fueling unwarranted procedures among healthy childbearing women.11 The vision for high‐quality, high value maternity care in the United States has been hampered by a lack of common definitions of risk in pregnancy.3, 7, 9, 11, 12, 13 In 2012, the Center for Medicare and Medicaid Innovation began Strong Start for Mothers and Newborns, a 4‐year initiative to test innovative models for improving childbirth outcomes for Medicaid beneficiaries. Data from the Strong Start grant sites provides an opportunity to evaluate Level 1 care as the appropriate level of care for the majority of childbearing Medicaid beneficiaries.
Low‐risk childbearing Medicaid beneficiaries are marginalized by a system poorly designed to provide Level 1 care, often providing higher treatment intensity than required by their medical characteristics.11, 14 The purpose of this research is to evaluate the variations in care and outcomes of childbearing Medicaid beneficiaries enrolled at AABC Center for Medicare and Medicaid Innovation Strong Start sites between 2012 and 2014.
2. METHODS
We analyzed data from the AABC Perinatal Data Registry (AABC PDRTM), version 3.5, one of the largest observational, prospective, de‐identified, perinatal data registries in the United States. The PDR measures 189 demographic, descriptive, and process‐and‐outcome indicators while adhering to the guidelines from the Agency for Healthcare Research and Quality including quality assurance mechanisms that ensure completion of data, systematic patient enrollment, minimization of loss of follow‐up, and data consistency checks through verification with medical records.15 The registry is reliable and valid, exceeding birth certificate capabilities with 100% consistency for 10 variables when cross‐matched with two data sources.16 Childbearing women sign a consent form to participate in the data registry on their first obstetric visit. Perinatal attrition is tracked and includes medical attrition, and elective transfers of care and migration.
This analysis includes all 3136 Medicaid beneficiaries enrolled in prenatal care with AABC Strong Start sites between 2012 and 2014 who gave birth during this 3‐year time period. (Figure 1). A descriptive analysis of socio‐demographic and medical characteristics of the sample were compared with publicly available national birth certificate data and analyzed for similarities.17, 18 Next, the core perinatal outcomes of all 3136 childbearing Medicaid beneficiaries giving birth at Strong Start sites, including medically indicated transfers of care, were analyzed and compared with national birth statistics from 2013 and 2014. Finally, cases coded as low risk on admission in labor were analyzed, using descriptive and inferential statistics to evaluate care processes, variations in care processes, and core quality outcomes.
Figure 1.
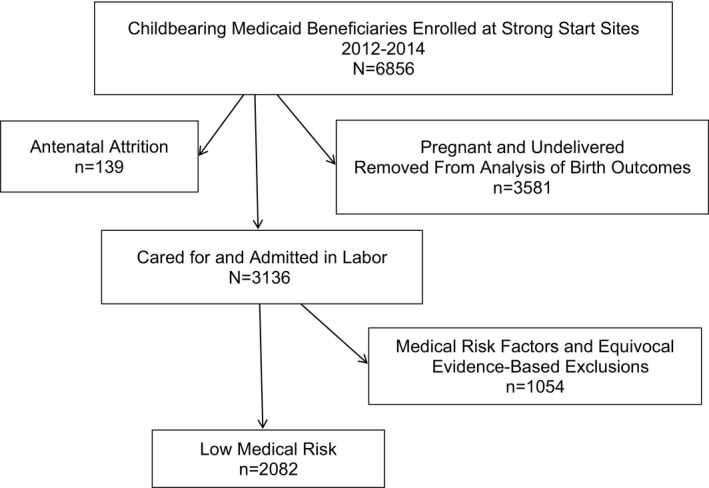
Childbearing Medicaid beneficiaries enrolled at Strong Start sites, 2012‐2014
The AABC Medicaid sample was coded for low medical risk status on admission in labor (Table 1). The coding occurred case by case, chronologically going through the following four categories: medical history, previous pregnancy history, prenatal complications in the current pregnancy, and antenatal medical referrals. Any risk status that would exclude a woman from being admitted into a Commission for Accreditation of Birth Centers (CABC) Accredited Birth Center was coded as “medical risk.” A final category, termed equivocal evidence exclusions, was used to control for warranted variation in this sample. Equivocal evidence exclusions are risk factors that have an equivocal scientific base, where one or more treatment options are appropriate, and the condition is known to increase health care utilization. For example, it is within scientific acceptability standards to admit and manage diet controlled diabetic clients to the out of hospital setting for labor and birth. However, because gestational diabetics require a higher treatment intensity, they were excluded from the analysis of variation in practice.
Table 1.
Exclusion criteria used to determine selection of a low‐risk subsample of women
| Medical risk/equivocal evidence exclusions (N=1054) | Details |
|---|---|
| Preexistent medical history (n=522) | Smoking, chronic hypertension, preexistent diabetes, type 1 diabetes, class II‐IV heart disease, substance abuse, thrombophilia, bicornate uterus |
| Previous pregnancy history (n=95) | Previous cesarean |
| Prenatal complications current pregnancy (n=368) | Abruption or previa, gestational diabetes, gestational hypertension, intrauterine fetal demise, intrauterine growth restriction, malpresentation, multiple gestation, nonreassuring fetal testing, preeclampsia, severe preeclampsia, preterm labor 32‐37 weeks, very preterm <32 weeks, preterm rupture of membranes, postterm, >42 weeks and 0 days, sensitization with antibody, “other”—eg, chronic hypertension, seizures, cerclage, cholestasis, oligohydramnios, low lying placenta |
| Antenatal medical referrals (n=35) | Macrosomia (estimated fetal weight >4500 g), herpes simplex virus, childhood seizure disorder, cholestasis, oligohydramnios, preeclampsia, prelabor rupture of membranes at term |
| Admission status exclusions (n=34) | Intrauterine growth restriction, nonreassuring fetal testing, preeclampsia, prelabor ruptures of membranes at term, postdates >42 weeks, gestational diabetes |
A total of 1054 (33.6%) childbearing women were coded as having a medical or behavioral exclusion risk factor (Table 1). The remaining 2082 childbearing women in the sample were coded as medically low risk and appropriate for admission to the home or birth center setting on admission in labor. Only the women coded as “low medical risk” were included in the descriptive and inferential analysis of care processes variations and pregnancy outcomes.
After the descriptive analysis was complete, four outcome variables: (1) elective induction of labor, (2) episiotomy, (3) breastfeeding, and (4) cesarean delivery were selected for further examination. However, three of these variables were unsuitable for further analysis. There were no elective inductions in the sample and the number of episiotomies was small. Data for breastfeeding on discharge was not a mandatory field and was unreported for 38.8% of the sample. Cesarean delivery was a mandatory variable within the PDR, thus data on cesarean were well reported with no missing data, making the data suitable for detailed analysis.
Binary logistic regression was used to further examine the relationship between cesarean and predictor variables. The model contained six independent variables. Use or nonuse of hydrotherapy in labor,19 continuous versus noncontinuous labor support,20 use or nonuse of intermittent auscultation,21 and elective hospitalization versus outpatient admission in labor22 were chosen as evidence‐based processes with relationships to cesarean birth. Race and parity were included because they demonstrated statistically significant relationships within the sample. An Institutional Review Board Exemption was obtained by Texas Woman's University in March 2015.
3. RESULTS
The sample includes data from all 3136 Medicaid beneficiaries enrolled in care and giving birth with 45 AABC Strong Start sites in 21 states between 2012 and 2014 (Figure 1). No participating birth centers were excluded from the sample; all sites had complete data, which is defined as having no more than 5% incomplete records.
3.1. Socio‐demographic characteristics
The AABC sample has a similar socio‐demographic profile compared with the United States Birth Certificate data during the study time period (Table 2).17, 18, 23 The AABC sample is younger, with a higher percentage of non‐Hispanic white women and more unmarried women than national birth certificate data from the same time period. The medical risk profile of the AABC sample is similar to national data with slightly more women in the AABC PDR having diabetes than the national average.18 The sample coded as low risk has a significantly higher percentage of unmarried, and non‐Hispanic white women. Women with medical risks identified on admission tended to be younger, less educated, and more likely to be unmarried on average.
Table 2.
Socio‐demographic and medical risk characteristics national birth certificate data—2013 and the American Association of Birth Centers Medicaid Sample—2012‐2014
| National data | AABC PDR all Medicaid births N=3136 | |||
|---|---|---|---|---|
| n (%) | Mean | n (%) | Mean [SD] | |
| Socio‐demographic characteristics | ||||
| Age | 28.217 | 26.7 [5.4] | ||
| Unmarried | 40.217 | 1608 (51.3) | ||
| Race/ethnicity | ||||
| Non‐Hispanic white | 53.817 | 2054 (65.5) | ||
| Hispanic | 22.917 | 684 (21.7) | ||
| Non‐Hispanic black | 14.717 | 240 (7.7) | ||
| American Indian or Alaskan Native | 1.117 | 30 (0.9) | ||
| Asian or Pacific Islander | 7.017 | 48 (1.5) | ||
| Medical risk factors | ||||
| Diabetes during pregnancy | 5.918 | 219 (6.9) | ||
| Hypertension, pregnancy‐associated | 4.823 | 114 (3.6) | ||
| Hypertension, chronic | 1.523 | 18 (0.5) | ||
When we examined perinatal outcomes, the Medicaid beneficiaries giving birth within the AABC Medicaid sample exceeded national benchmarks for several perinatal quality indicators (Table 3).18, 24, 25, 26, 27 Within the AABC Medicaid sample of 3136 births, there were no elective inductions of labor before 39 weeks. The rate of episiotomy within the AABC sample was 2.1%, below the national benchmark of 5%.26 The nulliparous, term, vertex, cesarean rate within the AABC Medicaid births was 14.1%, one‐half the rate of 26.9% in the national data.18 Excluding unreported data, the exclusive breastfeeding at discharge among AABC PDR Medicaid beneficiaries was 92.7%, higher than the national average of 41.5% (Table 3).18, 25, 27
Table 3.
Perinatal quality indicators national sample, AABC Medicaid births and AABC low‐risk Medicaid births 2012‐2014
| Perinatal quality indicator | National data % | AABC PDR all Medicaid births n=3136 n (%) | AABC PDR low medical risk n=2082 n (%) |
|---|---|---|---|
| Total induction of labor | 23.018 | 398 (12.6) | 91 (4.3) |
| Total cesarean | 32.718 | 305 (9.7) | 89 (4.2) |
| Nulliparous term vertex singleton cesarean | 26.918 | 176 (14.1)a | 69 (8.5)a |
| Episiotomy | 12.027 | 58 (2.1)b | 35 (1.7) |
| Ever breastfed | 79.225 | 1821 (95.3)d | 1225 (96.1)d |
| Exclusive breastfeeding on discharge | 41.5c | 1769 (92.7)e | 1189 (93.3)e |
AABC Medicaid Births all birth sample nullipara denominator 1247, 815 in low medical risk sample.
Episiotomy denominator AABC All Medicaid Birth Sample 2831, AABC Low‐risk Sample 1993.27
Not publicly reported. Data from unpublished report of the National Quality Forum, Joint Commission PC05 Endorsement Summary, aggregate data, pg. 3.
Excludes unreported data for composite measure ever breastfed (discharge and 6 weeks postpartum). AABC All Medicaid Birth Sample denominator 1909; 1227 (31.4%) unreported cases excluded.
Excludes unreported data for infant feeding on discharge, denominator for AABC Low Medical Risk Sample is 1275; 807 (38.7%) unreported cases excluded.
Next, we examined the processes of care provided within the AABC sample that led to improved outcomes. For this analysis, the sample coded as low medical risk on admission in labor was used. Controlling for medical risk factors and conditions known to increase utilization of interventions allowed researchers to evaluate variations in effective care and preference sensitive care among healthy childbearing women. The birth center model of care demonstrated appropriate use of effective interventions for women of low medical risk (Table 4). The majority of beneficiaries attended prenatal classes (81.8%), had midwifery‐led care for prenatal care (98.9%), had midwifery‐led labor and birth (84.0%), and used intermittent auscultation as the sole form of fetal surveillance (58.1%).
Table 4.
Selected process of care variables, AABC low‐risk Medicaid births 2012‐2014, N=2082
| Effective care variables | n (%) |
|---|---|
| Prenatal classes | |
| Attended class | 1704 (81.8) |
| Primary attendant for prenatal care | |
| Nurse‐midwife/certified midwife | 1797 (86.3) |
| Certified professional midwife or licensed midwife | 262 (12.6) |
| Physician | 19 (0.9) |
| No data | 4 (0.2) |
| Primary attendant for birth | |
| Nurse‐midwife/certified midwife | 1538 (73.9) |
| Certified professional midwife or licensed midwife | 210 (10.1) |
| Physician | 274 (13.1) |
| Support in labor (more than one choice allowed) | |
| Nurse‐midwife/certified midwife | 1375 (66.0) |
| Certified professional midwife or licensed midwife | 228 (10.9) |
| Physician | 130 (6.2) |
| Nurse | 845 (40.6) |
| Doula | 293 (14.1) |
| Birth assistant | 167 (8.0) |
| Fetal surveillance in labor | |
| Intermittent auscultation only | 1210 (58.1) |
| Home visits (postpartum) | |
| Yes | 1210 (58.1) |
We also evaluated the extent to which patient preferences were met, and we found that the AABC model of care demonstrated good accountability to patient preferences. For childbearing women coded as low medical risk on admission in labor, the majority delivered at their intended birth site (Table 5). For example, among 1760 women intending to give birth at home or at a birth center, 1468 (83%) birthed at their intended location. Ten percent of women initiating care with the intention to give birth at home or in the birth center, required hospitalization on admission to care in labor. Another 7.5% of women were admitted to the home or birth center setting in labor and required transfer of care to the hospital setting during labor.
Table 5.
AABC low medical risk Medicaid births, 2012‐2014: preference sensitive variations in carea
| Preference sensitive variables | Intended place of birth n (%) | First site of admission n (%) | Site of birth n (%) | Infant feeding intentionb n (%) | Infant feeding outcome on discharge from birth facilityc n (%) |
|---|---|---|---|---|---|
| Preferred birth site | |||||
| Birth center | 1714 (82.3) | 1561 (74.9) | 1409 (67.7) | ||
| Home | 46 (2.2) | 63 (3.0) | 59 (2.8) | ||
| Hospital | 240 (11.5) | 458 (21.9) | 614 (29.5) | ||
| No preference declared | 82 (3.9) | ‐ | ‐ | ||
| Preference for infant feeding at first prenatal visit | |||||
| Breast | 1421 (95.9) | 1189 (93.3) | |||
| Combination | 41 (2.8) | 35 (2.7) | |||
| Formula | 19 (1.3) | 50 (3.9) | |||
N=2082.
Breastfeeding intention denominator 1481; excludes 601 (28%) unreported cases.
Infant feeding on discharge denominator 1275; excludes 807 (38.8%) cases of unreported data.
The second patient preference evaluated was infant feeding preference. The birth center model demonstrated accountability to women's infant feeding preferences (Table 5). Excluding unreported data, significant differences in intention to breastfeed were demonstrated upon admission to prenatal care with more non‐Hispanic white women planning to exclusively breastfeed than black and Hispanic women (88.0%, 72.2%, and 63.6%, respectively). This racial disparity disappeared during the perinatal episode of care, and by the time of discharge there were no significant differences reported in exclusive breastfeeding by race among women of low medical risk among non‐Hispanic white, black, or Hispanic women (92.1%, 91.3% and 91.8%, respectively). One‐half of the women who expressed an infant feeding preference other than exclusive breastfeeding on admission to care (n=665) experienced a conversion of preference and were exclusively breastfeeding on discharge from the birth episode suggesting a relationship between the care model and reduction in breastfeeding disparities.
The third example of adherence to patient preferences included the elective use of hospitalization in childbirth among medically low‐risk women. The use of hospital facilities in this sample was less than 30%, in contrast to national data in which 98.6% of births occurred in the hospital setting.18 In the absence of medical risk factors requiring hospitalization, one‐fifth of beneficiaries in the low‐risk sample chose elective hospitalization in labor.
3.2. Variations and predictors of cesarean
Cesarean birth among the AABC sample is lower than the national average with notable variations. Maternal age, education, gestational age, and number of prenatal visits were not a significant factor in mode of delivery in this sample. Women giving birth vaginally were more likely to be multiparous and married. Statistically significant racial variations were noted. Among nulliparous, term, singleton, vertex pregnancies, the cesarean rate was 6.9% for non‐Hispanic white, 11.1% for non‐Hispanic black, and 10.8% for Hispanic women.
Among the 2082 AABC births coded as low medical risk on admission in labor, 457 (22%) chose elective hospitalization. Elective hospitalization is a preference sensitive variation within the sample and is significantly associated with cesarean delivery. Controlling for known medical risk factors on admission in labor, 9.0% (n=45) of the beneficiaries who elected hospitalization had a cesarean birth, compared with 2.7% (n=44) of those with home or birth center admission. Of the 455 women who chose elective hospitalization in labor, 283 (62.2%) were unmarried. Women choosing elective hospitalization were significantly younger than women choosing birth center or home admission.
Binary logistic regression was used to model the risk of having a cesarean delivery while controlling for parity, race, hydrotherapy, elective hospitalization, continuous labor support, and intermittent auscultation. As shown in Table 6, only two of the six independent variables made unique statistically significant contributions to the model (parity and elective hospitalization versus outpatient admission). The strongest predictor of cesarean in this sample of medically low‐risk Medicaid beneficiaries was parity, with first‐time mothers having an adjusted odds ratio of 5.33 (95% CI 3.18‐8.92) when compared with multiparous women. Elective hospitalization also had a strong relationship with cesarean risk, with an adjusted odds ratio of 4.13 (95% CI 2.12‐8.04). Race and use of independent care practices such as continuous labor support or exclusive intermittent auscultation were not independent predictors of cesarean birth in this sample.
Table 6.
Adjusted odds ratios for cesarean delivery, AABC Medicaid births, low medical risk sample, 2012‐2014
| Variable | Adjusteda OR (95% CI) |
|---|---|
| Nulliparous | 5.33 (3.18‐8.92) |
| Multiparous (reference) | 1.00 |
| No use of hydrotherapy | 1.13 (0.59‐2.15) |
| Hydrotherapy use (reference) | 1.00 |
| Elective hospitalization | 4.13 (2.12‐8.04) |
| Outpatient admission in labor (reference) | 1.00 |
| No use of labor support | 1.69 (0.93‐3.09) |
| Use of labor support (reference) | 1.00 |
| No use of intermittent auscultation | 0.73 (0.36‐1.48) |
| Use of intermittent auscultation (reference) | 1.00 |
| Non‐Hispanic white | 1.29 (0.82‐2.04) |
| All other races (reference) | 1.00 |
Adjusted for all variables in the table.
4. DISCUSSION
Between 2012 and 2014, 3136 Medicaid beneficiaries enrolled in care and gave birth with AABC Strong Start sites. The enrollees exhibited a similar socio‐behavioral and medical risk profile as women giving birth in the United States during the same study time period. The outcomes of care through the AABC model demonstrated lower induction, episiotomy, cesarean delivery, and higher breastfeeding than national benchmarks.
Previous research has demonstrated that women of low medical risk are susceptible to unwarranted variations in medical intervention.14 This study explored the birth center as a Level 1 model of care which provides effective care and preference sensitive care, leading to high quality outcomes. The AABC PDR is robust and serves as a useful tool to evaluate concepts of risk, quality, and effective and preference sensitive care among childbearing Medicaid beneficiaries. A principal strength of the study was the use of longitudinally collected data from one of the largest perinatal data registries in the United States with the capacity to quantify a multitude of behavioral, social, and medical risk factors.
Unreported infant feeding data is a significant limitation of this study. Between 2012 and 2014, breastfeeding was not a mandatory variable within the PDR. Close to 40% of the infant feeding on discharge data was unreported across the sites, ranging from 15.6% to 55.4% at the site level. Analysis of unreported breastfeeding data demonstrated that no site contributed to more than 3% of missing infant feeding on discharge data. A pattern of completion was noted between breastfeeding variables, with 63% of the data being complete for both intention to feed and feeding on discharge from the birth facility.
Racial disparities are known to exist among childbearing women, with institutional racism understood to be a factor.28 Racial disparity in utilization of birth centers was noted in this study, with underutilization in communities of color, specifically among black and Asian women. In contrast to birth certificate data, race was not independently predictive of cesarean delivery or bottle feeding within the AABC Medicaid sample. Although there were racial disparities in intention to breastfeed on admission to prenatal care, these disparities were ameliorated during perinatal care and through the postpartum period. These care conversions suggest a potential role for the Level 1 birth center model of care to protect against racial disparities. More research is needed to understand the underutilization of birth centers within communities of color and the potential for the model to reduce racial and ethnic disparities in birth outcomes.
Elective hospitalization is a driver of poor quality among medically low‐risk childbearing Medicaid beneficiaries receiving care at AABC Strong Start sites. This finding is consistent with previous research demonstrating that hospital facilities vary in their ability to provide Level 1 care for childbearing women.29 This variation warrants further investigation because 80% of the costs of childbirth are consumed by the hospital facility fees associated with birth.30, 31
5. CONCLUSION
The American Association of Birth Centers (AABC) model of care is a risk appropriate, Level 1 model of care serving a socio‐demographically diverse, predominantly low‐risk population. This study demonstrates that childbearing Medicaid beneficiaries achieved high quality outcomes within AABC Strong Start sites. The birth center model of care is aligned with the national quality movement, demonstrating adherence to effective care and patient preferences. Elective hospitalization in labor was an independent and significant risk factor for cesarean delivery in this sample. Continued expansion of access to the Birth Center model of care among childbearing Medicaid beneficiaries offers promise in improving population health, patient experience of care, and value.
Jolles DR, Langford R, Stapleton S, Cesario S, Koci A, Alliman J. Outcomes of childbearing Medicaid beneficiaries engaged in care at Strong Start birth center sites between 2012 and 2014. Birth. 2017;44:298‐305. https://doi.org/10.1111/birt.12302
[The copyright line for this article was changed on October 07, 2017 after original online publication]
REFERENCES
- 1. Thornton P, McFarlin BL, Park C, et al. Cesarean outcomes in US birth centers and collaborating hospitals: a cohort comparison. J Midwifery Womens Health. 2017;62:40‐48. [DOI] [PubMed] [Google Scholar]
- 2. Woo VG, Milstein A, Platchek T. Hospital‐affiliated outpatient birth centers: a possible model for helping to achieve the triple aim in obstetrics. JAMA. 2016;316:1441‐1442. [DOI] [PubMed] [Google Scholar]
- 3. MacDorman MF, Declercq E. Trends and characteristics of United States out‐of‐hospital births 2004‐2014: new information on risk status and access to care. Birth. 2016;43:116‐124. [DOI] [PubMed] [Google Scholar]
- 4. Alliman J, Phillippi JC. Maternal outcomes in birth centers: an integrative review of the literature. J Midwifery Womens Health. 2016;61:21‐51. [DOI] [PubMed] [Google Scholar]
- 5. Howell E, Palmer A, Benatar S, Garrett B. Potential Medicaid cost savings from maternity care based at a freestanding birth center. Medicare Medicaid Res Rev. 2014;4:E1‐E13. [DOI] [PMC free article] [PubMed] [Google Scholar]
- 6. American College of Obstetricians and Gynecologists . Committee opinion No. 687: approaches to limit intervention during labor and birth. Obstet Gynecol. 2017;129:e20‐e28. [DOI] [PubMed] [Google Scholar]
- 7. American College of Obstetricians and Gynecologists . Obstetric Care Consensus No. 2: levels of maternal care. Obstet Gynecol. 2015;125:502‐515. [DOI] [PubMed] [Google Scholar]
- 8. Korst LM, Feldman DS, Bollman DL, et al. Cross‐sectional survey of California childbirth hospitals: implications for defining maternal levels of risk‐appropriate care. Am J Obstet Gynecol. 2015;213:527.e1‐527.e12. [DOI] [PubMed] [Google Scholar]
- 9. Institute of Medicine (IOM) and National Research Council (NRC) , ed. An Update on Research Issues in the Assessment of Birth Settings: Workshop Summary. Washington, DC: The National Academies Press; 2013. [PubMed] [Google Scholar]
- 10. Broussard DL, Sappenfield WB, Fussman C, Kroelinger CD, Grigorescu V. Core state preconception health indicators: a voluntary, multi‐state selection process. Matern Child Health J. 2011;15:158‐168. [DOI] [PubMed] [Google Scholar]
- 11. Shah N. A NICE delivery—the cross‐Atlantic divide over treatment intensity in childbirth. N Engl J Med. 2015;372:2181‐2183. [DOI] [PubMed] [Google Scholar]
- 12. Carter MC, Corry M, Delbanco S, et al. 2020 vision for a high‐quality, high‐value maternity care system. Womens Health Issues. 2010;20:S7‐S17. [DOI] [PubMed] [Google Scholar]
- 13. Angood PB, Armstrong EM, Ashton D, et al. Blueprint for action: steps toward a high‐quality, high‐value maternity care system. Womens Health Issues. 2010;20:S18‐S49. [DOI] [PubMed] [Google Scholar]
- 14. Backes Kozhlmannil K, Law MR, Virnig BA. Cesarean delivery rates vary tenfold among US hospitals; reducing variation may address quality and cost issues. Health Aff. 2013;32:527‐535. [DOI] [PMC free article] [PubMed] [Google Scholar]
- 15. Gliklich RE, Dreyer NA, Leavy MB. Registries for evaluating patient outcomes: a user's guide. AHRQ methods for effective care. Agency Health Care Res. Quality. 2014;13:EHC111. [PubMed] [Google Scholar]
- 16. Stapleton SR. Validation of an online data registry for midwifery practices: a pilot project. J Midwifery Womens Health. 2011;56:452‐460. [DOI] [PubMed] [Google Scholar]
- 17. Hamilton BE, Martin JA, Osterman MJK, Curtin SC, Matthews TJ. Births: final data for 2014. Natl Vital Stat Rep. 2015;64:1‐64. [PubMed] [Google Scholar]
- 18. Martin JA, Hamilton BE, Osterman MJ, Curtin SC, Matthews TJ. Births: final data for 2013. Natl Vital Stat Rep. 2015;64:1‐65. [PubMed] [Google Scholar]
- 19. Nutter E, Meyer S, Shaw‐Battista J, Marowitz A. Waterbirth: an integrative analysis of peer‐reviewed literature. J Midwifery Womens Health. 2014;59:286‐319. [DOI] [PubMed] [Google Scholar]
- 20. Hodnett ED, Gates S, Hofmeyr GJ, Sakala C. Continuous support for women during childbirth. Cochrane Database Syst Rev. 2013;10:CD003766 https://doi.org/10.1002/14651858.cd003766.pub5. Accessed March 3, 2017. [DOI] [PubMed] [Google Scholar]
- 21. Alfirevic Z, Devane D, Gyte GM. Continuous cardiotocography (CTG) as a form of electronic fetal monitoring (EFM) for fetal assessment during labour. Cochrane Database Syst Rev. 2017;2:CD006066 https://doi.org/10.1002/14651858.cd006066.pub3. Accessed March 3, 2017. [DOI] [PubMed] [Google Scholar]
- 22. Stapleton SR, Osborne C, Illuzzi J. Outcomes of care in birth centers: demonstration of a durable model. J Midwifery Womens Health. 2013;58:3‐14. [DOI] [PubMed] [Google Scholar]
- 23. Martin JA, Hamilton BE, Ventura SJ, et al. Births: Final data for 2009. Natl Vital Stat Rep. 2011;60:1. [PubMed] [Google Scholar]
- 24. Agency for Health Care Research and Quality (AHRQ) . Center for Delivery, Organization and Markets, Health Care Costs and Utilization Project, HCUPnet, Nationwide Inpatient Sample, 1997‐2008 [last publically reported data]. https://www.hcup-us.ahrq.gov/reports/statbriefs/sb110.jsp. Accessed March 3, 2017.
- 25. Centers for Disease Control and Prevention . 2014. Breastfeeding Report Card. https://www.cdc.gov/breastfeeding/pdf/2014breastfeedingreportcard.pdf. Updated 2015. Accessed May 16, 2017.
- 26. The Leapfrog Group . Rate of Episiotomy. The Leapfrog Group Web site. http://www.leapfroggroup.org/ratings-reports/rate-episiotomy. Accessed April 26, 2016.
- 27. Podulka J, Stranges E, Steiner C. Hospitalizations Related to Childbirth, 2008 [Statistical Brief #110]. https://www.hcup-us.ahrq.gov/reports/statbriefs/sb110.jsp. Updated 2011. [PubMed]
- 28. Alhusen JL, Bower KM, Epstein E, Sharps P. Racial discrimination and adverse birth outcomes: an integrative review. J Midwifery Womens Health. 2016;61:707‐720. [DOI] [PMC free article] [PubMed] [Google Scholar]
- 29. Jolles D. Unwarranted variation in utilization of cesarean section among low risk childbearing women. J Midwifery Womens Health. 2017;62:49‐57. [DOI] [PubMed] [Google Scholar]
- 30. Truven Health Analytics . The Cost of Having a Baby in the United States. Truven Health Analytics Market Scan Study. Ann Arbor, MI: Truven Health Analytics; 2013. [Google Scholar]
- 31. Torio C, Moore B. National Inpatient Hospital Costs: The Most Expensive Conditions by Payer, 2013 [Statistical Brief #204]. https://www.hcup-us.ahrq.gov/reports/statbriefs/sb204-Most-Expensive-Hospital-Conditions.pdf. Updated 2016. Accessed April 13, 2017. [PubMed]