

Abstract
Raman spectroscopy is known as a powerful technique for solid catalyst characterization as it provides vibrational fingerprints of (metal) oxides, reactants, and products. It can even become a strong surface‐sensitive technique by implementing shell‐isolated surface‐enhanced Raman spectroscopy (SHINERS). Au@TiO2 and Au@SiO2 shell‐isolated nanoparticles (SHINs) of various sizes were therefore prepared for the purpose of studying heterogeneous catalysis and the effect of metal oxide coating. Both SiO2‐ and TiO2‐SHINs are effective SHINERS substrates and thermally stable up to 400 °C. Nano‐sized Ru and Rh hydrogenation catalysts were assembled over the SHINs by wet impregnation of aqueous RuCl3 and RhCl3. The substrates were implemented to study CO adsorption and hydrogenation under in situ conditions at various temperatures to illustrate the differences between catalysts and shell materials with SHINERS. This work demonstrates the potential of SHINS for in situ characterization studies in a wide range of catalytic reactions.
Keywords: heterogeneous catalysis, nanoparticles, Raman spectroscopy, surface-enhanced Raman spectroscopy (SERS), SHINERS
Introduction
In situ characterization techniques are important for understanding the working principles and deactivation mechanisms of solid catalysts.1, 2, 3 Ex situ knowledge is often insufficient, because the surface structure and chemical composition of heterogeneous catalysts are influenced by the reaction environment, as induced by temperature, pressure, and gas composition.4, 5
Spectroscopic techniques, such as Raman spectroscopy, are valuable tools to understand (bulk) catalyst structures and catalyst–reactant interactions by diagnostic analysis of vibrational fingerprints.6, 7 The technique can be easily applied to characterize solid catalysts under working conditions, including in the liquid phase.8, 9 However, Raman spectroscopy intrinsically suffers from low signal intensities owing to the low Raman cross‐sections and is therefore not always optimally equipped for detecting surface reactions.10
A technique that can significantly boost the Raman signal intensity is surface‐enhanced Raman spectroscopy (SERS).11, 12 The foundation for SERS relies on noble metal nanostructures with plasmonic properties.13, 14, 15 Plasmonic nanostructures prepared from Ag, Au, and Cu generate strong localized electromagnetic fields at the surface under illumination with visible light.16, 17 Such local enhancement can drastically increase the detection limit of Raman spectroscopy, reaching even single‐molecule sensitivity under optimal conditions.18 Additionally, owing to the highly localized surface sensitivity, it can be used to observe possible intermediate structures during reactions.19, 20
To improve the applicability as a universal surface characterization technique, shell‐isolated nanoparticle‐enhanced Raman spectroscopy (SHINERS) was recently developed.21 By coating gold or silver cores with SiO2, the plasmonic core is passivated so that virtually any substrate can be characterized with this technique.22, 23, 24 For example, shell‐isolated nanoparticles (SHINs) can be assembled over catalytically active single‐crystal surfaces to investigate structure‐sensitive reactions.25 Additionally, oxide coatings provide improved thermal stability and inertness. These features, combined with the possibility to anchor solid catalysts to the surface, make SHINERS an interesting characterization technique for heterogeneous catalysis research.26 An important step forward in the development of SHINERS in catalysis was recently realized by Tian et al. by demonstrating SHINs as a universal support material and nano‐antenna for various solid catalyst nanoparticles.27 In a follow‐up study, they proved that with SHINERS, the type of coating material has an evident effect on the behavior of solid catalysts.28
In this research work, we present a relatively facile colloidal method to prepare metal@TiO2@Au and metal@SiO2@Au shell‐isolated nanoparticles (SHINs) and illustrate their potential in the field of heterogeneous catalysis (Figure 1). The obtained TiO2‐ and SiO2‐SHINs are tested for their thermal stability by heat treatments from 300 to 500 °C and subsequent testing of their Raman signal enhancement of aqueous Rhodamine 6G (Rh6G). Both SiO2 and TiO2 metal oxide shells provide stable SHINERS substrates that can withstand temperatures up to 400 °C in air without losing Raman signal intensity enhancement. Subsequently, the TiO2@Au and SiO2@Au SHINERS substrates were implemented as support material for the preparation of Ru and Rh hydrogenation catalysts. The obtained Ru@SHINs and Rh@SHINs were used to study the effect of catalyst material and shell material on CO hydrogenation. In other words, we have designed local sensor materials enabling the qualitative probing of catalytic CO hydrogenation by making use of the SHINERS principle and transition metals as active hydrogenation catalysts. A visual interpretation of the aim of this work is illustrated in Figure 1.
Figure 1.

Top: Element maps of the intermediate steps of Au NPs, TiO2@Au, and oxidized Ru@TiO2@Au as obtained with STEM‐EDX (scanning transmission electron microscopy‐energy dispersive X‐ray analysis). Middle: Schematic of the various steps involved in the synthesis of Ru@TiO2@Au. Bottom: Schematic of the SHINERS principle of Ru@TiO2@Au during CO hydrogenation at elevated temperatures. The following chemical compounds are used for the synthesis: iPrOH=2‐propanol, APTMS=(3‐aminopropyl)trimethoxysilane and TTEAIP=titanium(IV) (triethanolaminato)isopropoxide.
Results and Discussion
Designing optimal Au@TiO2 and Au@SiO2 SHINs materials
To study catalytic reactions with SHINERS, a substrate with optimal signal enhancement and stability is required. The first step is to find an optimal core size for enhancing Raman scattering under 785 nm wavelength laser illumination. A 785 nm laser as excitation source in combination with Au nanoparticles (NPs) are used to limit potential plasmonic side reactions.29, 30, 31 Au NPs of various sizes were prepared between approximately 40 and 100 nm by using a seed‐mediated growth to realize satisfying control over the Au particle size.32, 33, 34 The Au cores were then coated with ultrathin TiO2 in a controlled manner by modifying two existing methods (Figure 2, more TEM and SEM images are found in the Supporting Information; Figures S1–S6). The complete synthesis can be found in the Experimental Section.35, 36
Figure 2.

Transmission electron microscopy (TEM) images of: (a) 16 nm seeds; (b) 105 nm AuNPs; (c) 105 nm AuNPs with 1.5 nm TiO2 coating; and (d) 105 nm AuNPs with 4 nm TiO2 coating.
All samples were analyzed with UV/Vis spectroscopy (Figures S7–S11 in the Supporting Information) to examine the quality of the colloidal solution. Well‐dispersed colloidal Au NPs exhibit a localized surface plasmon resonance (LSPR) between 530–600 nm, depending on their size. After the growth of a coating, the LSPR usually redshifts with increasing coating thickness, as expected from the increase in the dielectric constant from TiO2 in comparison to water.37, 38, 39 An additional shoulder or peak between 700–800 nm was sometimes observed for samples with very thin coatings, owing to the low stability of Au NPs in water–isopropanol mixtures. When aggregation occurs, the LSPR of two or more Au NPs can couple, which results in the observation of additional bands. The absorption is redshifted with respect to the original LSPR position. This effect becomes even more pronounced when the particles are dried on a Si wafer before SHINERS experiments. Aggregated Au NPs after drying show a broad band extinction up to the infrared regime (Figure S11 in the Supporting Information). The aggregated state of the Au NPs after the drying step is necessary for SERS and SHINERS to enhance the Raman signal when using a 785 nm laser. Without aggregation, there is no signal enhancement observed.40 The effectiveness of Au and TiO2@Au NPs for SERS and SHINERS were evaluated by measuring the Raman signal intensity of the xanthene ring stretch of Rh6G aqueous solutions at 1362 cm−1.41 The dye molecule Rh6G is a prototype molecule for testing SERS substrates. Owing to its inherent large Raman scattering cross‐section it is often used to compare the effectiveness of SERS substrates. The dye molecule has been used for single‐molecule experiments owing to its resonance at 528 nm, however, in this work, Rh6G is not in resonance with the 785 nm laser.41
By measuring aqueous solutions, the analyte is dispersed homogeneously over the S(HIN)ERS substrates without drying effects that might lead to local concentration variations. As a result of the heterogeneous nature of the drop‐casted S(HIN)ERS substrates, the Raman signal intensity might fluctuate between different spots in the sample. Therefore, 40 point scans were measured for each sample of which the ten most intense signals were averaged, as can be seen in Figure 3 a for bare Au NPs. Without S(HIN)ERS substrates, it was impossible to measure a spectrum of aqueous Rh6G (0.1 mm), however, a comparison to solid Rh6G can be found in Figure 3 a. When comparing the signal intensity at 1362 cm−1 between SERS samples, we found an optimal plasmon core size between 70–90 nm with estimated analytical enhancement factors between 104–105 for TiO2‐coated NPs (Figure 3 a, b; calculations can be found in the Experimental Section).42 All Au NPs were coated with various TiO2 coating thicknesses. As expected, the intensity of the 1362 cm−1 band decreases exponentially with increasing TiO2‐coating thickness. Examples of SHINER spectra of Rh6G over 76 nm Au cores with various TiO2 coatings are shown in Figure 3 c. When comparing the relative intensity of all the Au cores with various TiO2 coating thicknesses (Figure 3 d), it was observed that the shell thickness can be increased for larger plasmonic cores, while preserving sufficient electromagnetic enhancement. Larger Au cores still enhance the Raman signal with coatings up to 4 nm, whereas smaller cores lose the complete Raman signal under the current measurement conditions with thinner coatings below 3 nm. This so‐called probing distance in our work is similar to what has been observed by Kumari et al.43 on SiO2@Ag substrates; the probing distance improves with increasing particle size (Figure 3 d, based on averaged spectra found in Figures S12–S16 in the Supporting Information).
Figure 3.

(a) Raman spectra of 0.1 mm aqueous Rh6G over Au NPs SERS substrates sized between 38 and 106 compared with aqueous Rh6G and solid Rh6G without SERS enhancement. (b) The averaged intensity of the Rh6G band at 1362 cm−1 for various Au NP sizes between 38 and 106 nm. (c) The average Rh6G spectra for 76 nm Au NPs with controlled TiO2 coating. (d) The average intensity of the 1362 cm−1 band for various Au NP sizes with controlled TiO2 thickness normalized to its value for uncoated Au NPs. (λ=785 nm; P=2.0×10⁵ W cm−2).
For SHINERS to be viable in heterogeneous catalysis, the substrates need to be stable at elevated temperatures. Unstable substrates will result in signal loss owing to sintering, or worse: additional Raman scattering signals as a result of the accessible gold surfaces. To verify the stability, several TiO2@Au NPs were put to the test by exposing them to 300, 400, and 500 °C in air for 3 h. They were compared with SiO2@Au, which were also prepared in our lab (Figures S5, S10, and S15 in the Supporting Information). Sample degradation could be observed by visual inspection under an optical microscope (Figure S17 in the Supporting Information). Without metal oxide coatings, Au NPs sintered on the Si wafer, forming large bulk Au. The SHINERS stability was tested by comparing the signal intensity of Rh6G at 1362 cm−1 before and after the heat treatments. By using this method, many samples can be tested and compared rapidly. Furthermore, by performing the stability tests ex situ with aqueous Rh6G, we can rule out any effects of thermal wandering of the analyte during in situ measurements. It was observed that for many samples under study, the Rh6G signal drops to lower intensities after thermal treatment. The results are shown in Figure 4 left (more examples and full spectra can be found in Figures S18–S20 in the Supporting Information). For both types of dielectric coating materials, the Raman signal intensity does not remain stable above 300 °C when a coating is thinner than 2 nm.
Figure 4.

Left: Thermal stability of the TiO2@Au and SiO2@Au SHINs: the Rh6G 1362 cm−1 was compared with its initial value after the specified heat treatment for 3 h. Right: Thermal stability of the TiO2@Au and SiO2@Au SHINs: the intensity of pyridine at 1008 cm−1 was related to the Rh6G intensity at 1364 cm−1 to test the uniformity of the coating. (λ=785 nm; P=2.0×10⁵ W cm−2). Additional information can be found in Figures S18–23 in the Supporting Information.
The uniformity of the metal oxide shells is important during catalysis as it isolates the Au core from sintering and undesired side reactions. The shell can be tested for pin holes by measuring the Raman signal of aqueous pyridine (10 mm) over SHINERS substrates.21 When a shell insufficiently covers the Au core, pyridine molecules can adsorb to the metal surface. As a result, the pyridine can now be observed by using SERS owing to an additional chemical enhancement that is not present when the Au core is fully isolated by metal oxides. Two intense peaks in the Raman spectrum at 1008 and 1036 cm−1 can now be observed, originating from two ring breathing modes (Figure S21 in the Supporting Information).44 On all TiO2@Au substrates, a very weak Raman signal of pyridine could be detected (Figure S22 in the Supporting Information). The signal was, however, extremely weak when compared with uncoated Au NPs (Figure S22 in the Supporting Information). For this reason, the pyridine/Rh6G ratio was used to compare the samples, so that the signal enhancement of the substrate was compensated for. The thermal stability of TiO2@Au seems to be related to the thickness of the dielectric coating. A completely pin hole free coating was not obtained for coatings under 3 nm. However, the pyridine signal intensity was very low and coatings were found to be stable with a minimum of 2 nm coating (Figure 4). A broad band at 700 cm−1 intensifies strongly after heat treatments beyond 300 °C and is split up into multiple bands after 400 °C (Figure S18 in the Supporting Information).45 It has been suggested that the phase transition temperature of amorphous TiO2 to anatase is around 400 °C, but this shifts to around 500 °C when heating amorphous NPs.46 Beyond 300 °C, the TiO2 coating starts to densify and crystallize46 and at around 500 °C it definitely cracks open, which allows the Au cores to sinter.
SiO2 coatings could be grown extremely thin, with a minimum of 1.2 nm without pin holes. However, these thin coatings proved to be unstable above 300 °C, whereas 2.2 nm coatings remain stable up to 400 °C (Figure 4, Figures S22 and S23 in the Supporting Information). The amorphous SiO2 coating also densifies with temperatures above 300 °C, as can be observed by the growth of D1, D2, and Si−OH stretching vibrations in the Raman spectra of SiO2@Au after heat treatments (Figure S18 in the Supporting Information).47, 48 Starting from 500 °C, all substrates are completely changed in structure as is observed in the extremely low Rh6G signal and the strongly improved pyridine/Rh6G ratio (Figure 4 right). Owing to the densification of the coatings, it is recommended to stay below 400 °C when using SiO2‐ and TiO2‐SHINS.
So far, we have not been able to produce SHINERS substrates that are stable in air at 500 °C. Only a small fraction of the substrates remains plasmonically active for SERS, as can be seen by the relative ratio of pyridine to Rh6G Raman signal intensity. However, we expect that new shell materials have to be implemented to gain better thermal stabilities.
Synthesis and characterization of Ru/SHINs and Rh/SHINs
TEM images revealed that Au cores were still isolated after 400 °C heat treatment with TiO2 and SiO2 coatings (Figure S24 in the Supporting Information). SERS and SHINERS are surface‐sensitive characterization techniques,15 meaning that the highest signal will be obtained from the shell–catalyst interface enabling study of various metal–support interactions. We therefore introduced hydrogenation catalysts to the best TiO2‐ and SiO2‐based SHINs in terms of both overall stability and Raman signal intensity: 76 nm Au NPs with 2.6 nm TiO2 and 2.2 nm SiO2 coating. When using these two different substrate materials, we were interested to implement SHINERS to study the effect of catalyst and support material on the catalytic hydrogenation of CO over active metals.
Three different catalysts were prepared through wet impregnation: Ru@SiO2@Au, Ru@TiO2@Au, and Rh@SiO2@Au. They were prepared by mixing an aqueous solution of metal chlorides with the colloidal solution and subsequently dried on a Si wafer. By using a gentle calcination step at 300 °C or under UV/ozone, the MClx were (partially) oxidized, resulting in MOx@SiO2@Au and MOx@TiO2@Au SHINs. In Figure 5 TEM and STEM‐EDX images are shown of Ru NPs deposited on the TiO2@Au and SiO2@Au SHINS after heat treatment in air at 300 °C. The Ru catalyst particles are in the range 1–2 nm as observed by TEM. By using STEM‐EDX, we can confirm that the cores consist of Au (red) with shells of Ti (blue) or Si (green) after the catalyst preparation treatment. Ru is detected as well and is covering the SHINs. These results suggest that the nanostructures can be effectively implemented as in situ SHINERS substrates; Ru is dispersed over the metal oxides and is in close contact to SHINs, which exhibit Raman signal enhancement factors of roughly 104.
Figure 5.

(a) TEM image and (b) STEM‐EDX elemental map of RuOx@TiO2@Au, (c) TEM image, and (d) STEM‐EDX elemental map of RuOx@SiO2@Au. All scale bars are 50 nm.
Directly after UV/ozone treatment, we can observe various bands between 100–700 cm−1, which are associated with a mixed RuCl3 and RuO2 material (Figure 6). It has to be noted that the Raman signal for Ru@TiO2@Au and Ru@SiO2@Au are not the same. However, explaining the Raman spectra of the catalyst precursors is beyond the scope of this article. After a heat treatment in air at 300 °C, RuCl3 is fully oxidized to RuO2, which is apparent from the intense broad bands between 100 and 700 cm−1. The Raman signals of nano‐sized RuO2 are known to broaden and redshift with respect to bulk RuO2 Raman bands at 528, 644, and 716 cm−1 because of finite‐size effects and stress induced by lattice strain.49 The broadening of the RuO2 bands is much stronger in comparison to what has been seen before in the literature for Raman spectra of RuO2. This can be explained by the fact that very small NPs were formed and probed at the Ru–SHINs interfaces, thus more strain is observed in comparison to conventional Raman.50, 51 RuO2 was then reduced to Ru0 in a 10 mL min−1 flow of H2 in 40 mL min−1 Ar at 150 °C. In situ SHINERS verified the reduction of the catalysts by the absence of the Ru−O and Ru−Cl stretches in the spectrum between 100 and 700 cm−1 in Figure 6. The remaining Raman bands are associated with amorphous TiO2 (700 cm−1)45 and Si−OH (990 cm−1) and Si (520 cm−1) from the Si wafer.52
Figure 6.
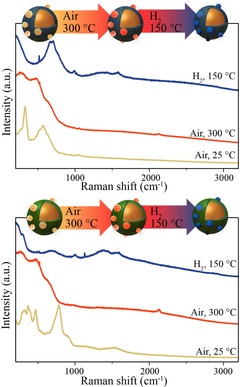
Raman spectra of (top) RuCl3@TiO2@Au after UV/O3 treatment (yellow), RuO2@TiO2@Au after oxidation at 300 °C in air (orange), and Ru@TiO2@Au after reduction at 150 °C in 10–40 mL min−1 H2–Ar (blue). Bottom: RuCl3@SiO2@Au after UV/O3 treatment (yellow), RuO2@SiO2@Au after oxidation at 300 °C in air (orange), and Ru@SiO2@Au after reduction at 150 °C in 10–40 mL min−1 H2–Ar (blue). (λ=785 nm; P=2.6×10⁵ W cm−2).
CO hydrogenation over Ru/SHINs and Rh/SHINs
Both Ru and Rh were assembled over the SHINs (Rh@SiO2@Au characterization can be found in Figures S25 and S26 in the Supporting Information). After reduction, CO was introduced to the catalysts. As demonstrated in Figure 7, both catalysts show stretching vibrations of chemisorbed carbonyl species directly after exposure to CO gas. We could not observe CO adsorption on similar Ru/SiO2 samples without SHINERS (Figure S27 in the Supporting Information).
Figure 7.
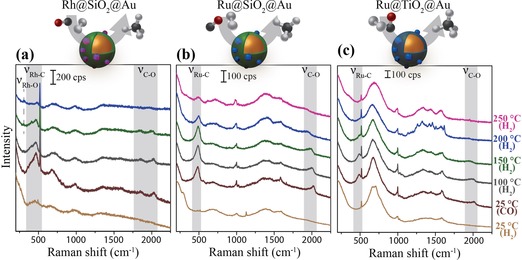
SHINER spectra of the catalytic hydrogenation of adsorbed CO over (a) Rh@SiO2@Au and (b) Ru@SiO2@Au and (c) Ru@TiO2@Au under H2 atmosphere at the specified reaction temperatures. After CO was adsorbed at 25 °C, the gas atmosphere was switched to H2 in Ar and the temperature was stepwise increased. The V M–C and V C–O vibrational regions are indicated by the highlighted areas around, respectively, 480 and 2000 cm−1(λ=785 nm; P=2.6×10⁵ W cm−2).
These observations reinforce the conclusion that metallic catalysts are indeed formed after H2 reduction, and that the SHINs are still active for Raman signal enhancement. Ru mainly shows CO adsorbed in a linear position at around 485 and 2020 cm−1, which are the stretching vibrations of, respectively, Ru−CO and RuC−O.53, 54, 55 For Rh, additional bands are observed with lower energies at 305 and 1860 cm−1, which are associated with CO adsorption in a bridged position.
The atmosphere was switched back to 10 mL min−1 H2 in 40 mL min−1 Ar and the temperature was increased stepwise to 200 °C. All bands associated with M−CO stretching vibrations decreased in intensity. A small peak arose at 305 cm−1 for Rh@SiO2@Au. This small peak has been previously assigned to subsurface Rh−O species, which are difficult to reduce.56 This leads us to believe that CO is indeed dissociated, hydrogenated, and desorbed, whereas the oxygen remains as a subsurface species. For Ru, only linearly adsorbed CO at 485 and 2020 cm−1 at all temperatures is observed and only the removal of adsorbed CO is observed. We do not see the creation of new surface species under the applied methanation conditions. To desorb or hydrogenate CO from Ru surfaces requires temperatures of at least 250 °C, whereas all CO is removed from the Rh surface at 200 °C.
Finally, the effect of shell material on the catalytic properties was investigated by using Ru@SiO2@Au and Ru@TiO2@Au. After reduction with 10 mL min−1 H2 at 150 °C, the obtained Ru@SHINs were exposed to 10 mL min−1 CO atmosphere, which immediately led to the observation of adsorbed CO (Figure 7). The two characteristic stretching vibrations at around 485 and 2020 cm−1 are observed on both SiO2‐ and TiO2‐SHINs.53, 54, 55 Minor differences were observed between Ru@SiO2@Au and Ru@TiO2@Au, but were not convincingly clear, bearing in mind a spectral resolution of approximately 3 cm−1. However, when heating the samples stepwise under H2 atmosphere, it became clear that the TiO2 and SiO2 support materials do have a different effect on the reduction properties of the supported Ru NPs when studied by SHINERS. At temperatures above 150 °C, the Ru−CO stretching vibrations are shifted to higher energies with a stronger decrease in intensity for the Ru@TiO2@Au system (Figure S28 in the Supporting Information). This demonstrates the difference induced by a TiO2 layer for the CO hydrogenation over Ru in comparison to the Ru@SiO2 system and is in line with what is known in the literature.57, 58, 59 After the CO hydrogenation, the temperature was reduced back to 150 °C and the H2 atmosphere was changed back to CO. This resulted in the observation of the CO bands again with equal intensity (Figure S29 in the Supporting Information).
Outlook
By using the described methods, SHINERS is applicable for studying heterogeneous catalysis at temperatures up to 400 °C. At present, we have focused on CO adsorption and hydrogenation when using SHINERS. The TiO2‐ and SiO2‐SHINS were found to be stable under the reaction conditions, with the intensity of the v Ru‐C staying at similar values—80–100 %—after reaction at 250 °C under hydrogen atmosphere (Figure S28 in the Supporting Information). Additionally, this method can be applied to a wide range of catalyst materials with ease of preparation. For example, we have prepared similar structures with Pt and Pd catalysts by using an aqueous MClx impregnation step (Figure 8). We therefore see great potential in this method. However, there are more challenges left to tackle. First of all, the stability of the SHINs is limited above 300 °C under reaction conditions. Future work could be performed on more stable or flexible coating materials, such as graphene. Second, during sample preparation, but also during reaction, contamination of the sample can occur, obstructing the interpretation of the data. Additionally, it is difficult to couple SHINERS results to catalytic activity because of the small quantities of the substrates. At the moment, we are working on methods to solve these technical obstacles.
Figure 8.

SHINER spectra of Rh, Pd, Pt, and Ru metal nanoparticles that can be applied as hydrogenation catalysts. Over these various metals, we can observe the difference in CO adsorption onto the metal nanoparticles with linear, bridged, and hollow conformations.56, 61, 62
Conclusion
Thermally stable TiO2@Au and SiO2@Au were successfully prepared for in situ SHINERS characterization of working solid catalysts. The simple synthesis procedure requires basic laboratory equipment and can therefore be applied in a wide variety of laboratories. Moreover, the optimal TiO2‐ and SiO2‐SHINs performed well as SHINERS substrates with analytical enhancement factors between 104 and 105, even after thermal treatments in air at 400 °C. Nano‐sized catalyst materials can be assembled over the SHINs by wet impregnation to study catalyst preparation. Subsequently, the obtained catalyst/SHINs can be exposed to reactants in the gas phase for in situ characterization of the catalyst structure and interfaces with improved intensity. These materials demonstrated their potential for the study of catalytic solids with SHINERS, as was observed by the different activity in CO hydrogenation over Ru@TiO2@Au and Ru@SiO2@Au SHINs.
Experimental Section
Chemicals
The following chemicals were purchased and used as received: (3‐aminopropyl)trimethoxysilane (APTMS, 97 %), sodium silicate solution (27 % SiO2 in 14 % NaOH), titanium(IV) (triethanoloaminato) isopropoxide solution (TTEAIP, 80 wt % in isopropanol), Rhodamine 6G, RuCl3 ⋅ x H2O (40–49 % Ru content), RhCl3 (98 %), H2PtCl6 (8 wt % in H2O), PdCl2 (≥99.9 %), hydroxylamine hydrochloride (>98 %) from Sigma–Aldrich; ammonia solution (28–30 %) from VWR International; HAuCl4 ⋅3 H2O (99.99 % metals basis) from Alfa Aesar; trisodium citrate dihydrate (99 %) from Acros Organics; 2‐propanol (CHROMASOLV™ LC‐MS >99 %) from Honeywell; hydrochloric acid (Emsure, 37 %) from Merck. Demineralized water was purified with a Milli‐Q system (18.2 MΩ) before use.
Preparation of gold seeds
Ultra‐pure H2O (30 mL) and 1 % (w/v) HAuCl4 (300 μL) were added to a 250 mL round‐bottom flask with a clean stirring bar. The solution was rapidly brought to a boil in a preheated oil bath, with stirring at 1000 rpm. As soon as the solution started boiling, 1 % (w/v) trisodium citrate solution (0.9 mL) was added. The flask was removed from the heat after 10 min, once nanoparticle maturation was complete as indicated by the color transition from light yellow to ruby red.34
Preparation of 80–90 nm gold nanoparticles
Seeds (1.0 mL) were added to Milli‐Q water (112 mL) and 1 % (w/v) trisodium citrate (2.0 mL) was added. Au NPs were grown carefully by dropwise addition of NH2OH⋅HCl (2.4 mL, 10 mm) and HAuCl4 (1.7 mL, 1 % w/v) over 30 min. The volume of the droplets was estimated to be around 10 μL. After fully growing the particles, the solution was left stirring for an additional 10 min.21 The size of the final Au NPs was controlled by varying the volume of seed solution added.
SiO2 coating of 1–3 nm
A 1.0 mm solution of (3‐aminopropyl)trimethoxysilane (APTMS, 0.4 mL) was added dropwise to a solution of gold NPs (15 mL) and stirred for 20 min. Subsequently, a sodium silicate solution (1.0–1.6 mL, diluted to 0.54 wt % with Milli‐Q water and adjusted to pH 10.6–10.8 with HCl) was added dropwise under vigorous stirring at 2000 rpm. The flask was placed in an aluminium starfish at 90 °C and stirred for 30–90 min depending on the required coating thickness. After synthesis, the particles were centrifuged and washed three times in Milli‐Q water and finally stored in 5 mL Milli‐Q water in the fridge at 4 °C.60
TiO2 coating of 1–4 nm
Colloidal particles (10 mL) were concentrated to 1 mL after centrifugation and subsequently mixed with isopropanol (3 mL). With stirring at 2000 rpm, aqueous APTMS (80 μL, 1.1 mm) was added. After 10 min, TTEAIP (50–200 μL, 2.5 mm in isopropanol) was added dropwise, depending on the desired coating thickness. After 1 h, a solution containing ammonia (50 μL, 28–30 %) was added and stirred overnight to prepare a shell of 1–4 nm. After synthesis, the NPs were centrifuged and washed two times in isopropanol and two times in Milli‐Q water.35, 36
SERS and SHINERS sample preparation
A colloidal solution (10 μL) was drop‐casted onto a Si wafer and dried under vacuum in a desiccator for 30 min. Raman intensity tests were performed by adding aqueous Rhodamine 6G (0.1 mm) solutions over the drop‐casted substrates and were covered with a glass cover‐sheet to prevent evaporation of the solvent. Pin hole tests were performed by adding aqueous pyridine (10 mm) solutions over the drop‐cast substrates and were covered with a glass cover‐sheet to prevent evaporation of the solvent. The thermal stability of the substrates was tested by measurement before and after thermal treatment at 300 and 400 °C (5 °C min−1) under air for 3 h.
Characterization
UV/Vis spectra were obtained by using a Varian Cary 50 UV/Vis Spectrophotometer in the range 250–1000 nm and a Craic UV/Vis microscope. Transmission electron microscopy (TEM) images were recorded by using a FEI Tecnai 12 Icor TEM operating at 120 kV. Samples were prepared by drop‐casting a colloidal solution on carbon‐coated TEM grids, which were left to dry in air. Scanning transmission electron microscopy‐energy dispersive X‐ray analysis (STEM‐EDX) images were obtained with a FEI Talos F200X electron microscope operating at 200 kV. Raman spectroscopy measurements were performed with a Renishaw InVia Raman microscope, using 785 nm diode laser excitation through a 50× objective (0.75 NA). Ex situ experiments were all performed under 0.24 mW (i.e., 1.12×10⁵ W cm−2), with an integration time of 10 s. All spectra are shown as obtained: no smoothing, background correction, or baseline subtraction was performed.
Catalytic studies with SHINERS
SHINs (0.1 mL) were mixed with an aqueous RuCl3 or RhCl3 (10–15 μL, 2 mm) solution and mixed intensely by shaking and ultrasonic treatment. An aliquot (10 μL) of these mixtures was then dried under vacuum on a Si wafer. The obtained substrates for catalytic studies with SHINERS were subsequently cleaned with UV/ozone treatment for 1 h. To obtain metal‐containing catalyst materials, the substrates were reduced in situ by exposure to 10 mL min−1 H2 in 40 mL min−1 Ar at 150 °C in a Linkam THMS600 heating microscope stage. Raman spectroscopy measurements were performed with a Renishaw InVia Raman microscope, using 785 nm diode laser excitation through a 20× objective (0.4 NA). In situ experiments were all performed under 2 mW (i.e., 2.6×10⁵ W cm−2), with an integration time of 10 s.
Enhancement factor
To express the effectiveness of SERS and SHINERS substrates, the enhancement factor (EF) is often used. Here, we used the analytical enhancement factor (AEF) as described by Le Ru et al.,42 which gives a good indication of the signal to expect. To calculate the AEF, we compared the Raman signal intensity of dry Rhodamine 6G (Rh6G) with that of the Raman signal intensity obtained from 0.1 mm of an aqueous solution of Rh6G over a SERS/SHINERS substrate under identical experimental conditions. Following the description in the work by Le Ru et al., we assumed that the probed volume was identical and ignored the fact that SERS is a surface‐sensitive technique [Eq. (1)].
 |
(1) |
in which
and


For example, when we calculate the AEF of the 80 nm Au NPs with 2.6 nm TiO2, which has a signal intensity of 17 380 counts at 1360 cm−1, compared with dry Rh6G with a signal intensity of 6795 counts, we obtain an enhancement factor of 7×10⁴ [Eq. (2)]:
 |
(2) |
Conflict of interest
The authors declare no conflict of interest.
Supporting information
As a service to our authors and readers, this journal provides supporting information supplied by the authors. Such materials are peer reviewed and may be re‐organized for online delivery, but are not copy‐edited or typeset. Technical support issues arising from supporting information (other than missing files) should be addressed to the authors.
Supplementary
Acknowledgements
The Netherlands Organization for Scientific Research (NWO) and Shell Global Solutions in the framework of the Chemical Innovation Partnership Project (CHIPP) are thanked for financial support. Hans Meeldijk and Wouter Lamme, both from Utrecht University, are thanked for their contributions with the TEM‐EDX measurements.
T. Hartman, B. M. Weckhuysen, Chem. Eur. J. 2018, 24, 3733.
References
- 1. Bañares M. A., Adv. Mater. 2011, 23, 5293–5301. [DOI] [PubMed] [Google Scholar]
- 2. Tinnemans S. J., Mesu J. G., Kervinen K., Visser T., Nijhuis T. A., Beale A. M., Keller D. E., Van Der Eerden A. M. J., Weckhuysen B. M., Catal. Today 2006, 113, 3–15. [Google Scholar]
- 3. Stavitski E., Weckhuysen B. M., Chem. Soc. Rev. 2010, 39, 4615–4625. [DOI] [PubMed] [Google Scholar]
- 4. Weckhuysen B. M., Chem. Commun. 2002, 97–110. [DOI] [PubMed] [Google Scholar]
- 5. Buurmans I. L. C., Weckhuysen B. M., Nat. Chem. 2012, 4, 873–886. [DOI] [PubMed] [Google Scholar]
- 6. Wachs I. E., Catal. Today 1996, 27, 437–455. [Google Scholar]
- 7. Bañares M. A., Mestl G., Advances in Catalysis, Vol. 52 (Eds.: B. Gates, H. Knoezinger, F. Jentoft), Elsevier, Amsterdam, 2009, pp. 43–128. [Google Scholar]
- 8. Mestl G., J. Mol. Catal. A 2000, 158, 45–65. [Google Scholar]
- 9. Wachs I. E., Roberts C. A., Chem. Soc. Rev. 2010, 39, 5002–5017. [DOI] [PubMed] [Google Scholar]
- 10. Knözinger H., Catal. Today 1996, 32, 71–80. [Google Scholar]
- 11. Jeanmaire D. L., van Duyne R. P., J. Electroanal. Chem. Interfacial Electrochem. 1977, 84, 1–20. [Google Scholar]
- 12. Kim H., Kosuda K. M., Van Duyne R. P., Stair P. C., Chem. Soc. Rev. 2010, 39, 4820–4844. [DOI] [PubMed] [Google Scholar]
- 13. Moskovits M., J. Chem. Phys. 1978, 69, 4159–4161. [Google Scholar]
- 14. Albrecht M. G., Creighton J. A., J. Am. Chem. Soc. 1977, 99, 5215–5217. [Google Scholar]
- 15. Ding S.-Y., You E.-M., Tian Z.-Q., Moskovits M., Chem. Soc. Rev. 2017, 46, 4042–4076. [DOI] [PubMed] [Google Scholar]
- 16. Schlücker S., Angew. Chem. Int. Ed. 2014, 53, 4756–4795; [DOI] [PubMed] [Google Scholar]; Angew. Chem. 2014, 126, 4852–4894. [Google Scholar]
- 17. Ding S.-Y., Yi J., Li J.-F., Ren B., Wu D.-Y., Panneerselvam R., Tian Z.-Q., Nat. Rev. Mater. 2016, 1, 16021. [Google Scholar]
- 18. Kneipp K., Wang Y., Kneipp H., Perelman L. T., Itzkan I., Dasari R. R., Feld M. S., Phys. Rev. Lett. 1997, 78, 1667–1670. [Google Scholar]
- 19. van Schrojenstein Lantman E. M., de Peinder P., Mank A. J. G., Weckhuysen B. M., ChemPhysChem 2015, 16, 547–554. [DOI] [PMC free article] [PubMed] [Google Scholar]
- 20. Choi H. K., Park W. H., Park C. G., Shin H. H., Lee K. S., Kim Z. H., J. Am. Chem. Soc. 2016, 138, 4673–4684. [DOI] [PubMed] [Google Scholar]
- 21. Li J. F., Huang Y. F., Ding Y., Yang Z. L., Li S. B., Zhou X. S., Fan F. R., Zhang W., Zhou Z. Y., Wu D. Y., Ren B., Wang Z. L., Tian Z. Q., Nature 2010, 464, 392–395. [DOI] [PubMed] [Google Scholar]
- 22. Tian Z.-Q., Ren B., Li J.-F., Yang Z.-L., Chem. Commun. 2007, 3514–3534. [DOI] [PubMed] [Google Scholar]
- 23. Harvey C. E., van Schrojenstein Lantman E. M., Mank A. J. G., Weckhuysen B. M., Chem. Commun. 2012, 48, 1742–1744. [DOI] [PubMed] [Google Scholar]
- 24. Li J.-F., Zhang Y.-J., Ding S.-Y., Panneerselvam R., Tian Z.-Q., Chem. Rev. 2017, 117, 5002–5069. [DOI] [PubMed] [Google Scholar]
- 25. Guan S., Donovan-Sheppard O., Reece C., Willock D. J., Wain A. J., Attard G. A., ACS Catal. 2016, 6, 1822–1832. [Google Scholar]
- 26. Hartman T., Wondergem C. S., Kumar N., Van Den Berg A., Weckhuysen B. M., J. Phys. Chem. Lett. 2016, 7, 1570–1584. [DOI] [PMC free article] [PubMed] [Google Scholar]
- 27. Zhang H., Wang C., Sun H., Fu G., Chen S., Zhang Y., Chen B., Anema J. R., Yang Z., Li J., Tian Z., Nat. Commun. 2017, 8, 15447. [DOI] [PMC free article] [PubMed] [Google Scholar]
- 28. Zhang H., Zhang X.-G., Wei J., Wang C., Chen S., Sun H.-L., Wang Y.-H., Chen B.-H., Yang Z.-L., Wu D.-Y., Li J.-F., Tian Z.-Q., J. Am. Chem. Soc. 2017, 139, 10339–10346. [DOI] [PubMed] [Google Scholar]
- 29. van Schrojenstein Lantman E. M., Deckert-Gaudig T., Mank A. J. G., Deckert V., Weckhuysen B. M., Nat. Nanotechnol. 2012, 7, 583–586. [DOI] [PubMed] [Google Scholar]
- 30. Cushing S. K., Wu N., J. Phys. Chem. Lett. 2016, 7, 666–675. [DOI] [PubMed] [Google Scholar]
- 31. Harvey C. E., Weckhuysen B. M., Catal. Lett. 2015, 145, 40–57. [DOI] [PMC free article] [PubMed] [Google Scholar]
- 32. Enustun B. V., Turkevich J., J. Am. Chem. Soc. 1963, 85, 3317–3328. [Google Scholar]
- 33. Frens G., Nat. Phys. Sci. 1973, 241, 20–22. [Google Scholar]
- 34. Haiss W., Thanh N. T. K., Aveyard J., Fernig D. G., Anal. Chem. 2007, 79, 4215–4221. [DOI] [PubMed] [Google Scholar]
- 35. Seh Z. W., Liu S., Zhang S. Y., Bharathi M. S., Ramanarayan H., Low M., Shah K. W., Zhang Y. W., Han M. Y., Angew. Chem. Int. Ed. 2011, 50, 10140–10143; [DOI] [PubMed] [Google Scholar]; Angew. Chem. 2011, 123, 10322–10325. [Google Scholar]
- 36. Zhou N., Polavarapu L., Gao N., Pan Y., Yuan P., Xu Q., Nanoscale 2013, 5, 4236–4241. [DOI] [PubMed] [Google Scholar]
- 37. Kelly K. L., Coronado E., Zhao L. L., Schatz G. C., J. Phys. Chem. B 2003, 107, 668–677. [Google Scholar]
- 38. Liu W.-L., Lin F.-C., Yang Y.-C., Huang C.-H., Gwo S., Huang M. H., Huang J.-S., Nanoscale 2013, 5, 7953–7962. [DOI] [PubMed] [Google Scholar]
- 39. Mubeen S., Zhang S., Kim N., Lee S., Kramer S., Xu H., Nano Lett. 2012, 12, 2088–2094. [DOI] [PubMed] [Google Scholar]
- 40. Zhang Y., Walkenfort B., Yoon J. H., Schlücker S., Xie W., Phys. Chem. Chem. Phys. 2015, 17, 21120–21126. [DOI] [PubMed] [Google Scholar]
- 41. Jensen L., Schatz G. C., J. Phys. Chem. A 2006, 110, 5973–5977. [DOI] [PubMed] [Google Scholar]
- 42. Le Ru E. C., Blackie E., Meyer M., Etchegoin P. G., J. Phys. Chem. C 2007, 111, 13794–13803. [Google Scholar]
- 43. Kumari G., Kandula J., Narayana C., J. Phys. Chem. C 2015, 119, 20057–20064. [Google Scholar]
- 44. Zuo C., Jagodzinski P. W., J. Phys. Chem. B 2005, 109, 1788–1793. [DOI] [PubMed] [Google Scholar]
- 45. Degioanni S., Jurdyc A. M., Bessueille F., Coulm J., Champagnon B., Vouagner D., J. Appl. Phys. 2013, 114, 234307. [Google Scholar]
- 46. Khatim O., Amamra M., Chhor K., Bell A. M. T., Novikov D., Vrel D., Kanaev A., Chem. Phys. Lett. 2013, 558, 53–56. [Google Scholar]
- 47. Degioanni S., Jurdyc A. M., Cheap A., Champagnon B., Bessueille F., Coulm J., Bois L., Vouagner D., J. Appl. Phys. 2015, 118, 153103. [Google Scholar]
- 48. Perriot A., Vandembroucq D., Barthel E., Martinez V., Grosvalet L., Martinet C. H., Champagnon B., J. Am. Ceram. Soc. 2006, 89, 596–601. [Google Scholar]
- 49. Mar S. Y., Chen C. S., Huang Y. S., Tiong K. K., Appl. Surf. Sci. 1995, 90, 497–504. [Google Scholar]
- 50. Gouadec G., Colomban P., Prog. Cryst. Growth Charact. Mater. 2007, 53, 1–56. [Google Scholar]
- 51. Formo E. V., Wu Z., Mahurin S. M., Dai S., J. Phys. Chem. C 2011, 115, 9068–9073. [Google Scholar]
- 52. McMillan P. F., Remmele R. L., Am. Mineral. 1986, 71, 772–778. [Google Scholar]
- 53. Leung L. H., Weaver M. J., Langmuir 1988, 4, 1076–1083. [Google Scholar]
- 54. Barteau M. A., Broughton J. Q., Menzel D., Surf. Sci. 1983, 133, 443–452. [Google Scholar]
- 55. Yokomizo G. H., Louis C., Bell A. T., J. Catal. 1989, 120, 1–14. [Google Scholar]
- 56. Williams C. T., Black C. A., Weaver M. J., Takoudis C. G., J. Phys. Chem. B 1997, 101, 2874–2883. [Google Scholar]
- 57. Tada S., Kikuchi R., Urasaki K., Satokawa S., Appl. Catal. A 2011, 404, 149–154. [Google Scholar]
- 58. Abdel-Mageed A. M., Widmann D., Olesen S. E., Chorkendorff I., Biskupek J., Behm R. J., ACS Catal. 2015, 5, 6753–6763. [Google Scholar]
- 59. Komaya T., Bell A. T., Weng-Sieh Z., Gronsky R., Engelke F., King T. S., Pruski M., J. Catal. 1994, 150, 400–406. [Google Scholar]
- 60. Li J. F., Tian X. D., Li S. B., Anema J. R., Yang Z. L., Ding Y., Wu Y. F., Zeng Y. M., Chen Q. Z., Ren B., Wang Z. L., Tian Z. Q., Nat. Protoc. 2013, 8, 52–65. [DOI] [PubMed] [Google Scholar]
- 61. Williams C. T., Tolia A. A., Chan H. Y. H., Takoudis C. G., Weaver M. J., J. Catal. 1996, 163, 63–76. [Google Scholar]
- 62. Abild-Pedersen F., Andersson M. P., Surf. Sci. 2007, 601, 1747–1753. [Google Scholar]
Associated Data
This section collects any data citations, data availability statements, or supplementary materials included in this article.
Supplementary Materials
As a service to our authors and readers, this journal provides supporting information supplied by the authors. Such materials are peer reviewed and may be re‐organized for online delivery, but are not copy‐edited or typeset. Technical support issues arising from supporting information (other than missing files) should be addressed to the authors.
Supplementary