

Summary
Feruloylation of arabinoxylan (AX) in grass cell walls is a key determinant of recalcitrance to enzyme attack, making it a target for improvement of grass crops, and of interest in grass evolution. Definitive evidence on the genes responsible is lacking so we studied a candidate gene that we identified within the BAHD acyl‐CoA transferase family.
We used RNA interference (RNAi) silencing of orthologs in the model grasses Setaria viridis (SvBAHD01) and Brachypodium distachyon (BdBAHD01) and determined effects on AX feruloylation.
Silencing of SvBAHD01 in Setaria resulted in a c. 60% decrease in AX feruloylation in stems consistently across four generations. Silencing of BdBAHD01 in Brachypodium stems decreased feruloylation much less, possibly due to higher expression of functionally redundant genes. Setaria SvBAHD01 RNAi plants showed: no decrease in total lignin, approximately doubled arabinose acylated by p‐coumarate, changes in two‐dimensional NMR spectra of unfractionated cell walls consistent with biochemical estimates, no effect on total biomass production and an increase in biomass saccharification efficiency of 40–60%.
We provide the first strong evidence for a key role of the BAHD01 gene in AX feruloylation and demonstrate that it is a promising target for improvement of grass crops for biofuel, biorefining and animal nutrition applications.
Keywords: cell wall acylation, ferulic acid, grass evolution, hydroxycinnamates, lignocellulosic feedstock
Short abstract
See also the Commentary on this article by Gómez & McQueen‐Mason, 218: 5–7.
Introduction
Billions of tonnes of biomass, composed principally of secondary cell walls, are produced worldwide by grass crops annually either as the primary product for animal feed or as residues from food crops. Digestibility of this biomass – the ease with which sugar can be released from the cell‐wall polysaccharides – is a key economic target, both for the production of liquid biofuel and for efficiency of digestion by ruminant animals. A major distinguishing feature of grass cell walls and those of other commelinid monocots is the prevalence of two hydroxycinnamates, p‐coumarate (pCA) and ferulate (FA) (Harris & Trethewey, 2010). FA, in particular, is heavily involved in grass cell‐wall cross‐linking reactions. The FA acylates arabinofuranosyl units that are 1→3‐linked to the xylan backbone in arabinoxylan (AX) or glucuronoarabinoxylan (GAX). Ester‐linked FA oxidatively couples in a similar manner to that of lignin monomers (Ralph et al., 1992, 1995), forming cross‐links with other (G)AX chains or with lignin (Ishii, 1997; Ralph et al., 1998, 2004; Ralph, 2010). These cross‐links inhibit digestion by preventing enzyme access and by tightly binding the polysaccharide substrate to nondigestible lignin. Decreasing FA content and thereby FA‐mediated cross‐linking of grass biomass has therefore long been considered a promising target for increasing digestibility (de Oliveira et al., 2015) and this is supported by: in vitro studies showing inhibition by FA of polysaccharide saccharification to sugars (Grabber et al., 1998a,b); natural variation in FA content being inversely correlated with digestibility (Lam et al., 2003; Casler & Jung, 2006); increasing biomass digestibility by heterologous expression of feruloyl esterase (Buanafina et al., 2008); and screens for increased digestibility in mutant populations that frequently identify low ferulate lines (e.g. Hirano et al., 2017).
Candidate genes involved in feruloylation of AX were first identified by differential expression between grasses and dicots (Mitchell et al., 2007) as residing within a clade of genes in the BAHD acyl‐coenzyme A (CoA) transferase superfamily (there named ‘PF02458 family’ after the characteristic PFAM domain). The most likely candidate within this clade for involvement in AX feruloylation based on absolute expression level and coexpression was identified as the rice gene LOC_Os01g09010, which we call here OsBAHD01. There are orthologs for this gene in all sequenced commelinid monocots; in Brachypodium distachyon (Brachypodium), Setaria viridis (Setaria) and maize there is a one‐to‐one ortholog (Fig. 1a). Suppression of OsBAHD01 by RNA interference (RNAi) in rice was correlated with decreased cell‐wall FA (Piston et al., 2010); however, the FA decrease was variable between tissues and generations (largest decrease was 27% in stems of one line) and the construct was designed to suppress four other closely related genes as well as BAHD01. There is now strong evidence that one of these (AT10) is specifically responsible for the acylation of AX by pCA rather than FA (Bartley et al., 2013). pCA is a hydroxycinnamate, like FA, but crucially does not readily oxidatively couple in vivo and therefore does not participate extensively in cross‐links, although it may facilitate lignin polymerization (Ralph, 2010). Others genes in the clade may also be responsible for AX feruloylation; RNAi suppression and overexpression of BdBAHD05 (Fig. 1A; BdAT1 in the nomenclature of Bartley et al. (2013)) induced decreases and increases, respectively, in FA in transgenic Brachypodium lines (Buanafina et al., 2016), although the effects were relatively small (lines with the largest effects showed a c. 25% decrease for RNAi, c. 15% increase for overexpression). Effects on cell‐wall FA or pCA due to manipulation of gene expression could be indirect, for example, due to perturbation of metabolite concentrations; this interpretation is made more plausible for the Piston et al. (2010) and Buanafina et al. (2016) studies by the modest size of effects on FA. Alternatively, they may be directly responsible for AX feruloylation, but compensatory mechanisms may operate or there may be gene redundancy within the clade. Several of the genes are now known to encode enzymes that acylate monolignols rather than AX by FA or pCA (Withers et al., 2012; Petrik et al., 2014; Karlen et al., 2016; Sibout et al., 2016), leaving BAHD05 as putatively functionally redundant with BAHD01 and three others (BAHD02, BAHD03, BAHD04; Fig. 1a) with no functional indications.
Figure 1.
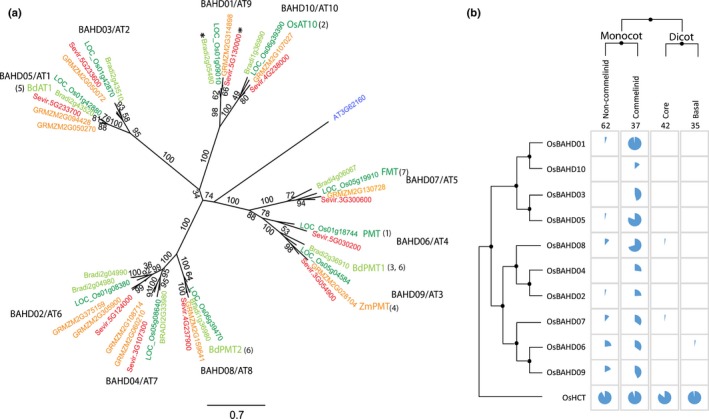
(a) Phylogenetic tree of candidate clade of BAHD genes (Mitchell et al., 2007) showing BAHD names for each branch from Molinari et al. (2013) and alternative AT names from Bartley et al. (2013). All genes from Arabidopsis, rice, Brachypodium, maize and Setaria in sub‐clade A are shown. Support for the topology is shown as a percentage of bootstrap runs. Named genes have evidence on function from: 1, Withers et al. (2012); 2, Bartley et al. (2013); 3, Petrik et al. (2014); 4, Marita et al. (2014); 5, Buanafina et al. (2016); 6, Sibout et al. (2016); 7, Karlen et al. (2016). Asterisks mark the genes we studied here. (b) Distribution of orthologs present in the 1KP project (Matasci et al., 2014) to the candidate rice genes and to related OsHCT genes. Proportions of species (out of the total number shown at the top of the grid) that have orthologs are shown as blue pie chart slices.
S. viridis is an emerging monocot plant model for molecular and genetic studies. It is a short, fast‐growing, C4 plant and its genome sequence is fully available (Bennetzen et al., 2012). It is the same sub‐family Panicoideae as sorghum, maize and sugarcane. In addition, S. viridis is amenable to genetic transformation through Agrobacterium tumefaciens (Martins et al., 2015). Brachypodium is a model C3 grass species in the same BOP clade of Poaceae as rice, wheat and Lolium (Vogel et al., 2010).
Here we show the effects of suppressing SvBAHD01 and BdBAHD01 expression in Setaria and Brachypodium, respectively. Although the effects on cell‐wall FA in Brachypodium are of similar magnitude to those reported previously for effects of BAHD suppression, those in Setaria are much larger and more consistent. We investigate possible reasons for this by examining the RNA‐seq in transgenics of the two species. We also characterize the effects on cell walls, growth and digestibility of biomass in the Setaria transgenics and discuss the likely role of BAHD01 genes.
Materials and Methods
Phylogenetic analysis
We downloaded protein sequences from Phytozome 12 (Goodstein et al., 2012) for the rice and Brachypodium BAHD candidate sequences identified (Mitchell et al., 2007; Molinari et al., 2013) and their orthologs in maize and Setaria. The BdBAHD04 gene model is incorrect in Brachypodium v3 as shown by strand‐specific RNA‐seq so we replaced it with the v1 model. We performed alignment then optimization of topology, parameters and branch length followed by bootstrapping as previously described (Pellny et al., 2012) but using PhyML3.0 (Guindon et al., 2010). To identify orthologs in the 1,000 Plants (1KP) database of plant transcriptomes (Wickett et al., 2014), we identified all hits with E < 10−5 using nucleotide Blast (Blastn) (Matasci et al., 2014) with rice candidate genes as queries; these were downloaded and assigned as ortholog of top rice hit if the bit score was > 100 using translated nucleotide searches against the rice proteome with Tera‐Blastp on the DeCypher ® platform.
Plasmid construct and generation of transgenic plants
For silencing of BAHD01 in both Setaria and Brachypodium, we selected a 254 bp sequence with identical matches to both SvBAHD01 and BdBAHD01 (Supporting Information Fig. S1A) and no off‐target identical matches of > 16 bp. Inverted repeats of this 254 bp flanking the maize Adh2 intron were synthesized by Genscript (Piscataway, NJ, USA), and subcloned into the transformation vector A224p6i‐U‐Gusi, using standard cloning techniques, giving rise to the plasmid plTY73. In plTY73, the BAHD01 RNAi cassette is under control of the maize ubiquitin promoter. We transformed Brachypodium inbred line Bd21 and S. viridis accession A10.1 following published protocols (Vogel & Hill, 2008) and (Martins et al., 2015), respectively.
RNA sequencing and differential expression analysis
For Setaria, mRNA of stem tissue from three replicate plants was obtained using an NEBNext® RNA Library Prep Set Kit for Illumina®. Libraries were made using an NEB Next® Ultra RNA Library Prep Kit and sequenced on a HiSeq4000 using TruSeq SBS v3 kit (Illumina) by GenOne Biotechnologies. For Brachypodium, total RNA was isolated from stems of a minimum of three replicate plants using the protocol of Chang et al. (1993). Libraries were made using a Ion Total RNA‐Seq Kit v2, templates were prepared using the Ion PITM Template OT2 200 Kit V2 and were sequenced using the Ion PITM Sequencing 200 Kit v2 with an Ion PITM Chip Kit v2 on an Ion ProtonTM System. All sequencing equipment and reagents were from Thermo Fisher Scientific and were used following the manufacturer's instructions. For both Setaria and Brachypodium, reads were mapped to reference transcriptomes from Phytozome 11.0 using the BWA‐MEM algorithm (Li & Durbin, 2010) with default parameters for Setaria and accepting forward reads only for the strand‐specific reads generated by Ion Proton sequencing for Brachypodium. Expression measures FPKM (fragment per kilobase per million mapped reads) and CPM (counts per million) were generated by eXpress (Roberts & Pachter, 2013); global analysis to identify all differentially expressed genes was performed using the edgeR package in R (Robinson et al., 2010). All reads and protocols have been deposited in the ArrayExpress public database under accession E‐MTAB‐5648 for Setaria and E‐MTAB‐5649 for Brachypodium.
Quantification of cell‐wall‐bound hydroxycinnamate content
Cell‐wall‐bound hydroxycinnamate (HCA) content was determined essentially as described (Freeman et al., 2017) in labs at Embrapa Agroenergy (Supporting Information Table S1; Fig. S1C) and Rothamsted (Figs 2, S1D; Table S2) and with some variations in protocol as described in Methods S1.
Figure 2.

SvBAHD01 gene expression (a) and ester‐linked HCA and lignin content (b–d) of cell walls in leaves and stems of Setaria control (NT) and T3 plants from the 17.3 and 18.1 RNAi‐silenced lines (n = 3; error bars ± SEM; significance of difference of transgenic from control indicated if difference in means > least significant difference from ANOVA at: *, P < 0.05; **, P < 0.01; ***, P < 0.001).
Determination of HCA conjugates released by mild acidolysis
Alcohol‐insoluble residue (AIR) was prepared using extractions as described for cell‐wall‐bound HCA and then treated with 1.2 ml 50 mM trifluoroacetic acid (TFA) for 4 h at 99°C with agitation at 750 rpm. After centrifugation for 10 min at 16 000 g, two 500 μl aliquots of supernatant were freeze‐dried. The pellet was washed twice with water and freeze‐dried. Released HCA conjugates from one 500 μl aliquot of supernatant were dissolved in 250 μl 50% methanol : 0.1% formic acid and 10 μl separated as for cell‐wall‐bound HCA except using a binary gradient with methanol (solvent A) and 0.1% formic acid (solvent B) with the following gradient: isocratic 100% B, 0–1 min; linear 100% to 0% B, 1–21 min; isocratic 0% B, 21–23 min; linear 0% to 100% B, 23–28 min with a flow rate of 1 ml min−1. (We found this column provided much improved resolution over that used by Bartley et al. (2013)). For mass spectrometry analysis samples were diluted 1 : 8 and 10 μl was analyzed on a 4000 QTRAP LC‐MS/MS system (SCIEX, Framingham, MA, USA) after HPLC using an Agilent 1200 fitted with a 100 μl sample loop. The probe was vertically positioned 11 mm from the orifice and charged at −4500 V. Temperature was held at 750°C, GS1 was set at 20 psi, GS2 at 20 psi, curtain gas at 20 psi and the interface heater was engaged. Multiple reaction monitoring (MRM) transitions were derived from standards, previously published data (Quemener & Ralet, 2004; Bartley et al., 2013) and experimentally. Declustering potential, entrance potential, collision energy and collision cell exit potential were set on an analyte‐dependent basis (Table S3). Data were collected with Analyst (SCIEX) software and integrated using the Intelliquant algorithm. Peaks for individual analytes were assigned based on their MRM transitions.
Quantitation of Ara‐FA and Ara‐pCA
Samples from mild acidolysis were run on a Shimadzu Prominence HPLC device with a photo‐diode array detector using the same column and protocol as for LC‐MS. Areas for peaks (absorbance at 280 nm) at retention times corresponding to Ara‐FA and Ara‐pCA ions show the same relative effects as ion counts across samples (Fig. S2). Peak area relative to internal standard peak area was used to quantify the peaks, using calibrations of corresponding free HCA with pure standards. Values were multiplied by a correction factor for the difference in absorbance of Ara‐HCA from free HCA, derived as follows. Fractions for Ara‐FA and Ara‐pCA peaks were collected and split into two equal samples, one of which was saponified, the other untreated. They were then re‐run on the HPLC device and correction factors were calculated as (peak area free HCA)/(peak area Ara‐HCA) giving values of 0.92 and 0.62 for pCA and FA, respectively. This quantitation of Ara‐HCAs was conducted in the Rothamsted lab to give the data shown in Fig. 3. The same procedure was used in Embrapa Agroenergy to give relative amounts in Fig. S3, but using a Waters ACQUITY UPLC device (Milford, MA, USA). To determine total ester‐linked HCA following mild acidolysis (Table S4), aliquots of supernatant and the pellet were saponified, dried under vacuum, resuspended in 250 μl 50% methanol : 0.1% formic acid, and HCA content was quantified as in Freeman et al. (2017) but using the HPLC method above used to separate HCA conjugates.
Figure 3.
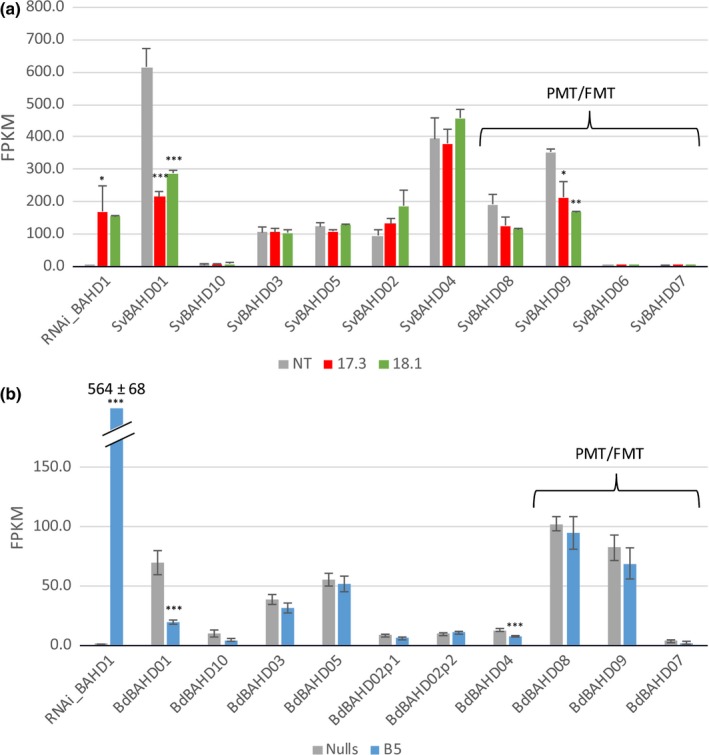
RNA‐seq analysis of BAHD gene expression in (a) Setaria SvBAHD01 RNAi lines and (b) Brachypodium BdBAHD01 RNAi lines. Genes associated with monolignol acylation (PMT and FMT) are indicated. Transcript abundance is measured as fragment per kilobase per million mapped reads (FPKM; n = 3; error bars ± SEM; significance of difference of transgenic from control indicated if difference in means > least significant difference from ANOVA at: *, P < 0.05; **, P < 0.01; ***, P < 0.001).
Cell wall characterization by solution‐state two‐dimensional NMR
We characterized the cell walls of Setaria samples without fractionation using solution‐state two‐dimensional (2D) NMR following the procedure described by Kim & Ralph (2010); full details are given in Methods S1.
Enzymatic saccharification assay
Samples of leaf and stem tissues of the lines Ev.17.3, Ev.18.1 and nontransfromed (NT) at the reproductive stage were ground in a ball mill for 30 s and then subjected to enzymatic saccharification with a commercially available enzyme preparation CellicCtec2 (Novozymes, Lyngby, Denmark) at 10 filter paper cellulase units g−1 biomass. For biomass pre‐treatment, 0.25% H2SO4 was added and samples were incubated at 120°C and 3.5 bar for 30 min. The enzymatic hydrolysis (EH) experiments were performed using 2 ml Eppendorf tubes with 2% (w/v) biomass in 100 mM phosphate buffer, pH 5.0, and 0.1% sodium azide as an antimicrobial agent. The reaction was incubated in a Thermomixer microplate incubator (Eppendorf, Germany) operated at 50°C and agitation speed of 1000 rpm. Samples were withdrawn after 6 h, and the hydrolysis was stopped by heating the samples at 80°C for 5 min, followed by centrifugation at 10 000 g for 15 min. EH was measured by quantification of the glucose released according to the glucose oxidase assay (Kit MAK097; Sigma‐Aldrich, St Louis, MO, USA) according to the manufacturer's instructions .
Other methods
Procedures based on published methods for determination of gene expression (Martins et al., 2016), cell‐wall monosaccharides (Sluiter et al., 2012), lignin (Moreira‐Vilar et al., 2014), growth conditions, biomass and stem microscopy are described in detail in Methods S1.
Results
Identification of candidate BAHD gene for cell‐wall feruloylation and generation of silencing lines in Setaria and Brachypodium
We analyzed the phylogeny of BAHD genes in the candidate clade (sometimes called ‘Mitchell Clade’ (Bartley et al., 2013)) for maize, Brachypodium, Setaria, rice and Arabidopsis (Fig. 1a). (Sub‐clade B genes that show low expression, much less conservation between species and no co‐expression with cell‐wall genes (Molinari et al., 2013) are omitted.) Of the genes without direct functional evidence, BAHD01 is a good candidate for cell‐wall feruloylation (Mitchell et al., 2007; Bartley et al., 2013; Molinari et al., 2013). Orthologs of OsBAHD01 are present in nearly all commelinid monocots, but are almost completely absent from transcriptomes of other angiosperms present in the 1KP database (Matasci et al., 2014; Fig. 1b), consistent with the taxonomic distribution of (G)AX feruloylation (Harris & Trethewey, 2010). We therefore selected Sevir.5G130000 (SvBAHD01) and its ortholog Bradi2g05480 (BdBAHD01) as targets for suppression. We created a construct with an RNAi hairpin designed to suppress both SvBAHD01 and BdBAHD01 under control of a constitutive maize ubiquitin promoter (Fig. S1A). We transformed Setaria with this construct, obtaining seven independent lines silencing SvBAHD01 by 61–99% in leaves that showed decreases in FA content of 39–60% (Table S1). We performed segregation analysis through two generations (T2 plants), obtaining four independent stable homozygous lines compatible with a single locus for the SvBAHD01 RNAi transgene (Table S1). We observed decreased FA contents in the cell walls of leaf and stem tissues in these transgenic lines (Fig. S1C). We selected two of the best performing lines, 17.3 and 18.1, for further detailed analysis. We also generated six independent homozygous BdBAHD01 RNAi lines in Brachypodium; these showed only small effects on FA and pCA (Table S2) and we selected two of these for further analysis.
Cell‐wall HCA contents of SvBAHD01 RNAi Setaria plants and BdBAHD01 Brachypodium RNAi plants
To test the stability of BAHD01 gene silencing and phenotype inheritance of altered HCA composition in the cell walls of Setaria, we analyzed T3 generation transgenic plants from lines 17.3 and 18.1. Silencing levels were maintained in these plants; SvBAHD01 expression compared with nontransfromed (NT) plants from lines 17.3 and 18.1 were 82% and 64% lower in leaves and 90% and 70% lower in stems, respectively (Fig. 2a). We observed a similar reduction in FA contents in the cell walls of stem as seen in the T0 and T2 generations, corresponding to > 60% decrease compared to NT plants, but the decrease in FA in leaves was smaller than in T2 (Fig. 2b). We found that ester‐linked pCA was more than double in the cell walls of leaves for lines 17.3 and 18.1 compared to control, whereas in the cell walls of stems we found only a small increase (Fig. 2b). We also quantified the amounts of five different forms of dehydrodiferulates (diFAs); in leaves, the 8–8′‐diFA coupled forms (8‐8′, 8‐8′ THF and 8‐8′ AT) were substantially decreased, with other diFAs unaffected (Fig. 2c). By contrast, all diFAs except the aryltetralin form of 8–8′‐diFA (8‐8′ AT) were decreased in stems (Fig. 2c). Dimerization expressed as sum of all diFAs over total FA was unaffected in leaves but highly significantly (P < 0.001) increased in stems in both lines (NT: 25%, 17.3: 37%, 18.1: 35%). We found lignin content, as assessed by the acetyl bromide method, to be unchanged in stems of SvBAHD01 RNAi plants but with a modest increase in leaves (Fig. 2d).
We also analysed two Brachypodium BdBAHD01 RNAi lines for HCA content; these also showed small (10–20%), but significant, decreases in FA and diFA content of stem cell walls (Fig. S1E).
Transcriptome analysis of transgenic SvBAHD01 and BdBAHD01 RNAi plants
We analyzed the RNA‐seq transcriptomes from stems of T3 SvBAHD01 and BdBAHD01 RNAi plants to diagnose the difference in magnitude of the effects of the transgenes in Setaria and Brachypodium, and also to test for off‐target and pleiotropic effects. We observed similar relative decreases in expression of BdBAHD01 in Brachypodium line B5 (78%) as of SvBAHD01 in Setaria lines 17.3 and 18.1 (65% and 53%) (Fig. 3). However, expression of SvBAHD01 was much greater than that of BdBAHD01 in control lines, both in absolute FPKM values and, importantly, relative to similar genes (Fig. 3), some of which may be functionally redundant such as BAHD05 (Buanafina et al., 2016). Greater relative expression of redundant genes in Brachypodium could explain the much smaller effect of BdBAHD01 suppression compared to SvBAHD01 suppression. We found no evidence of a compensatory increase in expression of any BAHD genes in response to BAHD01 suppression. SvBAHD09, an ortholog of BdPMT1, was significantly down‐regulated (Fig. 3); because SvBAHD09 and the RNAi construct shared little identity (longest identical sequence is 12 bp), we interpret this as a pleiotropic effect of suppressing SvBAHD01. Many other genes were also significantly differentially regulated due to pleiotropic effects in both 17.3 and 18.1 (Notes S1), including upregulated genes associated with negative regulation of transcription and protein synthesis and downregulated genes associated with cytoskeleton and xylan synthesis and remodeling.
As the effects of BAHD01 suppression were much greater in Setaria than in Brachypodium, we focused on characterizing the SvBAHD01 RNAi lines in more detail.
Characterization of xylan in SvBAHD01 RNAi plants
Bound FA and diFA are ester‐linked to arabinofuranosyl units attached to GAX of grass cell walls (Scheller & Ulvskov, 2010); we found no consistent effect on Ara and Xyl content of AIR (predominantly derived from GAX) in SvBAHD01 RNAi plants (Table S5). We analysed Ara‐HCAs using mild acidolysis with TFA of AIR, which preferentially breaks glycosidic Ara‐(1→3)‐Xyl linkages in GAX, but can break other linkages releasing GAX oligosaccharides and free HCAs, and can chemically modify the Ara‐HCA (Saulnier et al., 1995; Bartley et al., 2013). We developed a novel method which identifies peaks from LC‐MS for Ara‐FA, Ara‐pCA and minor peaks with m/z of parent/daughter ions 649/589 and 457/193 (Table S3; Fig. 4a). These minor peaks are consistent with Ara‐diFA‐Ara and Xyl‐Ara‐FA (Table S3), being derived, respectively, from a xylan‐diFA‐xylan cross‐link and from the 2‐β‐Xylp‐(5‐feruloyl)‐Araf decoration of xylan that is common in grasses (Wende & Fry, 1997).
Figure 4.
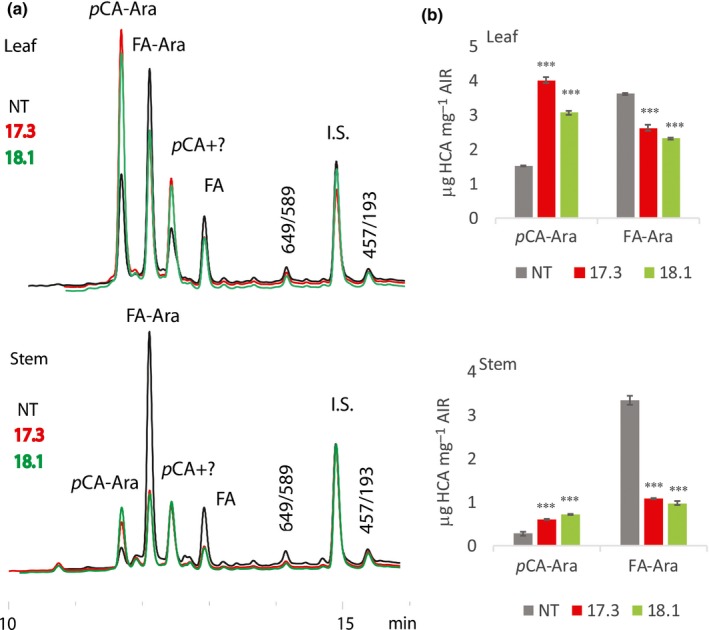
HCA conjugates in supernatant following mild acidolysis of Setaria alcohol‐insoluble residue (AIR). (a) Parts of representative HPLC chromatograms showing UV absorption. Major peaks for p‐coumarate (pCA)‐Ara and ferulate (FA)‐Ara were identified by LC‐MS (Supporting Information Fig. S2; Table S3). pCA co‐elutes with an unknown UV‐absorbing compound. Minor peaks are labeled according to their dominant parent/daughter ion m/z from LC‐MS; 649/589 and 457/193 are probably Ara‐diFA‐Ara and Xyl‐Ara‐FA, respectively. (b) Mean pCA‐Ara and FA‐Ara contents expressed as μg HCA equivalent per mg AIR estimated from similar chromatograms as shown in (a) (n = 3; error bars ± SEM; significance of difference of transgenic from control indicated if difference in means > least significant difference from ANOVA at: ***, P < 0.001).
Using peak areas in ultraviolet absorbance spectra from this method, we found c. 30% and c. 70% decreases in Ara‐FA caused by SvBAHD01 silencing in leaves and stems, respectively (Fig. 4B). This Ara‐FA accounts for c. 40% of the FA monomer in all samples (Table S4), so relative effects are similar to those for FA (Fig. 2). (The remainder of the FA monomer in TFA‐treated samples is present in other forms; Tables S4, S5.) Ara‐pCA was increased after SvBAHD01 silencing to about double in both leaves and stems, although the absolute amount is low in stems (Fig. 4b).
To test the stability of the silencing, we repeated analyses of Ara‐HCAs in T4 generation plants (Fig. S3). We observed essentially the same effect of SvBAHD01 silencing on Ara‐FA as in T3: a c. 65% decrease in stems and c. 35% decrease in leaves. The increases in Ara‐pCA were more variable, ranging from 30% to 150% (Fig. S3).
Total ester‐linked pCA from cell walls comprises Ara‐pCA and lignin‐pCA, with lignin‐pCA being much more abundant in stems than in leaves. Lignin‐pCA is enriched in the pellet fraction following mild acidolysis; we found increases in pCA in this fraction in leaves of SvBAHD01 RNAi T3 and T4 plants (Table S4) to be of similar magnitude to the Ara‐pCA increases (Figs 4, S3), but in stems the increases were inconsistent and smaller. This suggests that lignin‐pCA was increased similarly to Ara‐pCA in leaves but not stems of SvBAHD01 RNAi plants.
2D‐NMR characterization of cell walls in SvBAHD01 RNAi plants
To gain information on the overall aromatic composition of the unfractionated cell walls in the SvBAHD01 silenced plants, we analyzed them using gel‐state 2D‐NMR (Kim & Ralph, 2010). We observed clear differences in the spectral fingerprints between control and SvBAHD01 RNAi plants in both leaves and stems, showing the expected decrease in FA peaks (Fig. 5). The magnitude of the decrease as estimated from the normalized integrals shown in Fig. 5 (c. 50%) is similar to that estimated from biochemistry (c. 60%; Fig. 2) for stems but much greater in leaves (c. 70% for 2D‐NMR compared to c. 10% in Fig. 2). The 2D‐NMR values are on a lignin basis and it is known that the integrals of small mobile components such as FA and pCA relative to those for relatively immobile internal lignin units are significantly over‐represented and variable in this methodology. The changes in FA : pCA ratios show better agreement between the 2D‐NMR and biochemical methods, −58% and −65% in leaves, and −71% and −73% in stems respectively. The smaller effect of SvBAHD01 silencing on this ratio in roots (−33%) compared to other tissues is also consistent with the smaller effect we saw on FA content of roots using the biochemical assay (Fig. S1C).
Figure 5.
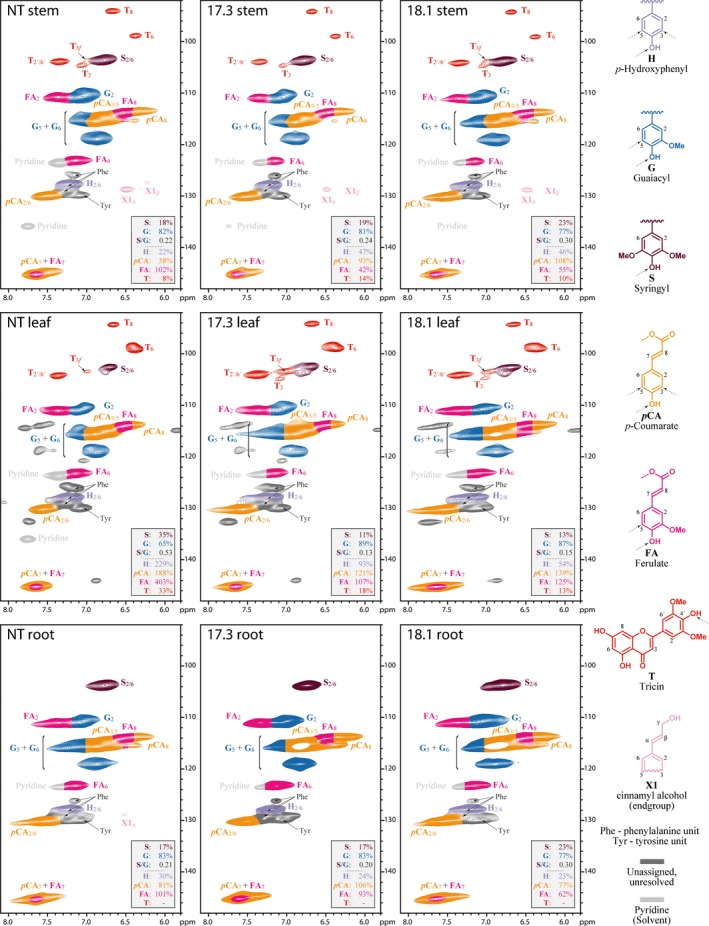
2D‐NMR heteronuclear single‐quantum coherence (HSQC) partial spectra of stem, leaf and root tissues from the WT control (NT) and the two transgenic lines (17.3 and 18.1) of Setaria. Color coding of the contours matches that of the assigned structures; where contour overlap occurs, the colorization is only approximate. The analytical data are from volume integrals of correlation peaks representing reasonably well‐resolved (except for H) C/H pairs in similar environments; thus, they are from S 2/6, G 2, H 2/6, FA 2, pCA 2/6 and T 2′/6′, with obvious correction for those units that have two C/H pairs per unit. All relative integrals are on a G + S = 100% basis; H‐units are over‐quantified due to an overlapping peak from protein phenylalanine (Phe) units (Kim et al., 2017).
Plant biomass, seed yield, saccharification and stem microscopy in SvBAHD01 RNAi plants
We observed no significant changes in aerial biomass associated with the SvBAHD01 RNAi plants (Fig. 6a), but there was a significant small (8%) decrease in seed size (Fig. 6b) and an apparent increase in seed number in line 18.1 (Fig. 6c). We assessed ease of saccharification of biomass from transgenic plants pretreated or not with 0.25% H2SO4. Levels of glucose released by transgenic plants were significantly higher compared with NT plants, both for treated and for nontreated samples, in both tissues, indicating a more efficient saccharification of SvBAHD01 RNAi plant biomass (Fig. 6d). In cross‐sections of stems, the walls of sclerenchyma and parenchyma cells of SvBAHD01 RNAi plants were not as thick as those of control plants (Fig. 6e). We also observed a change in staining with phloroglucinol in interfascicular sclerenchyma, which were pale yellow in SvBAHD01 RNAi plants in contrast to bright yellow in controls (Fig. 6e i–iii), possibly related to the presence of benzaldehydes (Akin, 1990). Both staining with auramine O (Fig. 6e, iv–vi) and autofluorescence (Fig. 6e, vii–ix) of vascular bundle cells and interfascicular sclerenchyma were somewhat decreased, consistent with decreased cell wall phenolic content.
Figure 6.
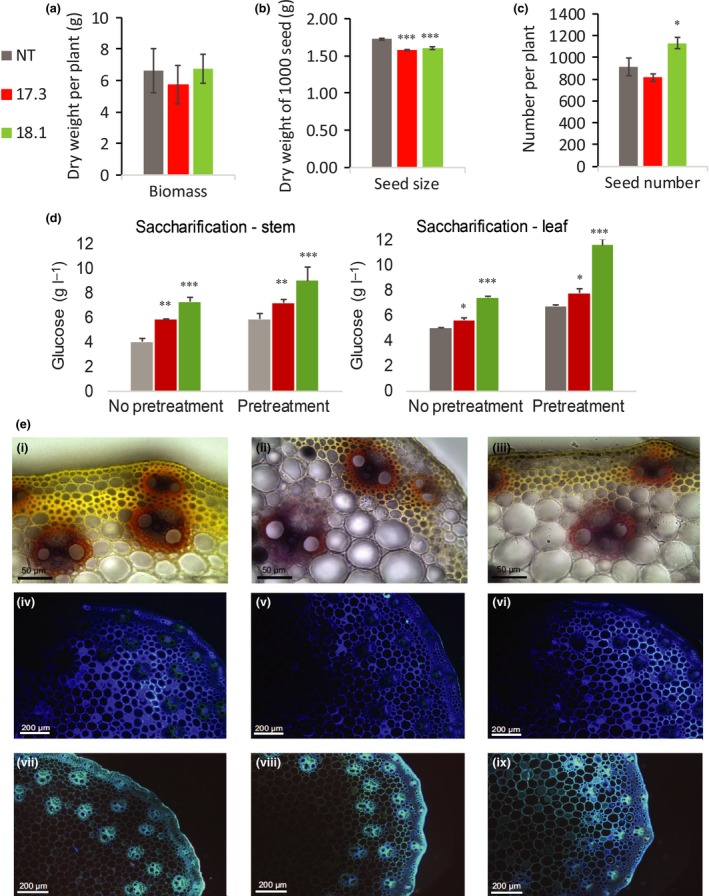
Biomass (a), seed size (b), seed number (c), saccharification (d) and stem morphology (e) of Setaria SvBAHD01 RNAi plants. (a–d) Means ± SEM from 10 (a, b) or five (c, d) replicate plants, significance of difference of transgenic from control indicated if difference in means > least significant difference from ANOVA at: *, P < 0.05; **, P < 0.01; ***, P < 0.001. (e) Representative stem sections from NT (i, iv, vii), 17.3 (ii, v, viii) and 18.1 plants (iii, vi, ix) stained with phloroglucinol (i–iii), auramine O (iv–vi) and showing autofluorsence (vii–ix).
Discussion
BAHD01 was identified as a candidate for involvement in the feruloylation of GAX 10 yr ago, along with other genes in the same clade (Mitchell et al., 2007). There was some early evidence for this role for BAHD01 from RNAi suppression of several genes together (BAHD01, 02, 04, 08 and 10) in rice in which decreases of FA of 10–30% were observed (Piston et al., 2010). However, this construct simultaneously suppressed expression of other genes including one since implicated in the addition of pCA, not FA, to GAX (BAHD10/AT10; Bartley et al., 2013) and an ortholog of BdPMT2 (BAHD08) putatively involved in addition of pCA to lignin (Sibout et al., 2016). We are not aware of any reports of knock‐out mutants for BAHD01, nor of in vitro activity assays for the encoded protein, both of which have been reported for the closely related lignin PMT genes (Withers et al., 2012; Marita et al., 2014; Petrik et al., 2014). Characterization of this gene has therefore lagged behind that of PMT despite the importance of feruloylation in determining properties of grass biomass.
Moderate changes, which vary between generations (Piston et al., 2010; Buanafina et al., 2016) in cell wall FA due to suppression and overexpression of BAHD genes, can be interpreted as secondary effects; however, the large, consistent effects that we observed from suppressing SvBAHD01 on FA content in Setaria generations T0, T2, T3 and T4 (Table S1; Figs 2, 4, S1C, S3) make this interpretation less plausible. Our results on the effect on cell‐wall FA of suppressing BdBAHD01 in Brachypodium were more like these previous reports in magnitude (Fig. S1E). Our transcriptome analysis offers one possible explanation for the greater magnitude of the effect in Setaria than in Brachypodium; SvBAHD01 is more highly expressed than BdBAHD01 relative to other candidate BAHD genes (Fig. 3). In particular, BdBAHD05 may have the same function as BdBAHD01, as suppression and overexpression of this gene induced respective decreases and increases in FA (Buanafina et al., 2016). Of total BAHD01 and BAHD05 transcript abundance in stems of control plants, SvBAHD01 accounts for 83% in Setaria whereas BdBAHD01 only accounts for 56% in Brachypodium. There is no evidence of a compensatory upregulation of other BAHD transcripts in response to BAHD01 suppression in either species (Fig. 3). The relative lack of effect of BdBAHD01 suppression may therefore be due to greater redundancy in Brachypodium, or simply that the suppression was insufficient to limit feruloylation in this species; identification of BdBAHD01 knock‐out mutants would address this possibility.
Other genes within the phenylpropanoid pathway leading to monolignol biosynthesis were not differentially expressed in SvBAHD01 RNAi stems (Notes S1) and total lignin was unaffected in stems (Fig. 2d). We found evidence from 2D‐NMR of decreased S/G ratio in stems but not leaves (Fig. 5); estimates of H lignin units are not reliable from this method due to overlapping protein signals (Kim et al., 2017). We assumed, as is common, that all FA and diFA released by mild alkali from AIR is ester‐linked to arabinofuranose on GAX. In fact, as monolignol ferulates are now firmly established monomers in the lignification of monocots, such compounds could in principle also result from this lignin source; however, as ferulates and diferulates are well incorporated into lignins by radical coupling reactions, the extremely low released concentrations of such components can be neglected here (Karlen et al., 2016). This assumption was supported by quantitation of Araf‐FA released by mild acidolysis from SvBAHD01 RNAi lines (Fig. 4). We observed similar relative effects of SvBAHD01 silencing as for total FA, decreases of 65–65% from stems and 30–35% from leaves in T3 (Fig. 4B) and T4 (Fig. S3) generation plants. An unexpected result was the increase in pCA observed in leaves, but not stems, of both SvBAHD01 RNAi lines (Fig. 2b). There are two forms of ester‐linked pCA in grass cell walls: those acylating Araf on GAX and those acylating the lignin sidechain (Ralph, 2010). Araf‐pCA content more than doubled due to SvBAHD01 suppression in both leaves and stems (Fig. 4b), but this only accounts for a proportion of the total pCA in leaves, and a smaller proportion in stems. BAHD genes such as OsAT10 (our BAHD10) are probably responsible for the Araf‐pCA whereas the BAHD PMT genes are responsible for the addition of pCA to monolignols, and hence its appearance on lignin, but none of the BAHD genes showed significant upregulation in SvBAHD01 RNAi plants (Fig. 3). One possible explanation for the increased cell wall pCA is that the blocking of addition of FA to Araf results in a build‐up of FA‐CoA and pCA‐CoA substrates; the increased pCA‐CoA concentration results in more pCA addition to GAX in both stems and leaves. There also seems to be increased lignin‐pCA in leaves of SvBAHD01 RNAi plants; in stems, SvBAHD09 transcript, a putative PMT gene, was downregulated (Fig. 3), which could be a regulatory response to prevent excessive addition of pCA to lignin.
All BAHD proteins are believed to be localized to the cytosol and this has been confirmed using a green fluorescent protein (GFP) fusion of TaBAHD01 for the wheat ortholog (J. Freeman, unpublished), but feruloylation of GAX takes place within the Golgi (Myton & Fry, 1994; Fry, 2004). It has therefore been suggested (Buanafina, 2009) that a cytosolic precursor such as UDP‐Araf is the acceptor for FA or pCA, as their CoA thioesters, mediated by these BAHD enzymes; as UDP‐Araf is generated in the cytosol by UDP‐arabinopyranose mutase, this is feasible. The feruloylated UDP‐Araf would then pass into the Golgi by a transporter (possibly encoded by grass homologs of the recently identified UDP‐Araf transporters in Arabidopsis; Rautengarten et al., 2017) and FA‐Araf would be transferred onto GAX, probably by GT61 enzymes that are responsible for arabinosylation of xylan (Anders et al., 2012). In support of this model, RNAi Brachypodium lines with decreased mutase (Rancour et al., 2015) and the rice xax1 mutant which carries a knockout for a GT61 family gene (Chiniquy et al., 2012) both showed substantial decreases in cell wall FA; in contrast to our results for SvBAHD01 suppression, they also both showed decreased cell‐wall pCA. This may suggest that specificity for FA or pCA is conferred exclusively by the BAHD enzymes in this pathway.
Biomass production was unaffected by SvBAHD01 suppression (Fig. 6a) and ease of saccharification was increased (Fig. 6d). However, there were some pleiotropic effects; the many differentially regulated transcripts in the SvBAHD01 RNAi lines suggest shifts in development, protein synthesis and increased stress responses (Notes S1) and there was significantly decreased seed size (Fig. 6b) and changes in stem morphology (Fig. 6e). Ferulate‐mediated cross‐linking is fundamental to both primary and secondary cell walls in grasses and it is not surprising that constitutive suppression has downstream consequences; directing the suppression to secondary cell walls specifically (as achieved elsewhere; Yang et al., 2013) might decrease pleiotropic effects whilst maintaining a benefit in digestibility. The large increase in biomass saccharification that we observed in SvBAHD01 RNAi plants (Fig. 6d) indicates that BAHD01 represents a promising target to increase the suitability of grass biomass for biofuel and animal feed applications. The effect appears relatively specific to affecting FA linked to GAX but not total lignin (Fig. 2d), compared with modification of genes responsible for earlier steps in the phenylpropanoid pathway (Bouvier d'Yvoire et al., 2013). We would predict that it results in fewer covalent linkages between the polysaccharide and lignin components of cell walls (as well as between polysaccharides themselves), allowing greater ease of separation, for example, for biorefining, but this remains to be demonstrated. Indeed, it has been demonstrated that, in a model system, the rate and extent of wall hydrolysis by fungal enzymes is affected by ferulate‐mediated polysaccharide cross‐linking (Grabber et al., 1998a) and even more by lignin‐polysaccharide cross‐linking (reviewed by Ralph et al., 1998; Ralph, 2010). Greater understanding of the role of BAHD01 and related genes will help to identify opportunities for grass crop improvement and elucidate the importance of cell‐wall feruloylation in grass evolution.
Author contributions
H.B.C.M., J.F., R.A.C.M. and T.K.P. planned and designed the research. W.R.d.S., P.K.M., J.F., T.K.P., L.V.M., B.L.S., F.V., A.P.R., B.A.D.B.d.C., A.K.K., P.A.d.O., R.B.C., T.F.P., D.C.I.M., R.M., O.F‐F., W.D.d.S., R.T., F.M.S., D.d.C., M.G., M.R.B., M.A.S.T., J.R., R.A.C.M. and H.B.C.M. performed research and/or analyzed the data. R.A.C.M. wrote the manuscript with contributions from H.B.C.M., J.R., P.K.M. and W.R.d.S.
Supporting information
Please note: Wiley Blackwell are not responsible for the content or functionality of any Supporting Information supplied by the authors. Any queries (other than missing material) should be directed to the New Phytologist Central Office.
Fig. S1 RNAi construct, and HCA content of Brachypodium and Setaria RNAi plants.
Fig. S2 LC‐MS chromatograms and correlations of UV absorbance and MRM ion count peak areas.
Fig. S3 HCA‐Ara content for T4 Setaria samples.
Table S1 SvBAHD01 silencing, FA content and segregation in Setaria SvBAHD01 RNAi lines
Table S2 HCA content of Brachypodium and Setaria samples
Table S3 MRMs and identities of most prevalent ions released from AIR samples by mild acidolysis
Table S4 HCA content of saponified samples following mild acidolysis from Setaria plants
Table S5 Monosaccharide composition of cell walls from Setaria plants
Methods S1 Procedures for plant growth, microscopy and determination of gene expression, cell‐wall monosaccharides, lignin and biomass.
Notes S1 Differentially expressed transcripts in SvBAHD01 RNAi stems from RNA‐seq.
Acknowledgements
We thank Hoon Kim (University of Wisconsin) for help with assigning the whole‐cell‐wall NMR spectra and Dr Steve Hanley (Rothamsted Research), for Brachypodium RNA‐seq library preparation and sequencing. We acknowledge funding from grants FAPESP (2016/07926‐4) to R.T., Coordination for the Improvement of Higher Education Personnel (CAPES‐Embrapa) and Embrapa Macroprogram SEG (02.12.01.008.00.00) to H.B.C.M. and BB/K013335/1, BBSRC‐GCRF‐IAA/RIA‐6 and BB/K007599/1 from UK Biotechnology and Biosciences Research Council to R.A.C.M., and the Great Lakes Bioenergy Research Center (DOE BER Office of Science DE‐FC02‐07ER64494) to J.R.
See also the Commentary on this article by Gómez & McQueen‐Mason, 218: 5–7.
Contributor Information
Rowan A. C. Mitchell, Email: rowan.mitchell@rothamsted.ac.uk.
Hugo B. C. Molinari, Email: hugo.molinari@embrapa.br
References
- Akin DE. 1990. Diazonium compounds localize grass cell wall phenolics: relation to wall digestibility. Crop Science 30: 985–989. [Google Scholar]
- Anders N, Wilkinson MD, Lovegrove A, Freeman J, Tryfona T, Pellny TK, Weimar T, Mortimer JC, Stott K, Baker JM et al 2012. Glycosyl transferases in family 61 mediate arabinofuranosyl transfer onto xylan in grasses. Proceedings of the National Academy of Sciences, USA 109: 989–993. [DOI] [PMC free article] [PubMed] [Google Scholar]
- Bartley LE, Peck ML, Kim SR, Ebert B, Manisseri C, Chiniquy DM, Sykes R, Gao LF, Rautengarten C, Vega‐Sanchez ME et al 2013. Overexpression of a BAHD acyltransferase, OsAt10, alters rice cell wall hydroxycinnamic acid content and saccharification. Plant Physiology 161: 1615–1633. [DOI] [PMC free article] [PubMed] [Google Scholar]
- Bennetzen JL, Schmutz J, Wang H, Percifield R, Hawkins J, Pontaroli AC, Estep M, Feng L, Vaughn JN, Grimwood J et al 2012. Reference genome sequence of the model plant Setaria . Nature Biotechnology 30: 555–561. [DOI] [PubMed] [Google Scholar]
- Bouvier d'Yvoire M, Bouchabke‐Coussa O, Voorend W, Antelme S, Cézard L, Legée F, Lebris P, Legay S, Whitehead C, McQueen‐Mason SJ et al 2013. Disrupting the cinnamyl alcohol dehydrogenase 1 gene (BdCAD1) leads to altered lignification and improved saccharification in Brachypodium distachyon . Plant Journal 73: 496–508. [DOI] [PubMed] [Google Scholar]
- Buanafina MMD, Fescemyer HW, Sharma M, Shearer EA. 2016. Functional testing of a PF02458 homologue of putative rice arabinoxylan feruloyl transferase genes in Brachypodium distachyon . Planta 243: 659–674. [DOI] [PubMed] [Google Scholar]
- Buanafina MMDO, Langdon T, Hauck B, Dalton S, Morris P. 2008. Expression of a fungal ferulic acid esterase increases cell wall digestibility of tall fescue (Festuca arundinacea). Plant Biotechnology Journal 6: 264–280. [DOI] [PubMed] [Google Scholar]
- Buanafina MMO. 2009. Feruloylation in grasses: current and future perspectives. Molecular Plant 2: 861–872. [DOI] [PubMed] [Google Scholar]
- Casler MD, Jung HJG. 2006. Relationships of fibre, lignin, and phenolics to in vitro fibre digestibility in three perennial grasses. Animal Feed Science and Technology 125: 151–161. [Google Scholar]
- Chang S, Puryear J, Cairney J. 1993. A simple and efficient method for isolating RNA from pine trees. Plant Molecular Biology Reporter 11: 113–116. [Google Scholar]
- Chiniquy D, Sharma V, Schultink A, Baidoo EE, Rautengarten C, Cheng K, Carroll A, Ulvskov P, Harholt J, Keasling JD et al 2012. XAX1 from glycosyltransferase family 61 mediates xylosyltransfer to rice xylan. Proceedings of the National Academy of Sciences, USA 109: 17117–17122. [DOI] [PMC free article] [PubMed] [Google Scholar]
- Freeman J, Ward JL, Kosik O, Lovegrove A, Wilkinson MD, Shewry PR, Mitchell RAC. 2017. Feruloylation and structure of arabinoxylan in wheat endosperm cell walls from RNAi lines with suppression of genes responsible for backbone synthesis and decoration. Plant Biotechnology Journal 15: 1429–1438. [DOI] [PMC free article] [PubMed] [Google Scholar]
- Fry SC. 2004. Primary cell wall metabolism: tracking the careers of wall polymers in living plant cells. New Phytologist 161: 641–675. [DOI] [PubMed] [Google Scholar]
- Goodstein DM, Shu SQ, Howson R, Neupane R, Hayes RD, Fazo J, Mitros T, Dirks W, Hellsten U, Putnam N et al 2012. Phytozome: a comparative platform for green plant genomics. Nucleic Acids Research 40: D1178–D1186. [DOI] [PMC free article] [PubMed] [Google Scholar]
- Grabber JH, Hatfield RD, Ralph J. 1998a. Diferulate cross‐links impede the enzymatic degradation of non‐lignified maize walls. Journal of the Science of Food and Agriculture 77: 193–200. [Google Scholar]
- Grabber JH, Ralph J, Hatfield RD. 1998b. Severe inhibition of maize wall degradation by synthetic lignins formed with coniferaldehyde. Journal of the Science of Food and Agriculture 78: 81–87. [Google Scholar]
- Guindon S, Dufayard JF, Lefort V, Anisimova M, Hordijk W, Gascuel O. 2010. New algorithms and methods to estimate maximum‐likelihood phylogenies: assessing the performance of PhyML 3.0. Systematic Biology 59: 307–321. [DOI] [PubMed] [Google Scholar]
- Harris PJ, Trethewey JAK. 2010. The distribution of ester‐linked ferulic acid in the cell walls of angiosperms. Phytochemistry Reviews 9: 19–33. [Google Scholar]
- Hirano K, Masuda R, Takase W, Morinaka Y, Kawamura M, Takeuchi Y, Takagi H, Yaegashi H, Natsume S, Terauchi R et al 2017. Screening of rice mutants with improved saccharification efficiency results in the identification of CONSTITUTIVE PHOTOMORPHOGENIC 1 and GOLD HULL AND INTERNODE 1. Planta 246: 61–74. [DOI] [PubMed] [Google Scholar]
- Ishii T. 1997. Structure and functions of feruloylated polysaccharides. Plant Science 127: 111–127. [Google Scholar]
- Karlen SD, Peck ML, Zhang C, Smith RA, Padmakshan D, Helmich KE, Free HCA, Lee S, Smith BG, Lu F et al 2016. Monolignol ferulate conjugates are naturally incorporated into plant lignins. Science Advances 2: 1–9. [DOI] [PMC free article] [PubMed] [Google Scholar]
- Kim H, Padmakshan D, Li Y, Rencoret J, Hatfield RD, Ralph J. 2017. Characterization and elimination of undesirable protein residues in plant cell wall materials for enhancing lignin analysis by solution‐state NMR. Biomacromolecules 18: 4184–4195. [DOI] [PubMed] [Google Scholar]
- Kim H, Ralph J. 2010. Solution‐state 2D NMR of ball‐milled plant cell wall gels in DMSO‐d6/pyridine‐d5 . Organic & Biomolecular Chemistry 8: 576–591. [DOI] [PMC free article] [PubMed] [Google Scholar]
- Lam TBT, Iiyama K, Stone BA. 2003. Hot alkali‐labile linkages in the walls of the forage grass Phalaris aquatica and Lolium perenne and their relation to in vitro wall digestibility. Phytochemistry 64: 603–607. [DOI] [PubMed] [Google Scholar]
- Li H, Durbin R. 2010. Fast and accurate long‐read alignment with Burrows‐Wheeler transform. Bioinformatics 26: 589–595. [DOI] [PMC free article] [PubMed] [Google Scholar]
- Marita JM, Hatfield RD, Rancour DM, Frost KE. 2014. Identification and suppression of the p‐coumaroyl CoA: hydroxycinnamyl alcohol transferase in Zea mays L. Plant Journal 78: 850–864. [DOI] [PMC free article] [PubMed] [Google Scholar]
- Martins PK, Mafra V, de Souza WR, Ribeiro AP, Vinecky F, Basso MF, da Cunha BADB, Kobayashi AK, Molinari HBC. 2016. Selection of reliable reference genes for RT‐qPCR analysis during developmental stages and abiotic stress in Setaria viridis . Scientific Reports 6: 28348. [DOI] [PMC free article] [PubMed] [Google Scholar]
- Martins PK, Ribeiro AP, Cunha BADBd, Kobayashi AK, Molinari HBC. 2015. A simple and highly efficient Agrobacterium‐mediated transformation protocol for Setaria viridis . Biotechnology Reports 6: 41–44. [DOI] [PMC free article] [PubMed] [Google Scholar]
- Matasci N, Hung LH, Yan ZX, Carpenter EJ, Wickett NJ, Mirarab S, Nguyen N, Warnow T, Ayyampalayam S, Barker M et al 2014. Data access for the 1,000 Plants (1KP) project. Gigascience 3: 17. [DOI] [PMC free article] [PubMed] [Google Scholar]
- Mitchell RAC, Dupree P, Shewry PR. 2007. A novel bioinformatics approach identifies candidate genes for the synthesis and feruloylation of arabinoxylan. Plant Physiology 144: 43–53. [DOI] [PMC free article] [PubMed] [Google Scholar]
- Molinari HB, Pellny TK, Freeman J, Shewry PR, Mitchell RA. 2013. Grass cell wall feruloylation: distribution of bound ferulate and candidate gene expression in Brachypodium distachyon . Frontiers in Plant Science 4: 50. [DOI] [PMC free article] [PubMed] [Google Scholar]
- Moreira‐Vilar FC, Siqueira‐Soares Rde C, Finger‐Teixeira A, de Oliveira DM, Ferro AP, da Rocha GJ, Ferrarese Mde L, dos Santos WD, Ferrarese‐Filho O. 2014. The acetyl bromide method is faster, simpler and presents best recovery of lignin in different herbaceous tissues than Klason and thioglycolic acid methods. PLoS ONE 9: e110000. [DOI] [PMC free article] [PubMed] [Google Scholar]
- Myton KE, Fry SC. 1994. Intraprotoplasmic feruloylation of arabinoxylans in Festuca arundinacea cell cultures. Planta 193: 326–330. [Google Scholar]
- de Oliveira DM, Finger‐Teixeira A, Mota TR, Salvador VH, Moreira‐Vilar FC, Molinari HBC, Mitchell RAC, Marchiosi R, Ferrarese O, dos Santos WD. 2015. Ferulic acid: a key component in grass lignocellulose recalcitrance to hydrolysis. Plant Biotechnology Journal 13: 1224–1232. [DOI] [PubMed] [Google Scholar]
- Pellny TK, Lovegrove A, Freeman J, Tosi P, Love CG, Knox JP, Shewry PR, Mitchell RAC. 2012. Cell walls of developing wheat starchy endosperm: comparison of composition and RNA‐seq transcriptome. Plant Physiology 158: 612–627. [DOI] [PMC free article] [PubMed] [Google Scholar]
- Petrik DL, Karlen SD, Cass CL, Padmakshan D, Lu FC, Liu S, Le Bris P, Antelme S, Santoro N, Wilkerson CG et al 2014. p‐Coumaroyl‐CoA: monolignol transferase (PMT) acts specifically in the lignin biosynthetic pathway in Brachypodium distachyon . Plant Journal 77: 713–726. [DOI] [PMC free article] [PubMed] [Google Scholar]
- Piston F, Uauy C, Fu LH, Langston J, Labavitch J, Dubcovsky J. 2010. Down‐regulation of four putative arabinoxylan feruloyl transferase genes from family PF02458 reduces ester‐linked ferulate content in rice cell walls. Planta 231: 677–691. [DOI] [PMC free article] [PubMed] [Google Scholar]
- Quemener B, Ralet MC. 2004. Evidence for linkage position determination in known feruloylated mono‐ and disaccharides using electrospray ion trap mass spectrometry. Journal of Mass Spectrometry 39: 1153–1160. [DOI] [PubMed] [Google Scholar]
- Ralph J. 2010. Hydroxycinnamates in lignification. Phytochemistry Reviews 9: 65–83. [Google Scholar]
- Ralph J, Bunzel M, Marita JM, Hatfield RD, Lu F, Kim H, Schatz PF, Grabber JH, Steinhart H. 2004. Peroxidase‐dependent cross‐linking reactions of p‐hydroxycinnamates in plant cell walls. Phytochemistry Reviews 3: 79–96. [Google Scholar]
- Ralph J, Grabber JH, Hatfield RD. 1995. Lignin‐ferulate cross‐links in grasses: active incorporation of ferulate polysaccharide esters into ryegrass lignins. Carbohydrate Research 275: 167–178. [Google Scholar]
- Ralph J, Hatfield RD, Grabber JH, Jung HG, Quideau S, Helm RF. 1998. Cell wall cross‐linking in grasses by ferulates and diferulates In: Lewis NG, Sarkanen S, eds. Lignin and lignan biosynthesis. Washington, DC, USA: American Chemical Society, 209–236. [Google Scholar]
- Ralph J, Helm RF, Quideau S, Hatfield RD. 1992. Lignin feruloyl ester cross‐cinks in grasses. 1. Incorporation of feruloyl esters into coniferyl alcohol dehydrogenation polymers. Journal of the Chemical Society, Perkin Transactions 1: 2961–2969. [Google Scholar]
- Rancour DM, Hatfield RD, Marita JM, Rohr NA, Schmitz RJ. 2015. Cell wall composition and digestibility alterations in Brachypodium distachyon achieved through reduced expression of the UDP‐arabinopyranose mutase. Frontiers in Plant Science 6: 446. [DOI] [PMC free article] [PubMed] [Google Scholar]
- Rautengarten C, Birdseye D, Pattathil S, McFarlane HE, Saez‐Aguayo S, Orellana A, Persson S, Hahn MG, Scheller HV, Heazlewood JL et al 2017. The elaborate route for UDP‐arabinose delivery into the Golgi of plants. Proceedings of the National Academy of Sciences, USA 114: 4261–4266. [DOI] [PMC free article] [PubMed] [Google Scholar]
- Roberts A, Pachter L. 2013. Streaming fragment assignment for real‐time analysis of sequencing experiments. Nature Methods 10: 71–73. [DOI] [PMC free article] [PubMed] [Google Scholar]
- Robinson MD, McCarthy DJ, Smyth GK. 2010. edgeR: a bioconductor package for differential expression analysis of digital gene expression data. Bioinformatics 26: 139–140. [DOI] [PMC free article] [PubMed] [Google Scholar]
- Saulnier L, Vigouroux J, Thibault JF. 1995. Isolation and partial characterization of feruloylated oligosaccharides from maize bran. Carbohydrate Research 272: 241–253. [DOI] [PubMed] [Google Scholar]
- Scheller HV, Ulvskov P. 2010. Hemicelluloses. Annual Review of Plant Biology 61: 263–289. [DOI] [PubMed] [Google Scholar]
- Sibout R, Le Bris P, Legee F, Cezard L, Renault H, Lapierre C. 2016. Structural redesigning Arabidopsis lignins into alkali‐soluble lignins through the expression of p‐coumaroyl‐coA: monolignol transferase PMT. Plant Physiology 170: 1358–1366. [DOI] [PMC free article] [PubMed] [Google Scholar]
- Sluiter A, Hames B, Ruiz R, Scarlata C, Sluiter J, Templeton D, Crocker D. 2012. Determination of structural carbohydrates and lignin in biomass. National Laboratory of the US Department of Energy, Office of Energy Efficiency & Renewable Energy Technical Reports, Denver, CO, USA. [Google Scholar]
- Vogel J, Hill T. 2008. High‐efficiency Agrobacterium‐mediated transformation of Brachypodium distachyon inbred line Bd21‐3. Plant Cell Reports 27: 471–478. [DOI] [PubMed] [Google Scholar]
- Vogel JP, Garvin DF, Mockler TC, Schmutz J, Rokhsar D, Bevan MW, Barry K, Lucas S, Harmon‐Smith M, Lail K et al 2010. Genome sequencing and analysis of the model grass Brachypodium distachyon . Nature 463: 763–768. [DOI] [PubMed] [Google Scholar]
- Wende G, Fry SC. 1997. 2‐O‐beta‐d‐xylopyranosyl‐(5‐O‐feruloyl)‐l‐arabinose, a widespread component of grass cell walls. Phytochemistry 44: 1019–1030. [Google Scholar]
- Wickett NJ, Mirarab S, Nguyen N, Warnow T, Carpenter E, Matasci N, Ayyampalayam S, Barker MS, Burleigh JG, Gitzendanner MA et al 2014. Phylotranscriptomic analysis of the origin and early diversification of land plants. Proceedings of the National Academy of Sciences, USA 111: E4859–E4868. [DOI] [PMC free article] [PubMed] [Google Scholar]
- Withers S, Lu FC, Kim H, Zhu YM, Ralph J, Wilkerson CG. 2012. Identification of grass‐specific enzyme that acylates monolignols with p‐coumarate. Journal of Biological Chemistry 287: 8347–8355. [DOI] [PMC free article] [PubMed] [Google Scholar]
- Yang F, Mitra P, Zhang L, Prak L, Verhertbruggen Y, Kim J‐S, Sun L, Zheng K, Tang K, Auer M et al 2013. Engineering secondary cell wall deposition in plants. Plant Biotechnology Journal 11: 325–335. [DOI] [PMC free article] [PubMed] [Google Scholar]
Associated Data
This section collects any data citations, data availability statements, or supplementary materials included in this article.
Supplementary Materials
Please note: Wiley Blackwell are not responsible for the content or functionality of any Supporting Information supplied by the authors. Any queries (other than missing material) should be directed to the New Phytologist Central Office.
Fig. S1 RNAi construct, and HCA content of Brachypodium and Setaria RNAi plants.
Fig. S2 LC‐MS chromatograms and correlations of UV absorbance and MRM ion count peak areas.
Fig. S3 HCA‐Ara content for T4 Setaria samples.
Table S1 SvBAHD01 silencing, FA content and segregation in Setaria SvBAHD01 RNAi lines
Table S2 HCA content of Brachypodium and Setaria samples
Table S3 MRMs and identities of most prevalent ions released from AIR samples by mild acidolysis
Table S4 HCA content of saponified samples following mild acidolysis from Setaria plants
Table S5 Monosaccharide composition of cell walls from Setaria plants
Methods S1 Procedures for plant growth, microscopy and determination of gene expression, cell‐wall monosaccharides, lignin and biomass.
Notes S1 Differentially expressed transcripts in SvBAHD01 RNAi stems from RNA‐seq.