

Abstract
Severe alcoholic hepatitis (sAH) is associated with a poor prognosis. There is no proven effective treatment for sAH, which is why early transplantation has been increasingly discussed. Hepatoblastoma‐derived C3A cells express anti‐inflammatory proteins and growth factors and were tested in an extracorporeal cellular therapy (ELAD) study to establish their effect on survival for subjects with sAH. Adults with sAH, bilirubin ≥8 mg/dL, Maddrey's discriminant function ≥ 32, and Model for End‐Stage Liver Disease (MELD) score ≤ 35 were randomized to receive standard of care (SOC) only or 3‐5 days of continuous ELAD treatment plus SOC. After a minimum follow‐up of 91 days, overall survival (OS) was assessed by using a Kaplan‐Meier survival analysis. A total of 203 subjects were enrolled (96 ELAD and 107 SOC) at 40 sites worldwide. Comparison of baseline characteristics showed no significant differences between groups and within subgroups. There was no significant difference in serious adverse events between the 2 groups. In an analysis of the intent‐to‐treat population, there was no difference in OS (51.0% versus 49.5%). The study failed its primary and secondary end point in a population with sAH and with a MELD ranging from 18 to 35 and no upper age limit. In the prespecified analysis of subjects with MELD < 28 (n = 120), ELAD was associated with a trend toward higher OS at 91 days (68.6% versus 53.6%; P = .08). Regression analysis identified high creatinine and international normalized ratio, but not bilirubin, as the MELD components predicting negative outcomes with ELAD. A new trial investigating a potential benefit of ELAD in younger subjects with sufficient renal function and less severe coagulopathy has been initiated. Liver Transplantation 24 380–393 2018 AASLD.
Abbreviations
- AASLD
American Association for the Study of Liver Diseases
- AH
alcoholic hepatitis
- ALT
alanine transaminase
- AST
aspartate transaminase
- CI
confidence interval
- CT
computed tomography
- DF
discriminant function
- DIC
disseminated intravascular coagulation
- DSMB
data and safety monitoring board
- EASL
European Association for the Study of the Liver
- ELAD
extracorporeal cellular therapy
- HR
hazard ratio
- IL1Ra
interleukin 1 receptor antagonist
- INR
international normalized ratio
- ITT
intent‐to‐treat
- MELD
Model for End‐Stage Liver Disease
- OS
overall survival
- PEth
phosphatidyl ethanol
- sAH
severe alcoholic hepatitis
- SD
standard deviation
- SOC
standard of care
- STOPAH
steroids or pentoxifylline for alcoholic hepatitis
- TEAE
treatment‐emergent adverse event
- TESAE
treatment‐emergent serious adverse event
- UF
ultrafiltrate
- WBC
white blood cell
Severe alcoholic hepatitis (sAH), a syndrome which occurs in persons with heavy alcohol abuse, typically presents as liver failure with jaundice and coagulopathy.1 After initial presentation of sAH (Maddrey's discriminant function [DF] ≥ 32), mortality varies between 40% and 60% depending on the presence of secondary organ complications and treatment.
The pathogenesis of liver failure in alcoholic hepatitis (AH) is complex and includes hepatic steatosis associated with inflammation, hepatocellular damage, and rapid cholestasis. Increased translocation of the gut due to excessive alcohol is thought to exacerbate inflammation in acute events, creating a vicious cycle, where inflammation, oxidative stress, and cholestatic toxin accumulation with consequent cellular damage perpetuate each other.2, 3, 4
Currently, treatment of sAH uses medical therapy with an anti‐inflammatory or immunosuppressive regimen.3 A recent study, steroids or pentoxifylline for alcoholic hepatitis (STOPAH), aimed to show the effectiveness of the current methods of treating sAH using prednisolone and/or pentoxifylline5 and showed no overall impact on 90‐day survival.5 Because these results suggest no longterm survival increase from treatment with glucocorticoids, controversy exists regarding the benefits of these drugs in the sAH population because these patients are often at high risk of gastrointestinal bleeds or sepsis, complications that could be exacerbated by steroids.5, 6, 7 Increasingly, nonresponders to medical therapy are considered to be candidates for early transplantation8, 9 because the majority of these patients will not survive a 6‐month period of alcohol abstinence required by common protocols.10
However, to narrow the use of the limited organ pool, cellular therapies have been suggested as an alternative option to current medical treatment for sAH by providing anti‐inflammatory effects and promoting hepatocellular regeneration.11, 12
The concept of liver cell therapy in sAH is based on the assumption that by providing hepatocellular support, the impaired liver cells can recover, inhibiting further degeneration and enabling recovery.
A proteomic analysis of C3A cell products identified numerous proteins with anti‐inflammatory properties, such as interleukin 1 receptor antagonist (IL1Ra), the expression of which could be stimulated by various proinflammatory cytokines elevated in AH.13 Also C3A cells have been shown to express antiapoptotic and anti‐oxidative mechanisms that could further dampen the hepatocellular injury caused by inflammation and oxidative stress. In addition, C3A cells express several growth factors, such as transforming growth factor, vascular endothelial growth factor, and so on, involved in the natural regeneration naturally following the acute phase response as the first line of response to injury.14
In a prior phase 2 study, VTI‐206, C3A cellular therapy did not show survival benefit in end‐stage liver disease but a positive trend toward improved survival in a subset of sAH patients.15 The VTI‐208 study (NCT01471028) was conducted to evaluate the safety and efficacy of ELAD with respect to overall survival (OS) of subjects with sAH.
Patients and Methods
PARTICIPANTS
Subjects ≥18 years of age with a medical history of heavy alcohol abuse with a maximum of 6 weeks between the last intake of alcohol and rapid onset of jaundice (serum bilirubin ≥ 8 mg/dL) and coagulopathy (Maddrey's DF ≥ 32) were enrolled in VTI‐208.
Stratum A was populated with subjects who had either liver biopsy–confirmed sAH or 2 of the following: hepatomegaly, AST > ALT, leukocytosis, or ascites.
Subjects with sAH and underlying chronic liver disease other than alcoholic liver disease documented by liver biopsy, laboratory findings, and/or a medical history were randomized in a separate stratum B.
Patients with end‐stage cirrhosis, as indicated by craniocaudal liver size <10 cm on ultrasound, liver volume <750 cc on computed tomography (CT) or magnetic resonance imaging, or portal vein thrombosis, were excluded. Also excluded were patients with Model for End‐Stage Liver Disease (MELD) > 35, platelets < 40,000/mm3, and individuals with severe concomitant diseases, uncontrolled bleeding, infection that was clinically unresponsive to antibiotics, hemodynamic instability, or those on chronic dialysis.
STUDY DESIGN
In this open‐label trial, subjects were randomized to either receive standard of care (SOC) as defined by the American Association for the Study of Liver Disease (AASLD) and the European Association for the Study of the Liver (EASL) guidelines (control group) or SOC plus ELAD. ELAD treatment consisted of drawing blood from the subject via a dual‐lumen catheter using an extracorporeal pumping unit and then separating the plasma fluid (ultrafiltrate [UF]) from the cellular components using a specifically designed UF generator cartridge. While the cellular components are returned to the subject via the venous access, the UF is circulated at a high flow rate through 4 metabolically active hollow‐fiber ELAD cartridges containing approximately 440 g of C3A cells. After circulation through the cartridges, the UF passes through a 0.2‐µm pore‐size filter, is recombined with the cellular components of the subject's blood, and is returned to the subject through the dual‐lumen catheter (Fig. 1). For anticoagulation, site‐based protocols for continuous hemofiltration were used, with the exception of citrate.
Figure 1.
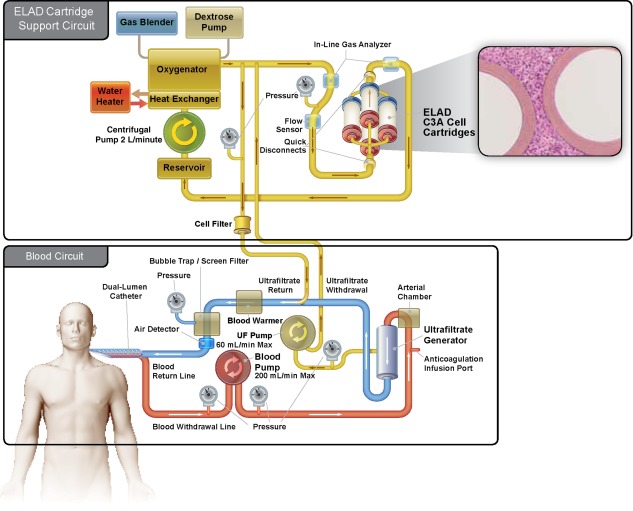
The ELAD system is an extracorporeal human hepatic cell‐based liver treatment. During ELAD treatment, blood is drawn from the subject via a dual‐lumen catheter using an extracorporeal pumping unit, and then is separated by a specifically designed UF generator cartridge. The UF contains proteins the size of albumin and smaller but does not contain larger proteins such as antibodies. The UF is circulated at a high flow rate through the ELAD cartridges, which contain approximately 440 g of C3A cells. After circulation through the ELAD cartridges, the UF passes through a 0.2‐µm pore size cell filter, is recombined with the cellular components of the subject's blood, and is then returned to the subject via the dual‐lumen catheter.
ELAD treatment was conducted continuously for 120 hours unless subjects deteriorated and became futile, withdrew consent, or subjects responded quickly after 72 hours.
Subjects were followed for at least 91 days after randomization of the last subject.
During that time, subjects had daily visits the first week unless discharged and then at days 7, 14, 21, 28, 63, and 91.
To ensure unbiased medical management, health assessments during the follow‐up period were performed by an independent physician/nurse practitioner applying SOC. All subjects received weekly home health care service visits that included weight measurement, nutritional consultation, and a blinded phosphatidyl ethanol (PEth) to detect posttreatment alcohol use. Upon initiation of the VTI‐208 study, subjects also consented and were enrolled into an extension study, VTI‐208E to follow‐up for 5 years to assess the continued survival of both arms.
The study was approved by all institutional review boards/ethics committees, and written informed consents were obtained from all participants or participants' legally authorized representative.
OBJECTIVES
The primary objective of the study was to evaluate safety and efficacy of ELAD with respect to OS up to at least study day 91, with follow‐up protocol VTI‐208E providing additional survival data up to a maximum of 5 years. The secondary objectives were to evaluate the proportion of survivors at study days 28 and 91.
ASSESSMENT OF EFFICACY
OS was assessed using a Kaplan‐Meier survival analysis of the intent‐to‐treat (ITT) population using a log‐rank test.
ASSESSMENT OF SAFETY
Treatment‐emergent adverse events (TEAEs) and treatment‐emergent serious adverse events (TESAEs) were documented for both arms of the study population. For events occurring in ELAD subjects, the investigator assessed a potential relationship with the ELAD treatment. All TESAEs during the study were reviewed by an independent data and safety monitoring board (DSMB).
LABORATORY TESTING
Standard blood testing was used to measure total bilirubin, international normalized ratio (INR), and creatinine for the calculation of MELD score. The site's certified clinical laboratories were also responsible for collecting all blood cell counts and other biochemistry data that were needed at baseline and follow‐up visits.
Standard of Care
Trial sites were instructed to apply AASLD/EASL guidelines for treatment of complications of liver disease. For specific sAH SOC, concomitant medication, such as steroids, pentoxifylline, N‐acetylcysteine, and antibiotics were documented.
RANDOMIZATION
Randomization was conducted using a predetermined block size (4) with a 1:1 ratio of ELAD to control subjects. Separate randomization schedules (stratified randomization) were made for strata A and B. The allocation concealment was computerized based on an electronic case report file system. Once a subject was enrolled in the study, the principal investigator received a code from the sponsor's enrollment hotline and randomization occurred online.
STATISTICAL METHODS
Power Calculation
On the basis of a former controlled study, 40% of control subjects and 60% of ELAD‐treated subjects were expected to survive at least until day 91.15 Under the assumption of a proportional hazards model, this leads to median survival estimates of approximately 68 days and 122 days for control and ELAD subjects, respectively.
A sample size of 100 subjects per group was calculated to provide a power of at least 0.95 using a log‐rank test comparing 2 survival curves with a minimum of 91‐day follow‐up for the last subject enrolled. No interim analysis was performed.
Primary Analysis
The OS of the ITT population was done by Kaplan‐Meier analysis using a log‐rank test to evaluate the null hypothesis of equality of survival curves with a minimum follow‐up of 91 days after the enrollment of the last subject.
Model‐based estimates (and confidence limits) of median survival by treatment group and hazard rates, along with the hazard ratio (HR) and confidence interval (CI), were produced.
Secondary Analyses
A chi‐square test was used to evaluate the proportion of subjects who survived at the end of study day 28 and the end of study day 91 based on the ITT population.
Comparability of Groups
Demographics and baseline parameters were compared with the 2 groups by exact chi‐square methods for discrete variables and parametric (t test) or nonparametric (Mann‐Whitney U) comparisons for continuous variables.
The following parameters were assessed for comparability: time between alcohol abuse and hospital admission, time between hospital admission and randomization, age, sex, baseline total bilirubin, INR, creatinine, MELD, baseline status of infection and antibiotic treatment, use of vasopressors, ventilation, dialysis and steroids use as SOC.
Covariates and Prespecified Subgroup Analysis
The statistical plan predefined factors related to standard demographics, selected baseline characteristics, medical history, regional and geographical site–related factors, and SOC. Comparisons between treatment groups according to these predefined criteria were carried out, analyzed, summarized, and reviewed. The following demographic and baseline characteristics were evaluated: age, sex, baseline MELD score and its components, hepatic encephalopathy grade, and baseline white blood cell (WBC) count.
Study Populations
The ITT population included all randomized subjects assigned to the group to which they were randomized, regardless of actual treatment. The safety population was defined by actual treatment received by subjects.
Results
PARTICIPANTS
Between March 2013 and February 2015, 374 patients were screened at 40 sites in the United States, United Kingdom, and Australia. Of those screened, 203 subjects met the criteria for enrollment and were randomized to either ELAD (n = 96) or control (n = 107) comprising the ITT population. Also, 171 subjects did not meet 1 or more of the inclusion or exclusion criteria as detailed in the legend of Fig. 2. The uneven distribution of subjects between ELAD and control is due to the block randomization by site (blocks of 4, 2 each of ELAD and control). Because individual sites did not enroll sufficient subjects to fulfil 1 or more complete blocks, there was, by chance, an imbalance of ELAD and control subjects.
Figure 2.
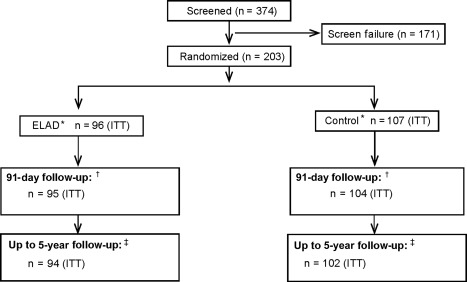
Flowchart and disposition of patients during the study until July 2015. Of the 374 subjects screened for the study, 171 did not meet inclusion criteria or presented with exclusion criteria, most frequently the inability to provide informed consent (n = 39), MELD score > 35 (n = 44), evidence of reduction in total bilirubin of 20% or more in the previous 72 hours (n = 42), and evidence of significant concomitant disease with expected life expectancy of <3 months (n = 29). *The ITT population is “as randomized.” Of the 96 subjects randomized to ELAD, 2 subjects deteriorated and became unstable before ELAD could be initiated; those subjects did not receive ELAD. One subject randomized to control received ELAD. In a separate safety analysis, the populations were analyzed “as treated.” †During the 91‐day follow‐up, 1 patient in the ELAD group and 1 in the control group were “lost to follow‐up” and 2 patients in the control group withdrew consent, so the outcome is known in 95 and 104 subjects in ELAD and control. ‡As of July 2015, using data from the VTI‐208 Extension study, the outcome is known for 94 ELAD and 102 Control subjects; 1 ELAD subject and 3 Control subjects were lost to follow‐up and 1 ELAD subject and 2 Control subjects withdrew consent.
The baseline characteristics of the 203 subjects are presented in Table 1. The majority of subjects were in stratum A (n = 193), with only 10 subjects assigned to stratum B, therefore both strata were combined and further analysis will be presented for the total population (n = 203). There were 13 of 107 control and 15 of 96 ELAD subjects who were diagnosed with sAH with a confirmatory biopsy. The groups had comparable time between last alcohol intake, hospitalization, and randomization. Groups had an even distribution of sex, MELD score (mean, 27.3), bilirubin (mean, 25.1 mg/dL), and subjects who required vasopressor therapy (38 subjects), with no statistically significant differences. Ventilator support was required in 8 ELAD subjects and 3 control subjects. At baseline, 2 ELAD subjects and no control subjects were on acute dialysis. The control group had more subjects <35 years old than the ELAD group.
Table 1.
Baseline Characteristics
| Prespecified Subgroups ELAD (n = 96) | Prespecified Subgroups Control (n = 107) | |||||||||
|---|---|---|---|---|---|---|---|---|---|---|
| Baseline Characteristics | ELAD (n = 96) | Control (n = 107) | MELD < 28 (n = 51) | MELD ≥ 28 (n = 45) | Age < 46.9 years (n = 43) | Age ≥ 46.9 years (n = 53) | MELD < 28 (n = 69) | MELD ≥ 28 (n = 38) | Age < 46.9 years (n = 58) | Age ≥ 46.9 years (n = 49) |
| Acute AH (group A) | 92 (95.8) | 101 (94.4) | 47 (92.2) | 45 (100) | 42 (97.7) | 50 (94.3) | 64 (92.8) | 37 (97.4) | 55 (94.8) | 46 (93.9) |
| AH superimposed on underlying liver disease not due to alcohol (group B) | 4 (4.2) | 6 (5.6) | 4 (7.8) | 0 (0) | 1 (2.3) | 3 (5.7) | 5 (7.2) | 1 (2.6) | 3 (5.2) | 3 (6.1) |
| Days between last alcohol and hospital admission | 19.8 ± 14.2 | 19.8 ± 16.2 | 17.7 ± 13.7 | 22.2 ± 14.5 | 17.8 ± 12.7 | 21.5 ± 15.1 | 16.9 ± 14.9 | 23.7 ± 17.7 | 18.9 ± 16.7 | 19.7 ± 15.7 |
| Days between site admission and randomization | 10 ± 6.1 | 9.4 ± 7.8 | 8.3 ± 5.8 | 12.0 ± 5.9 | 9.2 ± 5.7 | 10.7 ± 6.4 | 7.8 ± 4.9 | 12.3 ± 10.8 | 9.7 ± 9.1 | 9.0 ± 5.9 |
| Age, years | 46.5 ± 9.1 | 44.8 ± 10.7 | 45.6 ± 8.4 | 47.5 ± 9.8 | 38.2 ± 5.6 | 53.2 ± 4.7 | 45.8 ± 10.7 | 43.0 ± 10.5 | 36.6 ± 5.9 | 54.4 ± 5.8 |
| Sex | ||||||||||
| Males | 55 (57.3) | 65 (60.7) | 25 (49.0) | 30 (66.7) | 22 (51.2) | 33 (62.3) | 40 (58.0) | 25 (65.8) | 33 (56.9) | 32 (65.3) |
| Females | 41 (42.7) | 42 (39.3) | 26 (51.0) | 15 (33.3) | 21 (48.8) | 20 (37.7) | 29 (42.0) | 13 (34.2) | 25 (43.1) | 17 (34.7) |
| Subjects with infection and systemic antibiotics | 58 (60.4) | 58 (54.2) | 27 (52.9) | 31 (68.9) | 26 (60.5) | 32 (60.4) | 36 (52.2) | 22 (57.9) | 33 (56.9) | 25 (51.0) |
| >2 episodes of dialysis in last week | 2 (2.1) | 0 (0) | 0 (0) | 2 (4.4) | 0 (0) | 2 (3.8) | 0 (0) | 0 (0) | 0 (0) | 0 (0) |
| Intubated | 8 (8.3) | 3 (2.8) | 5 (9.8) | 3 (6.7) | 6 (14.0) | 2 (3.8) | 1 (1.4) | 2 (5.3) | 1 (1.7) | 2 (4.1) |
| Encephalopathy grade | ||||||||||
| 0 | 52 | 54 | 32 | 20 | 25 | 27 | 35 | 19 | 26 | 28 |
| 1‐2 | 39 | 41 | 18 | 21 | 17 | 22 | 26 | 15 | 29 | 12 |
| 3‐4 | 3 | 9 | 1 | 2 | 1 | 2 | 6 | 3 | 3 | 6 |
| On vasopressors | 18 (18.8) | 20 (18.7) | 3 (5.9) | 15 (33.3) | 5 (11.6) | 13 (24.5) | 7 (10.1) | 13 (34.2) | 11 (19.0) | 9 (18.4) |
| Bilirubin from baseline MELD, mg/dL | 26.21 ± 9.7 | 24.07 ± 8.3 | 23.0 ± 7.9 | 29.8 ± 10.3 | 24.8 ± 8.0 | 27.4 ± 10.8 | 22.1 ± 7.8 | 27.7 ± 8.2 | 23.8 ± 9.4 | 24.4 ± 6.9 |
| INR | 2.0 ± 0.6 | 2.1 ± 0.5 | 1.8 ± 0.3 | 2.3 ± 0.6 | 2.0 ± 0.5 | 2.0 ± 0.6 | 1.8 ± 0.4 | 2.4 ± 0.5 | 2.2 ± 0.5 | 1.9 ± 0.5 |
| Creatinine, mg/dL | 1.1 ± 0.9 | 0.9 ± 0.5 | 0.7 ± 0.3 | 1.5 ± 1.2 | 0.9 ± 0.6 | 1.2 ± 1.1 | 0.8 ± 0.3 | 1.3 ± 0.6 | 0.9 ± 0.6 | 0.9 ± 0.4 |
| MELD | 27.6 ± 3.9 | 27.1 ± 3.8 | 24.5 ± 1.9 | 31.1 ± 2.4 | 27.0 ± 3.3 | 28.0 ± 4.4 | 24.7 ± 1.9 | 31.3 ± 2.3 | 27.8 ± 3.8 | 26.2 ± 3.6 |
| Albumin, g/dL | 2.8 ± 0.7 | 2.6 ± 0.6 | 2.7 ± 0.6 | 3.0 ± 0.7 | 2.8 ± 0.6 | 2.8 ± 0.8 | 2.5 ± 0.6 | 2.9 ± 0.7 | 2.7 ± 0.7 | 2.6 ± 0.6 |
| AST, U/L | 129.2 ± 60.9 | 140.9 ± 81.4 | 137.3 ± 64.4 | 120.1 ± 56.3 | 130.3 ± 62.2 | 128.2 ± 60.5 | 151.0 ± 83.9 | 122.7 ± 74.2 | 143.0 ± 90.7 | 138.5 ± 69.7 |
| ALT, U/L | 61.3 ± 44.1 | 61.4 ± 38.9 | 58.0 ± 42.5 | 65.1 ± 45.9 | 56.1 ± 44.6 | 65.5 ± 43.6 | 63.9 ± 42.8 | 57.0 ± 30.7 | 57.9 ± 30.9 | 65.6 ± 46.7 |
| WBC, 109/L | 15.4 ± 8.0 | 14.4 ± 8.1 | 14.1 ± 6.8 | 16.8 ± 9.0 | 15.7 ± 7.5 | 15.0 ± 8.4 | 13.3 ± 7.7 | 16.5 ± 8.5 | 14.9 ± 9.5 | 13.9 ± 6.2 |
| Liver size ultrasound | 19.1 ± 4.8 | 19.3 ± 3.9 | 18.6 ± 4.8 | 18.9 ± 4.7 | 20.8 ± 5.0 | 17.8 ± 4.2 | 19.5 ± 3.7 | 19.1 ± 4.2 | 19.7 ± 4.0 | 18.8 ± 3.8 |
| Ascites present | 55 | 65 | 25 | 30 | 31 | 34 | 39 | 26 | 37 | 28 |
| On steroids | 44 (45.8) | 53 (49.5) | 24 (47.1) | 20 (44.4) | 20 (46.5) | 24 (45.3) | 39 (56.5) | 14 (36.8) | 27 (46.6) | 26 (53.1) |
| On pentoxifylline | 33 (34.4) | 34 (31.8) | 17 (33.3) | 16 (35.6) | 14 (32.6) | 19 (35.8) | 21 (30.4) | 13 (34.2) | 27 (46.6) | 7 (14.3) |
NOTE: Data are given as n (%) or mean ± SD. Table 1 provides the baseline characteristics of all subjects as well as of the predefined subgroups regarding age and baseline. MELD. With the exception of a higher ratio of younger patients in the control arm, none of the baseline characteristics reached statistical difference by either unpaired comparison (t test or Mann‐Whitney U test were appropriate) or chi‐square analysis for distribution analysis.
Approximately half of the subjects in both groups were on steroids and one‐third were treated with pentoxifylline at baseline.
There were no observed differences in the use of steroids between groups at screening, days 1‐7, or as the study progressed.
At baseline, 58 of 96 (60.4%) ELAD and 58 of 107 (54.2%) control (n.s.) subjects were on systemic antibiotics for infection. There were also no significant differences between ELAD and controls in this subpopulation with respect to disease severity based on MELD or age.
The safety population was defined according to whether subjects actually received either ELAD treatment or SOC because this would best define the safety profile of ELAD treatment. This population differed from the ITT population because 2 subjects randomized to ELAD did not actually receive ELAD treatment, because they became unstable before the therapy could be initiated and 1 subject randomized to control inadvertently received ELAD treatment, leading to 95 subjects in the ELAD treatment group and 108 subjects in the control group.
TREATMENT EXPOSURE
Of the 96 subjects randomized to receive ELAD treatment, 45 completed treatment of 120 hours, 37 completed between 72 and 120 hours, 12 received <72 hours of treatment, and 2 became too unstable to initiate. The control subject who received ELAD was treated for <72 hours. In total, 95 subjects were exposed to ELAD therapy, of which 13 subjects did not receive minimum treatment.
There were 50 subjects who did not complete the protocol‐specified maximum treatment of 120 hours. These subjects were discontinued due to the following: clotting (n = 2), investigator deeming patient too unstable to continue (n = 9), adverse event (n = 18), futility due to bilirubin increase >25% (n = 1), subject withdrawing consent (n = 1), subject wanting to be removed from ELAD (n = 2), need for interruption to conduct CT scan or dialysis (n = 2), mechanical issue (n = 1), catheter issues (n = 3), family wanting to proceed with comfort measures only (n = 1), component issue (n = 3), and 7 subjects were discontinued without documentation that explained why.
OS AND SURVIVAL PROPORTION IN THE ITT
The OS with a minimum follow‐up time of 91 days, as evaluated according to the statistical plan, was not different between the groups as depicted in Fig. 3 (HR, 1.03; 95% CI, 0.69‐1.53) with 47.9% death rate in the ELAD group and 47.7% in the control group. At the time of database lock, 51% of ELAD subjects and 49.5% of control subjects were alive (Fig. 2).
Figure 3.
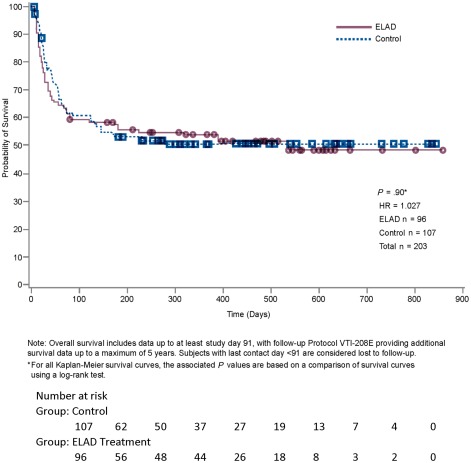
The Kaplan‐Meier analysis is given for the ITT population. At database lock, 46 subjects had died in the ELAD group and 53 in the control group. Remaining at risk were 49 in the ELAD group and 53 in the control group.
The survival proportion at days 28 and 91 was comparable between the ELAD and control groups, with 76.0% versus 80.4% and 59.4% versus 61.7%, respectively.
EFFECT OF ELAD TREATMENT EXPOSURE ON 91‐DAY MORTALITY
Of the 14 subjects receiving <72 hours of treatment, including 2 where treatment was not initiated due to progressive instability at the time ELAD arrived, 10 (71.4%) subjects died within 91 days. Of the 82 subjects completing the minimum treatment of 72 hours for per protocol analysis, 29 (35.4%) subjects died. Mortality differed minimally between subjects receiving between 72 and 120 hours (12/37) and completing 120 hours (17/45; 32.4% versus 37.8%).
COVARIATES AND PROSPECTIVE SUBGROUP ANALYSIS
Analyses of the prespecified subgroups of baseline age and MELD greater or less than the baseline medians (46.9 years and 28, respectively) revealed that there were trends toward worse outcomes in subjects with MELD and/or age greater than the baseline medians. Conversely, subjects with MELD and/or age less than the baseline medians experienced better outcomes (Fig. 4). The majority of the study population (n = 120) presented with MELD < 28, in which ELAD (n = 51) was associated with lower mortality: 29.4% versus 43.5% in the control group (n = 69; HR, 0.58; P = 0.08). Comparison of the baseline characteristics in this subgroup revealed no significant differences between subjects randomized to ELAD versus control that could have confounded this result (Table 1).
Figure 4.
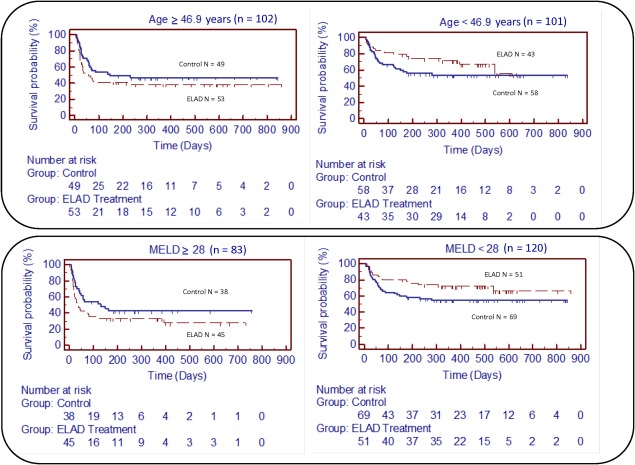
The Kaplan‐Meier analysis is given for the prespecified subgroup analysis with respect to age and baseline MELD. (upper right) The subgroup with age < 46.9 years, at database lock, 14 subjects had died in the ELAD group and 26 in the control group. Remaining at risk were 29 in ELAD and 32 in the control group. (upper left) The subgroup with age > 47 years, at database lock, 32 subjects had died in the ELAD group and 25 in the control group. Remaining at risk were 20 in the ELAD group and 22 in the control group. (lower right) The subgroup with MELD < 28, at database lock, 15 subjects had died in the ELAD group and 30 in the control group. Remaining at risk were 35 in the ELAD group and 37 in the control group. (lower left) The subgroup with MELD > 28, at database lock, 31 subjects had died in the ELAD group and 21 in the control group. Remaining at risk were 14 in the ELAD group and 16 in the control group.
Those with MELD ≥ 28 (n = 83) had a mortality rate of 68.9% in the ELAD group (n = 45) versus 55.3% in the control group (n = 38; HR, 1.50; P = 0.15).
Further analysis of the components of MELD that could be responsible for this effect revealed a trend toward poor survival in subjects who received treatment with ELAD who had severe kidney damage, as defined by creatinine > 1.5 mg/dL, and serious coagulopathy, as defined by INR > 2.5. A high creatinine or high INR predicted a less favorable outcome on ELAD whereas high bilirubin showed no effect on relative survival between the groups.
In the subgroup of the study population that presented with age <46.9 years (n = 101), ELAD (n = 43) was associated with lower mortality compared with the control group (n = 58): 32.6% versus 44.8% (HR, 0.63; P = 0.17). Comparison of the baseline characteristics revealed no significant differences between ELAD and control subjects that could have explained this result (Table 1).
In the study population with ≥46.9 years (n = 102), there was a tendency toward higher mortality in ELAD (n = 53) versus in control (n = 49): 60.4% versus 51.0% (HR, 1.35; P = 0.26).
Although not prespecified, survival in subjects with a combination of both MELD < 28 and age < 46.9 years (n = 59) was significantly better in the ELAD group (n = 26) than in the control group (n = 33; 100% versus 73%; P = 0.006) at 91 days.
STANDARD OF CARE
The 33 of 96 (34.4%) ELAD subjects and 45 of 107 (42.1%) control subjects received a 7‐day standard dose >25 mg of prednisone. Documented reasons for not administering steroids, such as renal failure or infection, were more frequent (n.s.) in the ELAD group; 58 out of 96 (60.4%) ELAD subjects presented with baseline infection under systemic antibiotic therapy compared with 58 out of 107 (54.2%) control subjects. Of the subgroup with baseline infection and systemic antibiotic treatment, 30 out of 58 (51.7%) ELAD subjects and 29 out of 58 (50.0%) control subjects were alive at 91 days, indicating a higher mortality than noninfected patients among both groups.
Survival analyses were run for prednisone use versus no prednisone use and for infection with antibiotic treatment versus no infection. The primary end point analyses showed no difference in outcome of the study for the overall population.
There was also no correlation between pentoxifylline or N‐acetylcysteine use and outcome. Comparison of procedures to manage complications did not differ between groups.
In general, there was no evidence that different administration of standard care affected the outcomes between ELAD and control in the ITT or subgroup analysis.
OVERT AND COVERT ALCOHOL USE
Fewer ELAD subjects had positive postdischarge PEth than controls (28% versus 52%; P < 0.05). Of 49 subjects with a positive PEth test after discharge, only 14 (28.6%) self‐reported alcohol use (P < 0.05); 45 of 49 subjects (91.8%) with positive PEth versus 46 of 71 (64.8%) with no evidence of alcohol use were alive at 91 days (P < 0.05). Subjects with alcohol use were younger and had lower MELD, creatinine, and bilirubin levels at screening and discharge than those without (P < 0.05).
BIOMARKERS
ELAD treatment resulted in a significant reduction of total bilirubin compared with controls at all time points from day 2 to day 7. Significantly more ELAD subjects (56/95, 59%) reached a bilirubin reduction over 20% compared with controls (25/108, 23%) by day 7.
Lille score calculation over that period showed 74.7% were responders (Lille < 0.45) in the ELAD group versus 47% in the control group (P < 0.01). In parallel, during the 7‐day period, the alkaline phosphatase decreased in the ELAD group from 188 ± 110 to 152 ± 81 U/L, whereas it increased from 173 ± 83 to 178 ± 100 U/L in the control group.
None of the other routine clinical chemistry parameters showed significant changes.
Concentration of IL1Ra, a key protein involved in the orchestration of the acute phase response, rose significantly during ELAD therapy, while remaining unchanged in control subjects (Fig. 5).
Figure 5.
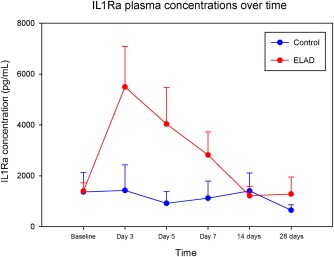
The IL1Ra concentrations of a subset of ELAD (n = 14) and control patients (n = 11) is depicted as means and standard errors. The IL1Ra analysis was conducted on a subset of VTI‐ 208 subjects that met the inclusion criteria for the follow‐up study, VTL 308 (NCT02612428), which focuses on a population with lower MELD and age. Subjects were only included in this subset if they had a full sample set, which included samples from Baseline, Study Days 3, 5, and 7, as well as at least 1 sample from a follow‐up at either 14 or 28 days. Although levels were comparable at baseline, the difference between levels in ELAD versus control subjects was significant (P < 0.05, MWU‐test) at study days 3, 5, and 7 (1 week). Also, in the Wilcoxon signed rank test, IL1Ra levels were elevated compared with baseline significantly at study day 3, 5, and 7 in ELAD patients (P < 0.05), but not in controls.
Concentration of alpha‐fetoprotein (a protein secreted by C3A cells) reached their peak of 884,140 ng/mL within 7 days, with a median of 200,000 ng/mL. Those levels remained above 100 ng/mL in all ELAD patients within 1 month and in 68% of patients within 2 months, but all had normalized at the end of the study.
SAFETY OF ELAD
The percentage of subjects in each group of the safety population that experienced TESAEs was similar between the ELAD (76.8%) and control (69.4%) groups. The percentage of subjects who experienced certain subgroups of TESAEs is shown in Table 2.
Table 2.
TESAEs by System Organ Class Reported by More Than 2 ELAD Subjects
| System Organ Class Serious Adverse Events Preferred Term | Subjects Reporting at Least 1 Serious Adverse Event | |
|---|---|---|
| ELAD (n = 95) | Control (n = 108) | |
| Blood and lymphatic system disorders | ||
| Anemia | 8 (8.4) | 6 (5.6) |
| Coagulopathy | 3 (3.2) | 0 (0.0) |
| General disorders and administration site conditions | ||
| Multiorgan failure | 7 (7.4) | 10 (9.3) |
| Hepatobiliary disorders | ||
| Ascites | 6 (6.3) | 13 (12.0) |
| Hepatic failure | 13 (13.7) | 10 (9.3) |
| Hepatorenal syndrome | 3 (3.2) | 9 (8.3) |
| Infections and infestations | ||
| Sepsis | 4 (4.2) | 2 (1.9) |
| Nervous system disorders | ||
| Hepatic encephalopathy | 8 (8.4) | 6 (5.6) |
| Renal and urinary disorders | ||
| Renal failure | 4 (4.2) | 1 (0.9) |
| Renal failure acute | 6 (6.3) | 12 (11.1) |
| Respiratory, thoracic, and mediastinal disorders | ||
| Respiratory failure | 5 (5.3) | 2 (1.9) |
| Vascular disorders | ||
| Gastrointestinal hemorrhage | 7 (7.4) | 6 (5.6) |
NOTE: Data are given as n (%). These data reflect the safety population (see flowchart in Fig. 2). The number of subjects experiencing system organ class–related serious events and the percentage of subjects is shown. According to Good Clinical Practice Guidelines for Safety Reporting, the determination of seriousness was based on whether the event met one of the following criteria: life threatening, lead to hospital admission and or prolonged hospitalization, upgraded the subject to intensive care, led to death or continued disability, resulted in congenital/birth defects or the event was serious in the opinion of the investigator. Reported serious events were reviewed by a blinded DSMB. In case of a disagreement with the investigator's assessment, the investigator was informed and final assessment required consensus.
Deaths occurring during the 91‐day study period were also comparable between groups, with 39 deaths occurring in the ELAD group and 41 in the control group. On the basis of the study investigators' assessments, 2 deaths in the ELAD group were judged to be related to the interventional treatment: 1 was a precipitation of disseminated intravascular coagulation (DIC) that occurred in a subject with baseline MELD > 28 and 1 was a catheter insertion–related complication.
The number of subjects experiencing TEAEs were balanced between the ELAD and control groups, except for anemia (44% versus 16%, respectively), thrombocytopenia (35% versus 11%), coagulopathy (31% versus 12%), and hypotension (31% versus 17%).
Discussion
AH is a serious condition with a high mortality and no effective treatment. This study enrolled a relatively large group of subjects with a well‐defined clinical diagnosis of AH. The mean MELD score was 27.3 in these subjects, suggesting a 3‐month mortality of approximately 50%,16 highlighting the severity of liver failure in this study. The study failed its primary and secondary end point in a population with sAH (Maddrey's DF > 32) and with a MELD ranging from 18 to 35 and no upper age limit.
Prospective subgroup analysis for MELD < 28 and age less than the baseline median showed strong trends toward improved survival, whereas older patients and those with higher MELD scores had less favorable outcomes on ELAD.
Subanalysis of MELD components suggests that more severe coagulopathy with INR > 2.5 reduced the tolerance of extracorporeal treatment. Although C3A cells have been shown to produce clotting factors in vitro and ex vivo, those effects seem not to outweigh the complex derangements of coagulation observed in advanced liver failure, which are not only an expression of reduced synthesis, but also of increased consumption due to DIC, frequently precipitated by looming infection. The inability to use citrate for anticoagulation with the ELAD system—due to its negative effect on the C3A cells—may have contributed to this problem because heparin has been discussed to be an anticoagulant of second choice in extracorporeal liver support in patients prone to bleeding.17 However, a recent publication showed that low‐dose heparin was associated with an acceptable benefit/risk profile when used for extracorporeal liver support even in severely ill patients with severe acute liver failure.18 Outcomes were worse for subjects treated with ELAD whose MELD scores were ≥28 due to elevated creatinine indicating that kidney failure increases the risk while being treated with ELAD. ELAD cannot remove toxins by filtration or dialysis and thus does not provide renal support. Because of the lack of this function, potential benefits of ELAD cannot compensate for the usual adverse effects of extracorporeal therapy, such as contact activation and anticoagulation, once a subject is in renal failure.
Interestingly, the beneficial effects seen in subjects with MELD scores below the baseline median of 28 seemed to manifest themselves not at the time of treatment, but within the following 2‐3 weeks (Fig. 4). This suggests the primary mechanism of action of C3A cellular therapy is not secondary organ failure support such as in extracorporeal albumin dialysis, but in aiding in recovery of the liver, which is known to take 2‐4 weeks. This is also supported by the fact that age was a second strong covariate that determined response to ELAD and liver regeneration is well‐known to decrease with age. One hypothesized mechanism for how C3A cells may aid in recovery is based on C3A cells supporting the defective acute phase response in vivo. This is exemplified by the significant IL1Ra elevation in the ELAD group, which was not seen in controls.
The reduction of bilirubin in the ELAD group exceeds what can be explained by the dilution in the extracorporeal circuit, and furthermore, C3A cells in ELAD have no mechanism to drain bilirubin into the bile. The parallel reduction of alkaline phosphatase in the ELAD group versus an increase in the control group may suggest bile flow can improve while on ELAD. Although the response measured by the Lille score, the most validated measure for therapy response in AH,19 was significantly better in ELAD, it did not translate into a successful OS benefit, which the authors interpret as a consequence of the worsening of the outcome in nonresponders in the ELAD arm. Similarly, patients with high MELD scores and of older age had worse outcomes, diluting a potential survival benefit indicated by more Lille responders.
Although the results of subgroup analyses must be interpreted with caution, the subgroups according to MELD, creatinine, and coagulation were in fact prespecified, interrelated, and seen in large groups, and the authors applied accepted guidelines in reporting subgroup analyses.20 The subgroup analysis related to age alone was also prespecified. However, because the combined subgroup analysis with respect to age and MELD had not been prespecified, the authors take the results of this combined analysis with specific caution.
Confirming the diagnosis of AH with liver biopsy in this patient population is not routinely performed in many centers. Both AASLD guidelines21 for management of AH as well as recommendations from the National Institute on Alcohol Abuse and Alcoholism1 consider using a liver biopsy for AH diagnosis but recognize the barriers in acquiring a biopsy in this patient population. Our study did not require liver biopsy for diagnosis, and it followed the clinical diagnostic criteria put forth by these groups. It is possible that patients have other underlying diagnoses, but we would not expect the distribution between the treatment and control groups to be different. Only in 16 and 13 patients in the ELAD and the control groups, respectively, did the investigator perform a biopsy to confirm the clinical diagnosis.
The teroids or Pentoxifylline for Alcoholic Hepatitis (STOPAH) trial showed no benefit in 90‐day survival in steroid‐treated patients. Thus, the findings of our study gain increasing importance because there is an unmet need for effective therapy for this highly prevalent, highly mortal hepatic disorder.
Because there were limitations in the study design associated with the patient heterogeneity and a potential uncertainty of diagnosis in 10%‐20% of subjects, a confirmatory study is underway to investigate the reproducibility of these observations through the conduct of a prospective, randomized, controlled clinical study in patients with lower MELD and age (VTL 308‐NCT02612428).
If successful, younger patients with AH who do not respond to medical therapy without renal failure or severe coagulopathy could undergo cellular therapy. This would allow the donor organ pool considered for early transplantation in AH to be directed to patients with more advanced coagulopathy or renal failure.
This article was written by Julie Thompson, Ram Subramanian, and Jan Stange. Major contributions were provided by Ali Al‐Khafaji, Shahid Malik, David Reich, Santiago Munoz, Ross MacNicholas, Tarek Hassanein, Lewis Teperman, and Natasha Jones. Major subject recruitment and additional contributions were provided by Lance Stein, Andrés Duarte‐Rojo, Raza Malik, Talal Adhami, Sumeet Asrani, Nikunj Shah, Paul Gaglio, Anupama Duddempudi, Brian Borg, Rajiv Jalan, Robert Brown, Heather Patton, Rohit Satoskar, Simona Rossi, Amay Parikh, Ahmed ElSharkawy, Parvez Mantry, Linda Sher, David Wolf, Marquis Hart, Charles Landis, Alan Wigg, Shahid Habib, Geoffrey McCaughan, Steven Colquhoun, and the VTI‐208 Study Group.
The statistical analysis was carried out according to a prespecified statistical plan, submitted to the FDA before the end of the study by Sara Rhee from Synteract, Inc. Carlsbad, CA. The article was also reviewed and edited by Michael Millis, Robert Ashley, William Frank, and Andrew Henry, who were all material in the operational aspects of the study.
Clinical trial number: NCT01471028
The study was financed by Vital Therapies, Inc., San Diego, CA.
Jan Stange own stocks in and consults for Vital Therapies and Albutec GmbH. She owns Ja Stange GmbH. Parvez Mantry advises and received contracts from Gilead, Intercept, Merck, and Bristol‐Myers Squibb. He advises Salix and Abbvie. He received grants from Genfit. David Reich and Brian Borg received grants from Vital Therapies, and David Reich consults for Vital Therapies, Inc., San Diego, CA. David Wolf is on the speakers' bureau for Abbvie, Gilead, Intercept, Merck, and Salix. Julie Thompson, Robert Brown, and Lance Stein consult for Vital Therapies. Ram Subramanian consults for and received grants from Vital Therapies. Lee Landeen, William Frank, Robert Ashley, Alyssa Henry, and Patricia Bedard owns stocks in Vital Therapies. Andrés Duarte‐Rojo advises Gilead and recieved grants from Ocera. Michael Millis owns stocks in and consults for Vital Therapies. Lewis Teperman and Michael Millis are members of the Clinical Advisory Board of Vital Therapies, Inc., San Diego, CA. Rajiv Jalan advises and received grants from Ocera. He is on the speakers' bureau of and received grants from Grifols and Sequana. Tarek Hassanein advises, is on the speakers' bureau of, and recieved grants from Abbvie and Bristol‐Myers Squibb. He advises and recieved contracts from Merck and Trek. He is on the speakers' bureau and received grants from Gilead, Salix, and Janssen. He also received grants from Eaisi, Madrigal, Intercept, NGM, Obalon, Ocera, Sundise, Shire, TaiGen, Vital Therapies, Novartis, Boston Biomedical, Cymabay, and Genfit. Alyssa Henry, Patricia Bedard, Lee Landeen, Robert Ashley, William Frank, and Andrew Henry are employees of Vital Therapies, Inc., San Diego, CA.
A list of contributing members is available in the supporting information.
See Editorial on Page 330
REFERENCES
- 1. Crabb DW, Bataller R, Chalasani NP, Kamath PS, Lucey M, Mathurin P, et al.; for NIAAA Alcoholic Hepatitis Consortia . Standard definitions and common data elements for clinical trials in patients with alcoholic hepatitis: recommendation from the NIAAA alcoholic hepatitis consortia. Gastroenterology 2016;150:785‐790. [DOI] [PMC free article] [PubMed] [Google Scholar]
- 2. Gao B, Bataller R. Alcoholic liver disease: Pathogenesis and new therapeutic targets. Gastroenterology 2011;141:1572‐1585. [DOI] [PMC free article] [PubMed] [Google Scholar]
- 3. Lucey MR, Mathurin P, Morgan TR. Alcoholic hepatitis. N Engl J Med 2009;360:2758‐2769. [DOI] [PubMed] [Google Scholar]
- 4. Mehta G, Mookerjee RP, Sharma V, Jalan R. Systemic inflammation is associated with increased intrahepatic resistance and mortality in alcohol‐related acute‐on‐chronic liver failure. Liver Int 2015;35:724‐734. [DOI] [PubMed] [Google Scholar]
- 5. Thursz MR, Forrest EH, Ryder S; for STOPAH investigators . Prednisolone or pentoxifylline for alcoholic hepatitis. N Engl J Med 2015;373:282‐283. [DOI] [PubMed] [Google Scholar]
- 6. DiNubile MJ. Prednisolone or pentoxifylline for alcoholic hepatitis. N Engl J Med 2015;373:281‐282. [DOI] [PubMed] [Google Scholar]
- 7. Verbeke L, Laleman W, Nevens F. Prednisolone or pentoxifylline for alcoholic hepatitis. N Engl J Med 2015;373:281. [DOI] [PubMed] [Google Scholar]
- 8. Artru F, Louvet A, Mathurin P. Liver transplantation for patients with alcoholic hepatitis. Liver Int 2017;37:337‐339. [DOI] [PubMed] [Google Scholar]
- 9. Busuttil RW, DuBray BJ. Liver transplantation for alcoholic hepatitis. Ann Surg 2017;265:30‐31. [DOI] [PubMed] [Google Scholar]
- 10. Obed A, Stern S, Jarrad A, Lorf T. Six month abstinence rule for liver transplantation in sever alcoholic liver disease. World J Gastroenterol 2015;21:4423‐4426. [DOI] [PMC free article] [PubMed] [Google Scholar]
- 11. Ezquer F, Bruna F, Calligaris S, Conget P, Ezquer M. Multipotent mesenchymal stromal cells: a promising strategy to manage alcoholic liver disease. World J Gastroenterol 2016;22:24‐36. [DOI] [PMC free article] [PubMed] [Google Scholar]
- 12. Lanthier N, Lin‐Marq N, Rubbia‐Brandt L, Clément S, Goossens N, Spahr L. Autologouse bone marrow‐derived cell transplantation in decompensated alcoholic liver disease: what is the impact on liver histology and gene expression patterns? Stem Cell Res Ther 2017;8:88. [DOI] [PMC free article] [PubMed] [Google Scholar]
- 13. Landeen LK, Van Allen J, Heredia N, Lapetoda J, Bedard PW, Brotherton JD, et al. Expression of acute‐phase proteins by ELAD C3A Cells. Transplantation 2015;99:208; 21st Annual International Congress of the International‐Liver‐Transplant‐Society (ILTS) July 08‐11, 2015, Chicago, IL.
- 14. Bedard PW, Lapetoda J, Van Allen J, Heredia N, Michalopoulos GK, Landeen LK. ELAD VTL C3A cells may impact liver regeneration through secreted factors. Hepatology 2015;62(suppl 1):1071A. [Google Scholar]
- 15. Teperman L. The ELAD Study Group . Bilirubin Improvement correlates with 90-day survival with use of the ELAD® system in a randomized, controlled study of subjects with acute alcoholic hepatitis or acute decompensation of cirrhosis [abstract]. Am J Transplant 2013;13(suppl 5):147. 23465008 [Google Scholar]
- 16. Dunn W, Jamil LH, Brown LS, Wiesner RH, Kim WR, Menon KV, et al. MELD accurately predicts mortality in patients with alcoholic hepatitis. Hepatology 2005;41:353‐358. [DOI] [PubMed] [Google Scholar]
- 17. Mitzner SR. Extracorporeal liver support‐albumin dialysis with the Molecular Adsorbent Recirculating System (MARS). Ann Hepatol 2011;10(suppl 1):S21‐S28. [PubMed] [Google Scholar]
- 18. Larsen FS, Schmidt LE, Bernsmeier C, Rasmussen A, Isoniemi H, Patel VC, et al. High‐volume plasma exchange in patients with acute liver failure: an open randomised controlled trial. J Hepatol 2016;64:69‐78. [DOI] [PubMed] [Google Scholar]
- 19. Louvet A, Naveau S, Abdelnour M, Ramond MJ, Diaz E, Fartoux L, et al. The Lille model: a new tool for therapeutic strategy in patients with severe alcoholic hepatitis treated with steroids. Hepatology 2007;45:1348‐1354. [DOI] [PubMed] [Google Scholar]
- 20. Wang R, Lagakos SW, Ware JH, Hunter DJ, Drazen JM. Statistics in medicine‐‐reporting of subgroup analysis in clinical trials. N Engl J Med 2007;357:2189‐2194. [DOI] [PubMed] [Google Scholar]
- 21. O'Shea RS, Dasarathy S, McCullough AJ; for Practice Guideline Committee of the American Association for the Study of Liver Diseases; Practice Parameters Committee of the American College of Gastroenterology . Alcoholic liver disease. Hepatology 2010;51:307‐328. [DOI] [PubMed] [Google Scholar]