

Abstract
Over 22,000 species of biotically pollinated flowering plants, including some major agricultural crops, depend primarily on bees capable of floral sonication for pollination services. The ability to sonicate (“buzz”) flowers is widespread in bees but not ubiquitous. Despite the prevalence of this pollinator behavior and its importance to natural and agricultural systems, the evolutionary history of floral sonication in bees has not been previously studied. Here, we reconstruct the evolutionary history of floral sonication in bees by generating a time‐calibrated phylogeny and reconstructing ancestral states for this pollen extraction behavior. We also test the hypothesis that the ability to sonicate flowers and thereby efficiently access pollen from a diverse assemblage of plant species, led to increased diversification among sonicating bee taxa. We find that floral sonication evolved on average 45 times within bees, possibly first during the Early Cretaceous (100–145 million years ago) in the common ancestor of bees. We find that sonicating lineages are significantly more species rich than nonsonicating sister lineages when comparing sister clades, but a probabilistic structured rate permutation on phylogenies approach failed to support the hypothesis that floral sonication is a key driver of bee diversification. This study provides the evolutionary framework needed to further study how floral sonication by bees may have facilitated the spread and common evolution of angiosperm species with poricidal floral morphology.
Keywords: Bee phylogeny, buzz pollination, diversification, floral sonication, pollen foraging
The complex interaction between flowering plants (angiosperms) and their pollinators has resulted in notable cases of convergent evolution (e.g., Cook et al. 2004; Vallejo‐Marín et al. 2010), coevolution (e.g., Pellmyr and Thompson 1992; Anderson and Johnson 2007; Thompson et al. 2013), and shifts in floral diversification (e.g., Sargent 2004; van der Niet and Johnson 2012). Angiosperms have repeatedly evolved floral morphologies that conceal floral rewards, including pollen and nectar, and concealment is hypothesized to promote effective pollinator services (Harder and Barclay 1994; Hargreaves et al. 2009 and references within). To extract these concealed rewards, pollinators must frequently use complex flower handling behavioral routines (e.g., Macior 1968; Laverty 1980; Buchmann 1983; Laverty and Plowright 1988; Lewis 1993; Westerkamp 1999). Among the best studied of these interactions is floral sonication by bees, commonly referred to as buzz pollination. Approximately 6% of the world's estimated 352,000 species of flowering plants conceal their pollen within tube‐like poricidal anthers or, occasionally, corollas, and depend primarily on sonicating bees for pollination services (Buchmann 1983; De Luca and Vallejo‐Marín 2013; Corbet and Huang 2014).
Plant species with such poricidal floral morphology (>22,000 species) are widely distributed across at least 27 angiosperm orders, 72 families, and 544 genera (Buchmann 1983). Commonly grown agricultural crops that require floral sonication include blueberries, cranberries, kiwis, chili peppers, eggplants, and tomatoes. The evolution and diversification of poricidal angiosperms is thought to reflect selection by sonicating bees (De Luca and Vallejo‐Marín 2013; Russell et al. 2017). Yet surprisingly, the evolutionary origin(s) and history of floral sonication behavior in bees is unknown.
Floral sonication typically consists of a female bee biting poricidal anthers or corollas with her mandibles and rapidly contracting her indirect flight muscles, generating vibrations that release pollen from the tube‐like structures (Macior 1964; King and Buchmann 2003; Russell et al. 2016; Switzer et al. 2016). At least 74 of the 508 recognized genera of bees (comprising 58% of all bee species: Table S1) sonicate flowers to extract pollen, but many species, including the honey bee, cannot do so. Pollen is a critical component of the bee diet (especially for the larvae), as it is their primary source of proteins and amino acids (Kevan and Baker 1983; Nicolson and van Wyk 2011 and references within). Relative to bees that cannot sonicate, sonicating bees should generally be able to collect pollen from a wider variety of plant species. Further, the pollen of poricidal angiosperm species often dominates the diet of bee species capable of sonicating, sometimes constituting greater than three‐quarters of their pollen diet (e.g., Camillo and Garofalo 1989; Ramalho et al. 1990; Serra et al. 2012; Hilgert‐Moreira et al. 2013; Villanueva Gutierrez et al. 2013).
Behaviors that enable access to novel ecological opportunities expose organisms to selective pressures that can promote rapid adaptive divergence (Duckworth 2008 and references within; Lapiedra et al. 2013). Additionally, flexibility in behavior is associated with increased diversification (Tebbich et al. 2010). Floral sonication behavior enables access to the pollen of poricidal angiosperm species and is also a key component of flexible pollen foraging behavior, allowing sonicating bees to extract pollen efficiently from other floral morphologies (Russell et al. 2017). We therefore hypothesized that floral sonication behavior could promote increased diversification in sonicating bee lineages. The evolutionary consequences of interactions between foraging animals and their biotic resources have been frequently studied in the context of plant‐pollinator mutualisms. However, to our knowledge no studies have characterized the evolution of floral sonication or patterns of bee diversification related to the presence or absence of this pollen extraction behavior.
In the present study, we reconstruct the probable evolutionary history of floral sonication behavior used by bees. We accomplished this by generating a large and inclusive time‐calibrated bee phylogeny, based on seven gene fragments, 389 bee species (representing over 55% of the 508 extant bee genera), and dated fossil bees. We carried out an extensive library and online literature search to identify all presently known genera of sonicating bees. Further, we contacted bee taxonomists, bee collectors and pollination ecologists (listed in Table S1 and acknowledgements) to tap into their unpublished observations. We used a Bayesian stochastic mapping approach to infer: (1) the number of independent origins of floral sonication behavior, (2) the number of evolutionary reversals, and (3) the geologic ages of sonicating bee lineages. Lastly, to see if floral sonication behavior is associated with increased diversification in bees, we performed a sister‐clade comparison analysis (Mitter et al. 1988; Sargent 2004), reconstructed diversification rates across the phylogeny, and used a semi‐parametric test to see if the major shifts in diversification rates found are associated with bees’ ability to sonicate flowers.
Methods
DATA SOURCES
Along with the previous dataset of Cardinal and Danforth (2013), we added any species from a genus not already represented in the dataset that had at least four of the seven gene fragments available in GenBank (except for a few key taxa that only had three fragments available). We chose this more targeted approach in our data sampling over using a complete supermatrix approach as in Hedtke et al (2013) to avoid problems encountered with high amounts of missing data (∼85% in Hedtke et al. 2013) when trying to time‐calibrate the phylogeny. The final dataset included 372 bee species (representing over 55% of all extant bee genera), along with 16 apoid wasp outgroups, and 9655 characters from seven gene fragments (28S, 18S, EF1α, wingless, opsin, Pol II, NaK) with 19% missing data. A list of taxa and GenBank numbers added to the Cardinal and Danforth (Cardinal and Danforth 2013) dataset is available in Table S2.
PHYLOGENETIC ANALYSES
All gene fragments were aligned in Geneious version R8 (Kearse et al. 2012) using the default settings for MUSCLE alignment. Alignments for the nuclear ribosomal genes (18S, 28S) were subsequently adjusted by referring to the secondary structure of these genes proposed for Apis mellifera (Gillespie et al. 2006). Regions that could not be aligned with confidence (some loop regions of the ribosomal genes, intron regions of opsin and EF1α) were excluded from the phylogenetic analyses.
The aligned dataset was divided into four partitions: (1) ribosomal genes 18S and 28S, (2) 1st codon position of protein coding genes, (3) 2nd codon position of protein coding genes, and (4) 3rd codon position of protein coding genes. Based on model tests done in jModelTest2 (Darriba et al. 2012), the symmetrical model (SYM) (Zharkikh 1994) with a proportion of invariable sites (I) and rate variation among sites with four rate categories (G) was applied to partitions one and two. The general time reversible (GTR) model (Lanave et al. 1984) with IG was applied to partitions three and four. Eight independent analyses with four chains each were run using Markov chain Monte Carlo (MCMC) methods in MrBayes v.3.2.1 (Ronquist et al. 2012). The number of generations for each run varied from 41,491,000 generations to 54,197,000 generations for a total of 376,840,000 generations. The parameter trace files of each run were observed in TRACER v.1.6 (Rambaut et al. 2014) to verify that the runs had converged on the stationary distribution and to determine the appropriate number of generations to discard as burn‐in which was ∼10% for each run. The tree files were combined and resampled in LogCombiner v.1.8 (Drummond et al. 2012) and a maximum clade credibility tree (MCCT) was constructed from the subsampled tree file containing 8477 trees in TreeAnnotator v.1.8 (Drummond et al. 2012).
ESTIMATING AGES OF SONICATING LINEAGES
We used a Bayesian uncorrelated relaxed‐clock (UCLN) model (Drummond et al. 2006) with multiple calibration points to estimate the ages of the various sonicating lineages in the program BEAST v.1.8 (Drummond et al. 2012). We partitioned the dataset and applied the same models of nucleotide substitution as described above, and allowed the tree topology to be estimated to accommodate for phylogenetic uncertainty. We randomly selected a starting tree from the posterior distribution of trees from the MrBayes analysis, then scaled this tree so that it was consistent with all of our calibration points, and used a birth‐death model on the tree (Gernhard 2008).
The tree was time‐calibrated by applying a prior probability on the ages of 34 internal calibration nodes (Fig. S1, Table S3). Age estimates were based on paleontological evidence that was most recently reviewed in Michez et al. (2012). We used fossil bee taxa that could be confidently assigned to extant taxonomic groups and nodes represented in our dataset, and for which precise stratigraphic information was available. Uncertainty in the age of calibration points was incorporated into the analysis by assuming that the prior probability of the node being a certain age follows a lognormal distribution with a rigid minimum and maximum bound. This allows us to assume that the actual divergence event took place sometime prior to the earliest appearance of fossil evidence, and that the age of the node is more likely to be close to the age of the oldest known fossil and less likely to be significantly older.
For each calibration point, the minimum age was set to the youngest age assigned to the fossil being used to calibrate that node. The maximum age was set to the start of the Jurassic period 201 million years ago (mya) as it seems extremely unlikely that any aculeates (the clade that includes stinging ants, bees, and wasps) were present before the Jurassic. The earliest evidence of aculeates is a series of Bethylonymidae compression fossils from the latest Jurassic, and the remainder of aculeate fossils are restricted to Cretaceous or younger deposits (Grimaldi and Engel 2005). The mean age was calculated by adding 20% to the minimum age of the fossil when we believed the placement of the fossil on the starting tree to be quite accurate. When the placement of the fossil was thought to be less precise, or if the calibration node was on a long stem, 30% was added to the minimum fossil age instead. A standard deviation of 0.1 was used in all cases and the groups defined by these calibration nodes were constrained to be monophyletic in all cases except calibration node 26 where the posterior probability (PP) for that node was below 0.96 in the MCCT generated from the MrBayes analysis. When a fossil could confidently be placed within the crown group, the calibration point was not permitted to be placed along the stem of that node, but otherwise it was. All calibration point priors are summarized in Table S3.
In addition to the 34 calibration nodes based on fossils, a uniform prior date of 100–201 mya was placed on the root node. The minimum age was set to 100 mya as there is a stem group bee fossil Melittosphex burmensis that is estimated to be 100 million years old (myo) (Danforth and Poinar 2011). Seven individual analyses were run ranging from 56,268, 000 generations to 87,285,000 generations each for a total of 513 million generations. The individual runs were combined as described above for the MrBayes analyses and a MCCT (Fig. S2, S3) was calculated from the combined resampled tree file containing 7607 trees.
ANCESTRAL STATE RECONSTRUCTION OF FLORAL SONICATION BY BEES
To reconstruct the evolutionary history of floral sonication on our time‐calibrated phylogeny, we pruned the tree to include only one representative per genus (unless the genus was not monophyletic) and coded all genera as either containing species known to sonicate flowers, or not containing any species known to sonicate flowers. When a genus was not monophyletic, we coded at the subgenus level whenever possible. Table S1 lists all genera for which at least one species has been documented in the literature or observed by us or other bee researchers as sonicating.
We reconstructed ancestral states using a Bayesian stochastic mapping approach (Huelsenbeck et al. 2003; Bollback 2006) in R. We utilized the BEAST MCCT and the stochastic mapping procedures implemented in the phytools package (Revell 2012) to perform 1000 simulations in which the character histories were conditioned using an all rates different model. The best‐fit model of character evolution was determined by fitting an equal rates model and an all rates different model to the dataset using the R package Ape (Paradis et al. 2004) and performing a likelihood ratio test to see which model had a significantly better fit (equal rates likelihood = –148.2711, all rates different likelihood = –138.8727, P < 0.001).
FLORAL‐SONICATION‐DEPENDENT DIVERSIFICATION
To test our null hypothesis that species numbers in nonfloral sonicating clades are lower than, or equal to the number of species in floral sonicating clades, we made a sister‐clade comparison analysis (Mitter et al. 1988; Farrell et al. 1991; Sargent 2004). We first determined the number of species each terminal branch in our tree represented using the online Discover Life bee species guide and world checklist of bees (Hymenoptera: Apoidea: Anthophila) (Ascher and Pickering 2016). When all genera within a tribe were present in the tree, then species numbers were assigned at the generic level. When a tribe did not have a representative from each genus, or if the number of species found in the missing genera accounted for more than two percent of the species in that tribe, then species numbers were instead assigned at the tribal level. This was done to insure that most species were accounted for in our tree, not just those from the genera included in the phylogeny. Based on the results of our ancestral state reconstruction, we identified all sister‐pairs of floral buzzing and nonbuzzing lineages for which we could confidently assign the number of species in both clades involved, and for which the ancestral state reconstructions were not ambiguous (i.e., for which the two sister taxa were fixed for the difference). We eliminated pairs whenever one of the sister clades was predominantly composed of cleptoparasites (i.e., nonpollen‐collecting female “cuckoo bees”), or where another pair was nested within one of the clades (e.g., Bombus, Macrogalea, Thygater, Eucera, Protoxaea, Augochloropsis, Lasioglossum, Stenotritidae, Paracolletes, Ptiloglossa, Hylaeus, Trichocolletes, and Anthophora). Sonicating lineages that are thought to be sister to cleptoparasitic clades include Euglossa, Eulaema + Eufriesea, Exoneura, Megachile, and Thrinchostoma. We also did not include pairs if we suspected that the actual sister clade of the sonicating lineage was not included in our phylogeny, or if the phylogenetic placement of a sonicating lineage was uncertain based on previously published phylogenies (e.g., Nomiinae, Protandrena, Rophites, Osmia, and Paratetrapedia). In total, we compared 12 sister clade pairs (Table 1). For each pair, we subtracted the number of species in the nonfloral‐buzzing lineage from the number of species in the floral‐buzzing sister lineage. We examined whether there was a detectable trend in the direction of the difference using a one‐tailed sign test and by testing whether the mean difference in species number between sister groups differed from zero using the non‐parametric Wilcoxon signed‐rank test following Sargent (2004).
Table 1.
Sister group comparisons for flower sonicating lineages
| Pair | Sonicating clade | # species | Nonsonicating sister clade | # species | ± |
|---|---|---|---|---|---|
| 1 | Melitta | 50 | Rediviva + Redivivoides | 29 | +21 |
| 2 | Alocandrena + Andrena | 1527 | Megandrena | 2 | +1525 |
| 3 | Meliturgula | 21 | Plesiopanurgus | 5 | +16 |
| 4 | Agapostemon | 42 | Dinagapostemon + Rhinetula | 11 | +31 |
| 5 | Patellapis | 211 | Mexalictus | 26 | +185 |
| 6 | Halictus | 231 | Thrincohalictus | 1 | +230 |
| 7 | Colletes | 484 | Mourecotelles (Hemicotelles) | 3 | +481 |
| 8 | Amphylaeus | 4 | Meroglossa | 20 | –16 |
| 9 | Hoplitis | 376 | Haetosmia | 3 | +373 |
| 10 | Habropoda | 55 | Pachymelus | 21 | +34 |
| 11 | Xylocopa | 375 | Tetrapedia | 25 | +350 |
| 12 | Exomalopsis | 88 | Anthophorula | 63 | +25 |
The sister clades compared are listed along with the number of species known in each lineage. + Indicates that the sonicating lineage has more species; – indicates that the lineage not known to sonicate flowers contains more species.
We also determined if floral sonication behavior was associated with increased diversification within bee lineages using information from throughout the tree instead of a set of clade pairs. To accomplish this we used the STRAPP (Structured Rate Permutations on Phylogenies) approach instead of a character state‐dependent speciation‐extinction models (SSE) approach. Since SSE models to test for trait‐dependent diversification in a probabilistic framework were first introduced by Maddison et al. (2007) to address some of the limitations of sister‐clade comparisons, numerous studies have reported significant correlations between character states and rates of species diversification (e.g., Johnson et al. 2011; Price et al. 2012). However, these SSE models have been found to have high Type I error rates (FitzJohn 2012; Machac 2014; Rabosky and Goldberg 2015) leading to a substantial excess of trait‐diversification associations in the literature (Rabosky and Goldberg 2015). Therefore, we decided to use the STRAPP approach that does not attempt to jointly reconstruct the history of character change and diversification, but instead uses structured permutations to generate null distributions of evolutionary rates across the tips of the tree, which are then used to test for association between character state and differential rates of species diversification, making it much less prone to false positives (Rabosky and Huang 2015).
We first reconstructed diversification rates across the phylogeny using Bayesian Analysis of Macroevolutionary Mixtures (BAMM) 2.5 (Rabosky 2014) that uses a reversible jump MCMC approach. To set appropriate priors for the speciation‐extinction analysis, we used the function setBAMMpriors in the R BAMMtools package (Rabosky et al. 2014). To account for incomplete taxon sampling, we specified a backbone sampling fraction equal to 1.0 and then defined clade‐specific sampling probabilities according to the number of species assigned to each exemplar/clade in the tree as described above. The diversification rate analysis was run for 50 million generations and the expected number of shifts was set to 1 so as not to bias our results toward finding rate heterogeneity. BAMMtools was used to assess MCMC convergence, discard burn‐in, and verify effective sample sizes. Bayes factors were computed to compare all rate shift models that were sampled in the posterior. We used a semi‐parametric test to see if the major shifts in diversification rates found are associated with bees' ability to sonicate flowers by using the function traitDependentBAMM in the R BAMMtools package and selecting a two‐tailed Mann–Whitney statistical test on diversification rates and doing 10,000 replicates. The implementation of this approach is referred to as STRAPP in Rabosky and Huang (2015).
Results
PHYLOGENETIC RELATIONSHIPS
In both MCCTs generated from the MrBayes analysis (Fig. S1) and the time calibrated BEAST analysis (Fig. S2), all bee families were monophyletic and well supported except for Melittidae, whose PP was only 0.72 in the MrBayes tree. Relationships between families however differed between the two types of analyses. In both cases, the long‐tongued bees (LT) formed a well‐supported monophyletic group (PP = 1) as did Colletidae + Stenotritidae (PP = 1), and (Colletidae + Stenotritidae) + Halictidae (PP = 1). However, in the MrBayes MCCT, the initial split in bees is between Melittidae and all other bee families (PP = 1), whereas in the BEAST MCCT, the initial split is between LT and short‐tongued (ST) bees (PP = 1). The MrBayes tree is largely congruent with most recent molecular analyses which place Melittidae as sister to all remaining bees (Hedtke et al. 2013; Branstetter et al. 2017; Peters et al. 2017). It appears that our implementation of a relaxed molecular clock altered the placement of Andrenidae from sister to ((Colletidae + Stenotritidae) + Halictidae) + LT bees, to sister to Melittidae.
Relationships within Melittidae and Andrenidae are the same in both MCCTs. Within Colletidae and Halictidae, relationships between subfamilies are the same in both MCCTs, but there are a few slight differences in the exact relationships of some genera. Within Megachilidae, Lithurginae is the only monophyletic subfamily in the MrBayes MCCT, but in the BEAST MCCT, all subfamilies are monophyletic, although most are only weakly supported (PP Fideliinae = 0.62, Lithurginae = 1, Megachilinae = 0.78, Pararhophitinae not testable). Within Apidae, Nomadinae is always monophyletic and well supported (PP = 1) but Apinae is split into several lineages. Xylocopinae is monophyletic (PP = 0.67) in the MrBayes MCCT, but in the BEAST MCCT Tetrapedia falls within Xylocopinae sister to Xylocopini (PP = 0.82) instead of being sister to it.
DIVERGENCE TIME ESTIMATES
We estimate that crown group bees arose during the Early Cretaceous around 125 mya (95% Highest Posterior Density interval (HPD) 127–156 mya) (Fig. 1, S3). The estimated mean crown age and 95% HPD for each family are as follow: Melittidae 97 myo (79–125 myo), Andrenidae 67 myo (54–85 myo), Halictidae 94 myo (82–106 myo), Stenotritidae 20 myo (7–37 myo), Colletidae 70 myo (60–81 myo), Megachilidae 103 myo (92–115myo), and Apidae 104 myo (95–113 myo). The mean and 95% HPD of all crown and stem lineages in this phylogeny are shown in Figure S3.
Figure 1.
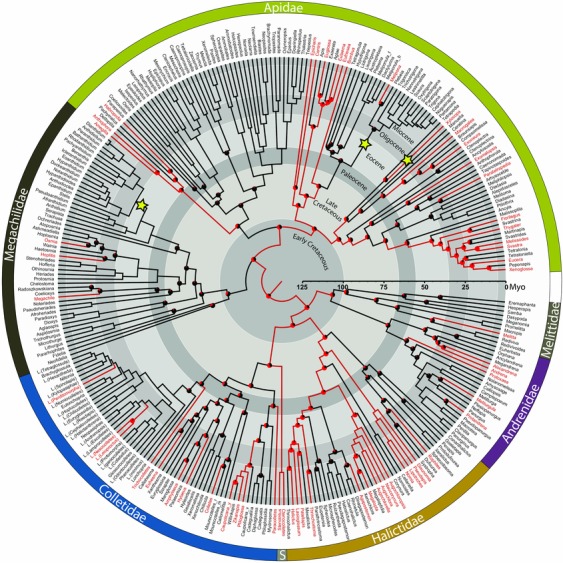
Time calibrated phylogeny showing the evolutionary history of floral sonication in bees. Terminal taxa of the MCCT were pruned to include only one representative per genus unless the genus was not monophyletic (nonmonophyletic genera are followed by the first letter of the exemplar species name). Terminal taxa marked in red indicate lineages with at least one bee species known to use floral sonication (Table S1) and those marked in black indicate lineages for which no bee species have been reported to use floral sonication. Branches were color coded according to the results of the Bayesian stochastic mapping analysis. Red branches lead to nodes where the posterior probability of that common ancestor using floral sonication was above 0.5, and black branches lead to nodes where it was below 0.5. Nodes in which the posterior probability of one state over the other was below 0.95, a pie chart is added representing the proportional posterior probability of each state. The locations of the three core shifts (increases) in diversification rates are indicated by yellow stars.
EVOLUTIONARY HISTORY OF FLORAL SONICATION
Based on our Bayesian stochastic mapping analysis, we estimate that floral sonication may have first evolved during the Early Cretaceous in the common ancestor of bees, although with low confidence (PP = 0.75) (Fig. 1). The oldest date we can state with confidence (PP > 0.95) for the evolution of floral sonication in any bee taxa is in the common ancestor of Nomiinae 39.2 mya (HPD: 25–55 mya) (Fig. 1, S3). Throughout the Cretaceous and Cenozoic, we estimate that floral sonication minimally evolved on average 45 times within bees (95% credibility interval 31.5–58.4) and that there have been on average 66 reversals back to nonsonicating behavior (95% credibility interval 37.7–87.5) (Fig. 1). We qualify our estimates with the term minimally, because it is possible that there have been multiple transitions between floral sonication and not sonicating within a genus that we have not captured due to incomplete species‐level behavioral information available on sonicating taxa. It is also likely that some genera have not yet been recorded as sonicating and could potentially represent undocumented sonicating lineages. Some buzzing genera were not included in our phylogeny due to a lack of available sequence data, and may represent additional transitions between nonsonicating and sonicating taxa (see Supporting Information for discussion of genera known to use floral sonication that could not be included in the phylogeny).
DIVERSIFICATION AND FLORAL SONICATION
The sister‐clade comparison analysis found that sonicating bee genera are significantly more species rich than nonsonicating sister genera. In 11 out of 12 sister‐group comparisons the lineage capable of floral sonication was more diverse than its sister group (P = 0.003174, one‐tailed sign test) and the mean difference in species number between sister groups was significantly greater than zero (n = 12, P = 0.0018).
Our analysis to detect changes in diversification rates converged well (effective sample size (ESS)log‐likelihood = 863.1, ESSnumber of shifts = 1557.8, stationarity of the MCMC observed). We recovered 18 significant rate shifts according to Bayes factors (BF = 28,086 over the null model). The post burn‐in posterior distribution of the number of shifts supported models with one to 12 shifts, each with PP < 0.15. The 95% credible set of rate shift configurations sampled 29,498 distinct shift configurations (each with PP < 0.004) making it difficult to summarize the placement of these shifts on the tree. Therefore, we only present the single best configuration that contained three shifts: one increase within Anthidiini (a tribe of large colorful bees in the family Megachilidae), one increase along the branch leading to the common ancestor of Xylocopa (large carpenter bees), and one increase within Meliponini (stingless bees) (Fig. 1). Despite two of these increases being associated with shifts to floral sonication, and a positive correlation between floral sonication and tip‐level diversification (mean observed correlation coefficient = 0.1069), our STRAPP analysis does not support the hypothesis that floral sonication was a key evolutionary innovation in bees because the test statistic does not differ significantly from zero (P = 0.2778, Mann–Whitney U‐test).
Discussion
The repeated evolution of floral sonication in bees (Fig. 1) suggests that this behavior may be particularly easy to evolve. The common ancestor of bees perhaps first evolved this behavior from other preexisting buzzing behaviors (Michener 1962; Buchmann 1985). Bees, along with other aculeate Hymenoptera (bees, ants, and wasps), produce vibrations used in numerous behavioral contexts, including nest excavation, mating, or communication in social forms (e.g., Evans 1959; Alcock and Buchmann 1985; Towne 1985; Larsen et al. 1986; Nieh 1998; Kirchner and Röschard 1999; Dyer 2002; Hrncir and et al. 2006; Hrncir et al. 2011). Most bees also emit a distinctive “alarm buzz” if captured or disturbed by predators (Larsen et al. 1986; De Luca et al. 2014). Further work will be required to determine if one or more of these buzzing behaviors might be exaptations underlying the evolution of floral sonication in different bee taxa.
Additionally, our results suggest that strong selection pressures exist for bee taxa to evolve this complex pollen collection behavior. Competition for pollen among bees is often strong and has large effects on bee fitness (Cane and Tepedino 2016). Floral sonication enables efficient collection of pollen from diverse floral morphologies (see Russell et al. 2017) and allows access to the pollen of more than 22,000 flowering plant species that possess poricidal floral morphology and thereby restrict pollen collection primarily to sonicating bees (Buchmann 1983). As a result of these expanded ecological opportunities, we predicted that floral sonication could lead to higher diversification rates amongst sonicating bee taxa. Although we found observations of sonicating bee species in only 15% of bee genera, these 74 genera comprise more than 58% of known bee species. We find that sonicating bee genera are significantly more species rich than nonsonicating sister genera when comparing sister clades. However, this result is correlative; it is also possible that bee taxa with higher diversification rates display a relatively greater number of feeding strategies. Future work will be required to characterize such variation across the Anthophila.
Our significant association based on sister‐clade comparisons should be interpreted with some caution: using this approach differential speciation cannot be distinguished from differential extinction (Barraclough and Nee 2001) and higher character state transition rates can be misinterpreted for increased diversification (Maddison 2006). Furthermore, we excluded clades with mixed states. Our STRAPP analysis did not support the hypothesis that floral sonication is a key evolutionary innovation in bees. This could be due to STRAPP requiring repeated associations between the character state and diversification to detect an effect. Although we estimate that floral sonication evolved 45 times, we only detected three core shifts in diversification in our bee phylogeny. STRAPP depends on BAMM to identify lineage‐specific diversification rates, which has recently been criticized (Moore et al. 2016), but see Rabosky et al. (2017) for a response to the critique. Despite STRAPP being able to accommodate extremely sparse sampling of character states at the tips of the tree (Rabosky and Huang 2015) and account for incomplete taxon sampling, our phylogeny includes only 1.9% of bee species, which could limit our ability to detect shifts in diversification rates and character state associations using a probabilistic approach. Future studies examining the relationship between the evolution of floral sonication and shifts in diversification will need to focus on producing phylogenies with dense taxon sampling for specific lineages that contain several shifts in the use of sonication.
Despite the apparent advantage of efficiently accessing pollen from a wide variety of floral morphologies, we estimate an average of 66 independent losses of floral sonication (e.g., in Megaloptidia and Xenochlora). Such losses might be facilitated if the gains in collecting pollen via floral sonication are outweighed by the energetic costs of floral sonication, which are thought to be large (see Harder et al. 2001), especially for smaller bees (De Luca et al. 2014). The individual buzzes of smaller bees are longer and of lower peak amplitude (De Luca et al. 2014; De Luca and Vallejo‐Marín 2013). Longer buzzes are presumably relatively more costly and lower peak amplitude buzzes release significantly less pollen (King 1993; Harder and Barclay 1994; De Luca and Vallejo‐Marín 2013). Although both very large (e.g., Xylocopa species >20 mm in length) and very small (e.g., Andrena and Lasioglossum species <4 mm in length) species are capable of performing floral sonication, future studies may find a correlation between bee size and reliance upon floral sonication.
Floral sonication behavior might also be lost or fail to evolve if bee taxa evolved separate behaviors that allowed them to exploit these same pollen sources. For instance, some bee taxa extract pollen concealed by poricidal species by drumming or milking the anthers (e.g., Apis and Osmia), or biting into them (e.g., Trigona) (Wille 1963; Buchmann 1983; Thorp 2000). Furthermore, many bee species (e.g., Apis, Trigona, and Nannotrigona) that do not sonicate flowers have been observed gleaning pollen on the surfaces of the flower, left by bees that sonicate poricidal species (e.g., Wille 1963; Buchmann 1983; Gao et al. 2006; Solís‐Montero et al. 2015). In these ways nonfloral sonicating bees could gain limited access to the pollen of poricidal species without expending the energy required to sonicate them. To our knowledge, no studies have yet assessed the prevalence or efficiency of such alternative pollen extraction behaviors across the Anthophila, or whether they coincide with the absence of floral sonication behavior.
The collection of pollen by bees is thought to explain the prevalence and amazing diversity of floral forms that conceal or restrict collection of their pollen (Castellanos et al. 2017; Hargreaves et al. 2009 and references within). For instance, many plant species have evolved strongly curved petals (e.g., Senna and Cassia) to deflect ejected pollen and/or divide their pollen amongst “feeding” and “pollinating” anther sets (e.g., Solanum and Melastoma), thereby optimizing pollen delivery by sonicating bees (e.g., Wolfe and Estes 1992; Westerkamp 2004; Vallejo‐Marín et al. 2010; Papaj et al. 2017). Because poricidal species typically depend on sonicating bees for pollination services (Buchmann 1983; De Luca and Vallejo‐Marín 2013), our results suggest that the evolution of poricidal floral morphology in angiosperms might coincide with the evolution of floral sonication in bees. Many sonicating bee clades evolved during the same time periods as the most speciose bee‐pollinated poricidal angiosperm clades. For example, the poricidal genus Solanum (with ∼2000 species) has an estimated crown age of 14–29.5 myo (De‐Silva et al. 2017), and we estimate that floral sonicating bumble bees (Bombus) and orchid bees (Eulaema, Eufriesea, Euglossa, and nonsonicating cleptoparasitic Aglae and Exaerete) have a crown age of 10–32 and 23–30 myo, respectively (Fig. S3). The poricidal Fabaceae genus Senna (with ∼350 species) has an estimated stem age of 40 myo (Forest et al. 2007) as does the poricidal lineage within Melastomateceae (with ∼3800 species, which excludes clades such as Mouriri, Memecylon, and Pternandra) (Berger et al. 2016). Similarly, the floral sonicating Centris are estimated to have a crown age of 25–50 myo (Fig. S3).
To conclude, poricidal angiosperm species are thought to depend primarily upon sonicating bees for pollination, and floral sonication behavior is thought to have facilitated the repeated convergent evolution of poricidal floral morphology (Buchmann 1983; De Luca and Vallejo‐Marín 2013; Russell et al. 2017). With our time‐calibrated phylogeny we set the stage for studies correlating the biogeographical history of sonicating bees and poricidal plant taxa, which will be needed to determine whether the spread of sonicating bee taxa typically preceded the evolution of co‐occurring poricidal angiosperms. Our reconstruction of the evolution of floral sonication depends on field observations of this behavior, but despite our extensive documentation (i.e., Table S1) this task is not complete. Decades of careful observation indicate that many bee genera do not use floral sonication. Yet buzzing genera are frequently supported only by one reference to a single sonicating bee species. We therefore hope that the sonicating bee list we provide in Table S1 will assist researchers in determining where to focus their future sampling efforts. Finally, a determination of within‐genus evolution of floral sonication will require observing putatively nonsonicating bee species interacting with a variety of poricidal plant species to determine whether they indeed do not use floral sonication.
Associate Editor: S. Smith
Handling Editor: P. Tiffin
Supporting information
Figure S1. Maximum clade credibility tree from the MrBayes phylogenetic analysis. Posterior probabilities are indicated above each branch and numbers in red circles show the placement of calibration points used in the divergence time analyses.
Figure S2. Maximum clade credibility tree from the time‐calibrated Beast phylogenetic analysis. Posterior probabilities are indicated above each branch.
Figure S3. Maximum clade credibility tree from the time‐calibrated Beast analysis. Error bars indicate the 95% Highest Posterior Density interval for the estimated age of each node. Numbers above each error bar indicate the mean of the estimated age.
Table S1. List of taxa reported to sonicate flowers.
Table S2. GenBank numbers of sequences used for the phylogeny that were not from Cardinal and Danforth (2013).
Table S3. Prior probabilities of the minimum, maximum and mean age set for each calibration point along with the fossilized species and age of the fossil that the calibration point is based on.
Table S4. Sampling probabilities assigned to each clade to account for non‐random incomplete taxon sampling in the diversification rates analysis done using BAMM.
Supplementary information
AUTHOR CONTRIBUTIONS
SC and SLB initially conceived the study and ALR subsequently significantly contributed to the design of the study. SLB and ALR collected data on floral sonicating bees. SC collected data for phylogenetic analyses. SC conducted all analyses and created the figures. All authors contributed to the writing of this paper.
ACKNOWLEDGMENTS
We thank J. Cane, T. Houston, B. Danforth, J. Ascher, J. Neff, D. Martins, Z. Portman, P. Kwapong, and D. Roubik for checking our master list of sonicating bees and providing field observations of sonicating bee genera not already published. This work was partially supported by the University of Arizona Graduate and Professional Student Council and the National Science Foundation (IOS‐1257762 to A.S. Leonard, S.L. Buchmann, and D.R. Papaj).
DATA ARCHIVING
Data available from the Dryad Digital Repository: https://doi.org/10.5061/dryad.g8609
LITERATURE CITED
- Alcock, J. , and Buchmann S. L.. 1985. The significance of post‐insemination display by male Centris pallida (Hymenoptera: Anthophoridae). Z Tierpsychol. 68:231–243. [Google Scholar]
- Anderson, B. , and Johnson S. D.. 2007. The geographical mosaic of coevolution in a plant‐pollinator mutualism. Evolution 62:220–225. [DOI] [PubMed] [Google Scholar]
- Ascher, J. S. , and Pickering J.. 2016. Discover life bee species guide and world checklist (Hymenoptera: Apoidea: Anthophila). Published on the internet. http://www.discoverlife.org.
- Barraclough, T. G. , and Nee S.. 2001. Phylogenetics and speciation. Trends Ecol. Evol. 16:391–399. [DOI] [PubMed] [Google Scholar]
- Berger, B. A. , Kriebel R., Spalink D., and Sytsma K. J.. 2016. Divergence times, historical biogeography, and shifts in speciation rates of Myrtales. Mol. Phylogenet. Evol. 95:116–136. [DOI] [PubMed] [Google Scholar]
- Bollback, J. P . 2006. SIMMAP: Stochastic character mapping of discrete traits on phylogenies. BMC Bioinformatics 7:88. [DOI] [PMC free article] [PubMed] [Google Scholar]
- Branstetter, M. G. , Danforth B. N., Pitts J. P., Faircloth B. C., Ward P. S., Buffington M. L., Gates M. W., Kula R. R., and Brady S. G.. 2017. Phylogenomics and improved taxon sampling resolve relationships among ants, bees, and stinging wasps. Curr. Biol. 27:1019–1024. [DOI] [PubMed] [Google Scholar]
- Buchmann, S. L. 1983. Buzz pollination in angiosperms Pp. 73–113 in Little R. J. and Jones C. E., eds. Handbook of experiment pollination biology. vanNostrand Reinhold Company, Inc, New York. [Google Scholar]
- Buchmann, S. L. 1985. Bees use vibration to aid pollen collection from non‐poricidal flowers. J. Kans. Entomol. Soc. 58:517–525. [Google Scholar]
- Camillo, E. , and Garofalo, C. A. 1989. Analysis of the niche of two sympatric species of Bombus (Hymenoptera, Apidae) in Southeastern Brazil. J. Trop. Ecol. 5:81–92. [Google Scholar]
- Cane, J. H. , and Tepedino, V. J. 2016. Gauging the effect of honey bee pollen collection on native bee communities. Conserv. Lett. 10:205–210. [Google Scholar]
- Cardinal, S. , and Danforth B. N.. 2013. Bees diversified in the age of eudicots. Proc. R Soc. B 280:20122686. [DOI] [PMC free article] [PubMed] [Google Scholar]
- Castellanos, M. C. , Wilson P., Keller S. J., Wolfe A. D., and Thomson J. D.. 2006. Anther evolution: pollen presentation strategies when pollinators differ. Am. Nat. 167:288–296. [DOI] [PubMed] [Google Scholar]
- Cook, J. M. , Beam D., Power S. A., and Dixon D. J.. 2004. Evolution of a complex coevolved trait: active pollination in a genus of fig wasps. J. Evol. Biol. 17:238–246. [DOI] [PubMed] [Google Scholar]
- Corbet, S. A. , and Huang S. Q.. 2014. Buzz pollination in eight bumblebee‐pollinated Pedicularis species: does it involve vibration‐induced triboelectric charging of pollen grains? Ann. Bot. 114:1665–1674. [DOI] [PMC free article] [PubMed] [Google Scholar]
- Danforth, B. N. , and Poinar G. O.. 2011. Morphology, classification, and antiquity of Melittosphex burmensis (Apoidea: Melittosphecidae) and implications for early bee evolution. J. Paleo. 85:882–891. [Google Scholar]
- Darriba, D. , Taboada G. L., Doallo R., and Posada D.. 2012. jModelTest 2: more models, new heuristics and parallel computing. Nat. Methods 9:772. [DOI] [PMC free article] [PubMed] [Google Scholar]
- De Luca, P. A. , Cox D. A., and Vallejo‐Marín M.. 2014. Comparison of pollination and defensive buzzes in bumblebees indicates species‐specific and context‐dependent vibrations. Naturwissenschaften 101:331–338. [DOI] [PubMed] [Google Scholar]
- De Luca, P. A. , and Vallejo‐Marín M.. 2013. What's the ‘buzz’ about? The ecology and evolutionary significance of buzz‐pollination. Curr. Opin. Plant Biol. 16:1–7. [DOI] [PubMed] [Google Scholar]
- De‐Silva, D. L. , Mota L. L., Chazot N., Mallarino R., Silva‐Brandão K. L., Piñerez L. M. G., Freitas A. V. L., Lamas G., Joron M., Mallet J., et al. 2017. North Andean origin and diversification of the largest ithomiine butterfly genus. Sci. Rep. 7:45966. [DOI] [PMC free article] [PubMed] [Google Scholar]
- Drummond, A. J. , Ho S. Y. W., Phillips M. J., and Rambaut A.. 2006. Relaxed phylogenetics and dating with confidence. PLoS Biol. 4:e88. [DOI] [PMC free article] [PubMed] [Google Scholar]
- Drummond, A. J. , Suchard M. A., Xie D., and Rambaut A.. 2012. Bayesian phylogenetics with BEAUti and the BEAST 1.7. Mol. Biol. Evol. 29:1969–1973. [DOI] [PMC free article] [PubMed] [Google Scholar]
- Duckworth, R. A. 2008. The role of behavior in evolution: a search for mechanism. Evol. Ecol. 23:513–531. [Google Scholar]
- Dyer, F. C. 2002. The biology of the dance language. Ann. Rev. Entomol. 47:917–949. [DOI] [PubMed] [Google Scholar]
- Evans, H. E. 1959. Observations on the nesting behavior of digger wasps of the genus Ammophila . Am. Mid. Nat. 62:449–473. [Google Scholar]
- Farrell, B. D. , Dussourd D. E., and Mitter C.. 1991. Escalation of plant defence: do latex and resin canals spur plant diversification? Am. Nat. 138:881–900. [Google Scholar]
- FitzJohn, R. G. 2012. Diversitree: comparative phylogenetic analyses of diversification in R . Methods Ecol. Evol. 3:1084–1092. [Google Scholar]
- Forest, F. , Chase M. W., Persson C., Crane P. R., and Hawkins J. A.. 2007. The role of biotic and abiotic factors in evolution of ant dispersal in the milkwort family (Polygalaceae). Evolution 61:1675–1694. [DOI] [PubMed] [Google Scholar]
- Gao, J. Y. , Ren P. Y., Yang Z. H., and Li Q. J.. 2006. The pollination ecology of Paraboea rufescens (Gesneriaceae): a buzz‐pollinated tropical herb with mirror‐image flowers. Ann. Bot. 97:371–376. [DOI] [PMC free article] [PubMed] [Google Scholar]
- Gernhard, T. 2008. The conditioned reconstructed process. J. Theor. Biol. 253:769–778. [DOI] [PubMed] [Google Scholar]
- Gillespie, J. J. , Johnston J. S., Cannone J. J., and Gutell R. R.. 2006. Characteristics of the nuclear (18S, 5.8S, 28S, and 5S) and mitochondrial (12S and 16S) rRNA genes of Apis mellifera (Insecta: Hymenoptera): structure, organization, and retrotransposable elements. Insect Mol. Biol. 15:657–686. [DOI] [PMC free article] [PubMed] [Google Scholar]
- Grimaldi, D. , and Engel M. S.. 2005. Evolution of the insects. Cambridge Univ. Press, New York, NY. [Google Scholar]
- Harder, L. D. , and Barclay R. M. R.. 1994. The functional significance of poricidal anthers and buzz pollination: controlled pollen removal from Dodecatheon . Funct. Ecol. 8:509–517. [Google Scholar]
- Harder, L. D. , Williams N. M., Crispin Y. J. and Nelson W. A.. 2001. The effects of floral design and display on pollinator economics and pollen dispersal Pp. 297–318 in Chittka L. and Thomson J. D., eds. Cognitive ecology of pollination: animal behavior and floral evolution. Cambridge Univ. Press, Cambridge, U. K. [Google Scholar]
- Hargreaves, A. , Harder L. D., and Johnson S. D.. 2009. Consumptive emasculation: the ecological and evolutionary consequences of pollen theft. Biol. Rev. 84:259–276. [DOI] [PubMed] [Google Scholar]
- Hedtke, S. , Patiny S., and Danforth B. N.. 2013. The bee tree of life: a supermatrix approach to apoid phylogeny and biogeography. BMC Evol. Biol. 13:138. [DOI] [PMC free article] [PubMed] [Google Scholar]
- Hilgert‐Moreira, S. , Nascher C., Callegari‐Jacques S., and Blochtein B.. 2013. Pollen re‐sources and trophic niche breadth of Apis mellifera and Melipona obscurior (Hymenoptera, Apidae) in a subtropical climate in the Atlantic rain forest of southern Brazil. Apidologie 45:129–141. [Google Scholar]
- Hrncir, M. , Schmidt V. M., Schorkopf D. L. P., Zucchi S. J. R., and Barth F. G.. 2006. Vibrating the food receivers: a direct way of signal transmission in stingless bees (Melipona seminigra). J. Comp. Physiol. A 192:879–887. [DOI] [PubMed] [Google Scholar]
- Hrncir, M. , Maia‐Silva C., McCabe C. S. I., and Farina W. M.. 2011. The recruiter's excitement–features of thoracic vibrations during the honey bee's waggle dance related to food source profitability. J. Exp. Biol. 214:4055–4064. [DOI] [PubMed] [Google Scholar]
- Huelsenbeck, J. P. , Nielsen R., and Bollback J. P.. 2003. Stochastic mapping of morphological characters. Syst. Biol. 52:131–158. [DOI] [PubMed] [Google Scholar]
- Johnson, M. T. J. , FitzJohn R. G., Smith S. D., Rausher M. D., and Otto S. P.. 2011. Loss of sexual recombination and segregation is associated with increased diversification in evening primroses. Evolution 65:3230–3240. [DOI] [PMC free article] [PubMed] [Google Scholar]
- Kearse, M. , Moir R., Wilson A., Stones‐Havas S., Cheung M., Sturrock S., Buxton S., Cooper A., Markowitz S., Duran C., et al. 2012. Geneious basic: an integrated and extendable desktop software platform for the organization and analysis of sequence data. Bioinformatics 28:1647–1649. [DOI] [PMC free article] [PubMed] [Google Scholar]
- Kevan, P. G. , and Baker H. G.. 1983. Insects as flower visitors and pollinators. Ann. Rev. Entomol. 28:407–453. [Google Scholar]
- King, M. J. 1993. Buzz foraging mechanism of bumble bees. J. Apic Res. 32:41–49. [Google Scholar]
- King, M. J. , and Buchmann S. L.. 2003. Floral sonication by bees: mesosomal vibration by Bombus and Xylocopa, but not Apis (Hymenoptera: Apidae), ejects pollen from poricidal anthers. J. Kans. Entomol. Soc. 76:295–305. [Google Scholar]
- Kirchner, W. H. , and Röschard J.. 1999. Hissing in bumblebees: an interspecific defence signal. Insectes Soc. 46:239–243. [Google Scholar]
- Lanave, C. , Preparata G., Saccone C., and Serio G.. 1984. A new method for calculating evolutionary substitution rates. J. Mol. Evol. 20:86–93. [DOI] [PubMed] [Google Scholar]
- Lapiedra, O. , Sol D., Carranza S., and Beaulieu J.. 2013. Behavioural changes and the adaptive diversification of pigeons and doves. Proc. R Soc. B 280:20122893. [DOI] [PMC free article] [PubMed] [Google Scholar]
- Larsen, O. N. , Gleffe G., and Tengö J.. 1986. Vibration and sound communication in solitary bees and wasps. Physiol. Entomol. 11:287–296. [Google Scholar]
- Laverty, T. M. 1980. The flower‐visiting behaviour of bumble bees: floral complexity and learning. Can. J. Zool. 58:1324–1335. [Google Scholar]
- Laverty, T. M. , and Plowright R. C.. 1988. Flower handling by bumblebees: a comparison of specialists and generalists. Anim. Behav. 36:733–740. [Google Scholar]
- Lewis, A. C. 1993. Learning and the evolution of resources: pollinators and flower morphology Pp. 398 in Papaj D. R. and Lewis A. C., eds. Insect Learning. Routledge, Chapman & Hall, Inc, London. [Google Scholar]
- Machac, A. 2014. Detecting trait‐dependent diversification under diversification slowdowns. Evol. Biol. 41:201–211. [Google Scholar]
- Macior, L. W. 1964. An experimental study of the floral ecology of Dodecatheon meadia . Am. J. Bot. 51:96–108. [Google Scholar]
- Macior, L. W. 1968. Pollination adaptation in Pedicularis groenlandica . Am. J. Bot. 55:927–932. [Google Scholar]
- Maddison, W. P. 2006. Confounding asymmetries in evolutionary diversification and character change. Evolution 60:1743–1746. [PubMed] [Google Scholar]
- Maddison, W. P. , Midford P. E., and Otto S. P.. 2007. Estimating a binary character's effect on speciation and extinction. Syst. Biol. 56:701–710. [DOI] [PubMed] [Google Scholar]
- Michener, C. D. 1962. An interesting method of pollen collecting by bees from flowers with tubular anthers. Rev. Biol. Trop. 10:167–175. [Google Scholar]
- Michez, D. , Vanderplanck M., and Engel M. S.. 2012. Fossil bees and their plant associates Pp. 103–164 in Patiny S., ed. Evolution of plant‐pollinator relationships. Cambridge Univ. Press, Cambridge. [Google Scholar]
- Mitter, C. , Farrell B., and Wiegmann B.. 1988. The phylogenetic study of adaptive zones—has phytophagy promoted insect diversification? Am. Nat. 132:107–128. [Google Scholar]
- Moore, B. R. , Höhna S., May M. R., Rannala B., and Huelsenbeck J. P.. 2016. Critically evaluating the theory and performance of Bayesian analysis of microevolutionary mixtures. Proc. Natl. Acad. Sci. USA 113:9569–9574. [DOI] [PMC free article] [PubMed] [Google Scholar]
- Nicolson, S. W. , and van Wyk J. H.. 2011. Bee food: the chemistry and nutritional value of nectar, pollen and mistures of the two. Afr. Zool. 46:197–204. [Google Scholar]
- Nieh, J. C. 1998. The honey bee shaking signal: function and design of a modulatory communication signal. Behav. Ecol. Sociobiol. 42:23–26. [Google Scholar]
- Papaj, D. R. , Buchmann S. L., and Russell A. L.. 2017. Division of labor of anthers in heterantherous plants: flexibility of bee pollen collection behavior may serve to keep plants honest. Arthropod Plant Interact 11:307–315. [Google Scholar]
- Paradis, E. , Claude J., and Strimmer K.. 2004. APE: analyses of phylogenetics and evolution in R language. Bioinformatics 20:289–290. [DOI] [PubMed] [Google Scholar]
- Pellmyr, O. , and Thompson J. N.. 1992. Multiple occurences of mutualism in the yucca moth lineage. Proc. Natl. Acad. Sci. USA 89:2927–2929. [DOI] [PMC free article] [PubMed] [Google Scholar]
- Peters, R. S. , Krogmann L., Mayer C., Donath A., Gunkel S., Meusemann K., Kozlov A., Podsiadlowski L., Petersen M., Lanfear R., et al. 2017. Evolutionary history of Hymenoptera. Curr. Biol. 27:1013–1018. [DOI] [PubMed] [Google Scholar]
- Price, S. A. , Hopkins S. S. B., Smith K. K., and Roth V. L.. 2012. Tempo of trophic evolution and its impact on mammalian diversification. Proc. Natl. Acad. Sci. USA 109:7008–7012. [DOI] [PMC free article] [PubMed] [Google Scholar]
- Rabosky, D. L. 2014. Automatic detection of key innovations, rate shifts, and diversity‐dependence on phylogenetic trees. PLos ONE 9:e89543. [DOI] [PMC free article] [PubMed] [Google Scholar]
- Rabosky, D. L. , and Goldberg E. E.. 2015. Model inadequacy and mistaken inferences of trait‐dependent speciation. Syst. Biol. 64:340–355. [DOI] [PubMed] [Google Scholar]
- Rabosky, D. L. , Grundler M., Anderson C., Title P., Shi J. J., Brown J. W., Huang H., and Larson J. G.. 2014. BAMMtools: an R package for the analysis of evolutionary dynamics on phylogenetic trees. Methods Ecol. Evol. 5:701–707. [Google Scholar]
- Rabosky, D. L. , and Huang H.. 2015. A robust semi‐parametric test for detecting trait‐dependent diversification. Syst. Biol. 65:181–193. [DOI] [PubMed] [Google Scholar]
- Rabosky, D. L. , Mitchell J. S., and Chang J.. 2017. Is BAMM flawed? Theoretical and practical concerns in the analysis of multi‐rate diversification models. Syst. Biol. 66:477–498. [DOI] [PMC free article] [PubMed] [Google Scholar]
- Ramalho, M. , Kleinert‐Giovannini A., and Imperatriz‐Fonseca V. L.. 1990. Important bee plants for stingless bees (Melipona and Trigonini) and Africanized honeybees (Apis mellifera) in neotropical habitats: a review. Apidologie 21:469–488. [Google Scholar]
- Rambaut, A. , Suchard M. A., Xie D., and Drummond A. J.. 2014. Tracer v1.6. Available at http://beast.bio.ed.ac.uk/Tracer.
- Ronquist, F. , Teslenko M., van der Mark P., Ayres D. L., Darling A., Hohna S., Larget B., Liu L., Suchard M. A., and Huelsenbeck J. P.. 2012. MrBayes 3.2: efficient Bayesian phylogenetic inference and model choice across a large model space. Syst. Biol. 61:539–542. [DOI] [PMC free article] [PubMed] [Google Scholar]
- Russell, A. L. , Leonard A. S., Gillette H. D., and Papaj D. R.. 2016. Concealed floral rewards and the role of experience in floral sonication by bees. Anim. Behav. 120:83–91. [Google Scholar]
- Russell, A. L. , Buchmann S. L., and Papaj D. R.. 2017. How a generalist bee achieves high efficiency of pollen collection on diverse floral resources. Behav. Ecol. 28:991–1003. [Google Scholar]
- Sargent, R. D. 2004. Floral symmetry affects speciation rates in angiosperms. Proc. R Soc. Lond. B 271:603–608. [DOI] [PMC free article] [PubMed] [Google Scholar]
- Serra, B. D. V. , da Luz C. F. P., and Campos L. A. O.. 2012. The use of polliniferous resources by Melipona capixaba, an endangered stingless bee species. J. Insect Sci. 12:148. [DOI] [PMC free article] [PubMed] [Google Scholar]
- Solís‐Montero, L. , Vergara C. H., and Vallejo‐Marín M.. 2015. High incidence of pollen theft in natural populations of a buzz‐pollinated plant. Arthropod Plant Interact 9:599–611. [Google Scholar]
- Switzer, C. M. , Hogendoorn K., Ravi S., and Combes S. A.. 2016. Shakers and head bangers: differences in sonication behavior between Australian Amegilla murrayensis (blue‐banded bees) and North American Bombus impatiens (bumblebees). Arthropod Plant Interact 10:1–8. [Google Scholar]
- Tebbich, S. , Sterelny K., and Teschke I.. 2010. The tale of the finch: adaptive radiation and behavioural flexibility. Phil. Trans. R Soc. B 365:1099–1109. [DOI] [PMC free article] [PubMed] [Google Scholar]
- The Plant List . 2013. Version 1.1 Published on the internet; http://www.theplantlist.org.
- Thompson, J. N. , Schwind C., Guimarães P. R. J., and Friberg M.. 2013. Diversification through multitrait evolution in a coevolving interaction. Proc. Natl. Acad. Sci. USA 110:11487–11492. [DOI] [PMC free article] [PubMed] [Google Scholar]
- Thorp, R. W. 2000. The collection of pollen by bees. Plant Syst. Evol. 222:211–223. [Google Scholar]
- Towne, W. F. 1985. Acoustic and visual cues in the dances of four honey bee species. Behav. Eco Sociobiol. 16:185–187. [Google Scholar]
- Vallejo‐Marín, M. , Da S. E. M., Sargent R. D., and Barrett S. C. H.. 2010. Trait correlates and functional significance of heteranthery in flowering plants. New Phytol. 188:418–425. [DOI] [PubMed] [Google Scholar]
- van der Niet, T. , and Johnson S. D.. 2012. Phylogenetic evidence for pollinator‐driven diversification of angiosperms. Trends Ecol. Evol. 27:353–361. [DOI] [PubMed] [Google Scholar]
- Villaneuva‐Gutierrez, R. , Quezeda‐Euan J., and Eltz T.. 2013. Pollen diets of two sibling orchid bee species, Euglossa, in Yucatán, southern Mexico. Apidologie 44:440. [Google Scholar]
- Westerkamp, C . 2004. Ricochet pollination in cassias ‐ and how bees explain enantiostyly: preliminary communication Pp. 225–230 in Freitas B. M., Pereira J. O. P., eds. Solitary bees: conservation, rearing and management for pollination. Imprensa Universitária, Fortaleza. [Google Scholar]
- Westerkamp, C. 1999. Keel flowers of the Polygalaceae and Fabaceae: a functional comparison. Bot. J. Linn. Soc. 129:207–221. [Google Scholar]
- Wille, A. 1963. Behavioral adaptations of bees for pollen collecting from Cassia flowers. Rev. Biol. Trop. 11:205–210. [Google Scholar]
- Wolfe, A. D. , and Estes J. R.. 1992. Pollination and the function of floral parts in Chamaecrista fasciculata (Fabaceae). Am. J. Bot. 79:314–317. [Google Scholar]
- Zharkikh, A. 1994. Estimation of evolutionary distances between nucleotide sequences. J. Mol. Evol. 39:315–329. [DOI] [PubMed] [Google Scholar]
Associated Data
This section collects any data citations, data availability statements, or supplementary materials included in this article.
Supplementary Materials
Figure S1. Maximum clade credibility tree from the MrBayes phylogenetic analysis. Posterior probabilities are indicated above each branch and numbers in red circles show the placement of calibration points used in the divergence time analyses.
Figure S2. Maximum clade credibility tree from the time‐calibrated Beast phylogenetic analysis. Posterior probabilities are indicated above each branch.
Figure S3. Maximum clade credibility tree from the time‐calibrated Beast analysis. Error bars indicate the 95% Highest Posterior Density interval for the estimated age of each node. Numbers above each error bar indicate the mean of the estimated age.
Table S1. List of taxa reported to sonicate flowers.
Table S2. GenBank numbers of sequences used for the phylogeny that were not from Cardinal and Danforth (2013).
Table S3. Prior probabilities of the minimum, maximum and mean age set for each calibration point along with the fossilized species and age of the fossil that the calibration point is based on.
Table S4. Sampling probabilities assigned to each clade to account for non‐random incomplete taxon sampling in the diversification rates analysis done using BAMM.
Supplementary information