Abstract
A computer-aided differential diagnosis (CADD) system that distinguishes between usual interstitial pneumonia (UIP) and non-specific interstitial pneumonia (NSIP) using high-resolution computed tomography (HRCT) images was developed, and its results compared against the decision of a radiologist. Six local interstitial lung disease patterns in the images were determined, and 900 typical regions of interest were marked by an experienced radiologist. A support vector machine classifier was used to train and label the regions of interest of the lung parenchyma based on the texture and shape characteristics. Based on the regional classifications of the entire lung using HRCT, the distributions and extents of the six regional patterns were characterized through their CADD features. The disease division index of every area fraction combination and the asymmetric index between the left and right lungs were also evaluated. A second SVM classifier was employed to classify the UIP and NSIP, and features were selected through sequential-forward floating feature selection. For the evaluation, 54 HRCT images of UIP (n = 26) and NSIP (n = 28) patients clinically diagnosed by a pulmonologist were included and evaluated. The classification accuracy was measured based on a fivefold cross-validation with 20 repetitions using random shuffling. For comparison, thoracic radiologists assessed each case using HRCT images without clinical information or diagnosis. The accuracies of the radiologists’ decisions were 75 and 87%. The accuracies of the CADD system using different features ranged from 70 to 81%. Finally, the accuracy of the proposed CADD system after sequential-forward feature selection was 91%.
Keywords: Computer-aided differential diagnosis, Usual interstitial pneumonia, Non-specific interstitial pneumonia, Regional lung disease patterns, SVM classifier
Introduction
Diffuse interstitial lung disease (DILD) is a type of chronic disorder that infiltrates the lung parenchyma (functional tissue) and leads to respiratory problems if the cause is not removed or if therapy fails. Idiopathic interstitial pneumonia (IIP) is a type of DILD that consists of seven clinical-radiologic-pathologic entities, including usual interstitial pneumonia (UIP) and non-specific interstitial pneumonia (NSIP). Specifically, UIP and NSIP account for two-thirds of IIP cases and show different prognoses with a five-year survival rate [1]. Differentiating between UIP and NSIP is clinically important in terms of their different therapies and prognoses [2].
Because of the rapid development of computer tomography (CT), high-resolution computed tomography (HRCT) has become an important tool for characterizing various types of lung parenchyma disorders, particularly DILD [3, 4]. The texture and shape characteristics of the local lung parenchyma of DILD patients have potential importance for understanding the various lung diseases that correlate with disease pathology [5–7]. Several lung disease quantification methods employing textural and shape features have been verified for accurate regional disease differentiation and a reproducible assessment [8–11].
In this paper, we present a computer-aided differential diagnosis system for distinguishing between usual interstitial pneumonia (UIP) and non-specific interstitial pneumonia (NSIP) by employing HRCT lung quantification methods. The proposed system consists of two classification steps. First, the DILD regional disease–pattern classifier quantifies the lung parenchyma into one normal and five regional pulmonary disease patterns (ground-glass opacity, consolidation, reticular opacity, emphysema, and honeycombing) using textural and shape features extracted from HRCT images. Subsequently, the computer-aided differential diagnosis (CADD) classifier differentiates the HRCT images into UIP and NSIP, based on their quantified lung characteristics.
Materials and Methods
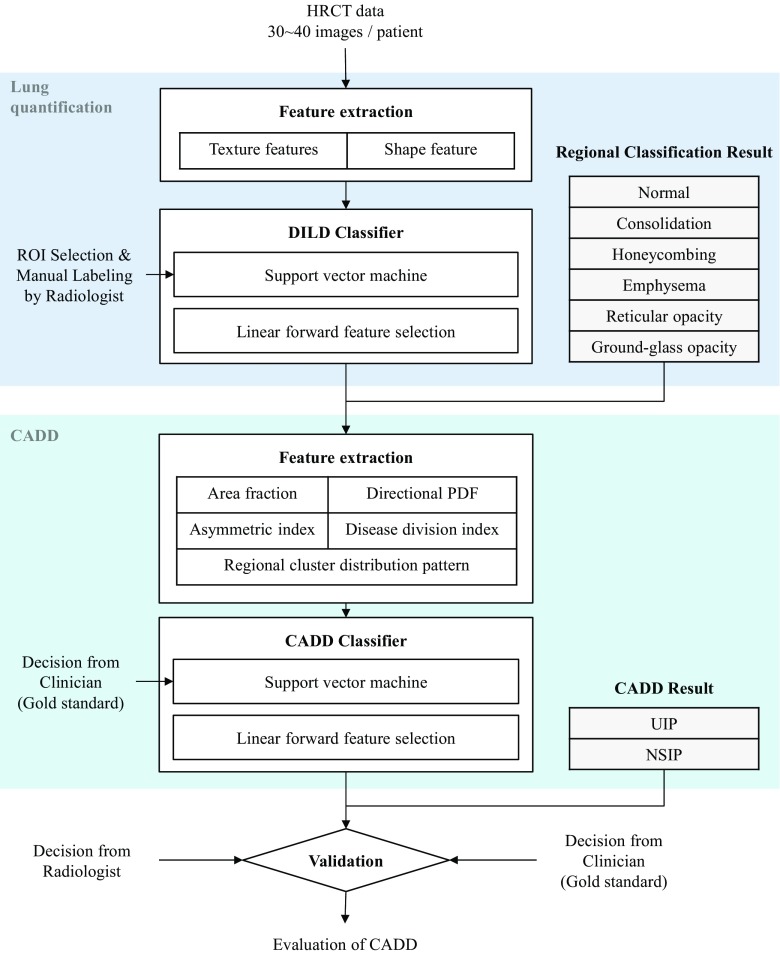
Figure 1 illustrates the overall procedure of the proposed scheme. Two different classifiers are concatenated for a step-by-step analysis of the HRCT image. First, for lung quantification, textural and shape features are extracted from the HRCT images. A support vector machine (SVM), trained using DILD regional disease patterns manually labeled by radiologists, categorizes the entire lung parenchyma into six classes. Subsequently, CADD features characterizing the distribution of a regional disease pattern are extracted. Another SVM classifier is applied to differentiate the lung images between UIP and NSIP using the CADD features. In the following section, we describe the details of our materials and methods used.
Fig. 1.
Overall scheme of the proposed CADD system and evaluation
Subjects
The Asan Medical Center’s institutional review board for human investigations approved the study protocol, removed all patient identifiers, and waived the informed-consent requirements owing to the retrospective nature of this study.
For the lung quantification, HRCT images were selected retrospectively from images obtained from 14 healthy subjects, 16 patients with emphysema, 35 patients with cryptogenic-organizing pneumonia, 36 patients with usual interstitial pneumonia, 4 patients with pneumonia, and 1 patient with acute interstitial pneumonia. (See “Lung quantification”).
For modeling the CADD classifier, images from 26 different patients with UIP and 28 patients with NSIP, diagnosed both clinically and pathologically, were selected as the dataset. This decision, based on a combination of clinico-radiologico-pathological discussions and consensus, has been regarded as the gold standard according to the latest official statement by ATS/ERS/JRS/ALAT, i.e., Idiopathic Pulmonary Fibrosis: Evidence-based Guidelines for Diagnosis and Management [12].
The entire chest was covered within the scanned field of view. A 10-mm interval was used, and 30 to 40 slices were acquired per patient. For the image reconstruction, a 16-multidetector CT (Sensation 16, Siemens, Erlangen, Germany) with a 1-mm slice thickness and an edge-enhancing reconstruction kernel (B70f) was used.
Lung Quantification
In this study, we employed our previous work on regional DILD disease-pattern classification for lung quantification [13]. We used the same dataset and classifiers with similar parameters.
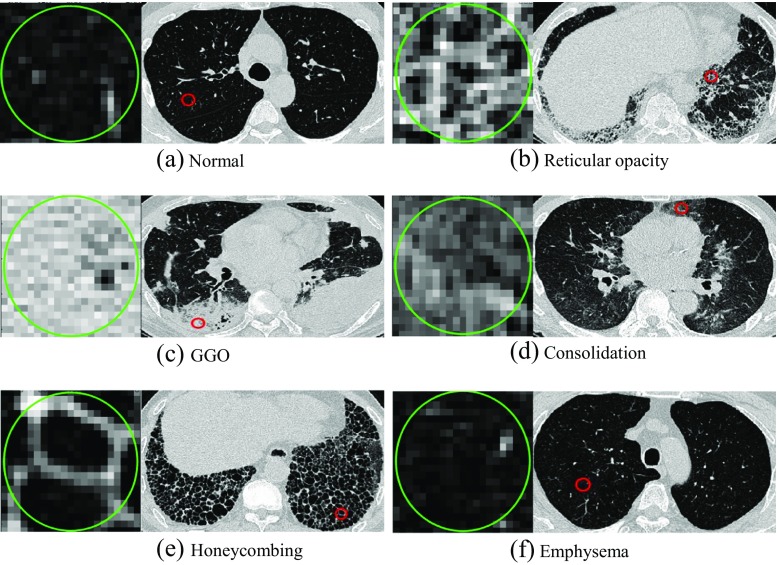
In this study, six classes were defined, including normal, ground-glass opacity, consolidation, reticular opacity, emphysema, and honeycombing, as illustrated in Fig. 2. The ground-glass opacity shows an abnormally hazy focus in the lungs, and is not associated with the obscured underlying vessels. Consolidation is similar to the ground-glass opacity, but is associated with the obscured underlying vessels. Reticular lung opacity is contracted by a thickened interstitial fiber network of the lung, resulting from fluid, fibrous tissue, or cellular infiltration. The focal area of emphysema shows very low attenuation in contrast to the surrounding area, whereas the normal parenchyma shows higher attenuation. Emphysema can be typically distinguished from honeycombing based on its areas of emphysematous destruction, which lack a visible wall, whereas honeycomb cysts have thick walls of fibrous tissue. In a honeycombing area, extensive fibrosis with lung destruction is found, which results in a cystic, reticular appearance.
Fig. 2.
Examples of one normal and five regional lung disease patterns
A thoracic radiologist with 10 years of experience marked 900 typical regions of interest (ROI), including normal (NL, n = 150), ground-glass opacity (GGO, n = 150), reticular opacity (RO, n = 150), honeycombing (HC, n = 150), emphysema (EMPH, n = 150), and consolidation (CONS, n = 150), using a circular mask with a 20-pixel diameter. To prevent a clustering effect, only one ROI was selected in each image. To characterize the six types of regional DILD disease patterns, we extracted 28 textural and shape features from the ROI of an HRCT image [9, 14], e.g., histogram, gradient, run-length matrix, co-occurrence matrix, cluster analysis, and top-hat transform. An SVM was employed to quantify the lung parenchyma into six classes. We applied sequential-forward feature selection, and the SVM was trained using the 900-ROI dataset with a radial basis function (RBF) kernel and optimized parameters.
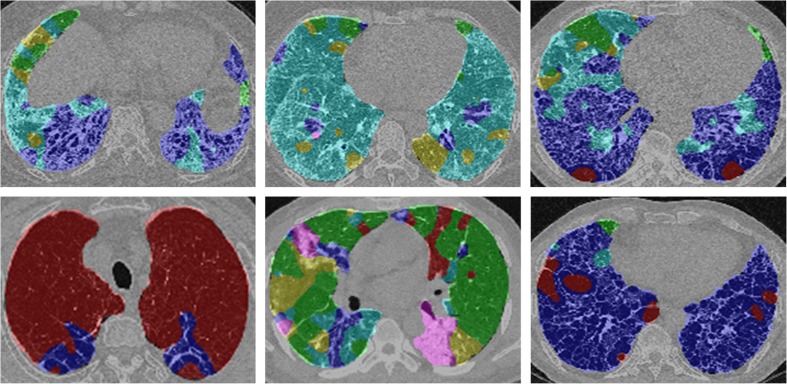
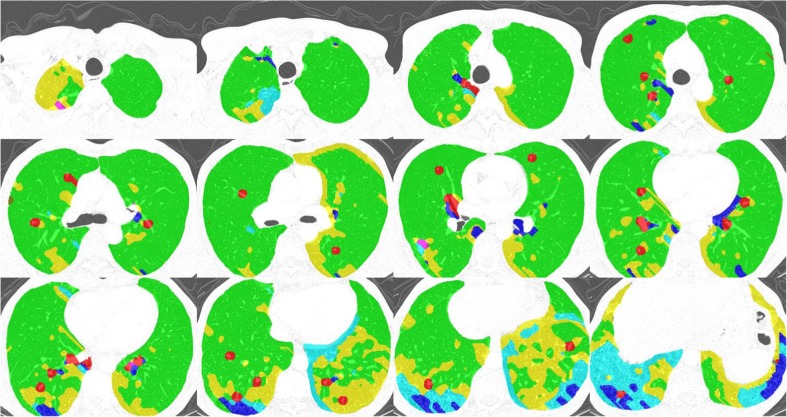
After manual segmentation of the lung parenchyma, a moving ROI function that travels and captures ROIs from the lung parenchyma was applied. For each ROI, the SVM predicted one of the six classes. As a result, the six regional disease patterns were labeled pixel-by-pixel on the entire lung parenchyma. Figure 3 shows examples of the lung quantification results using the SVM classifier trained through the aforementioned processes.
Fig. 3.
Examples of DILD quantification. For every pixel, the semi-transparent color was coded based on the classification result (normal, green; ground-glass opacity, yellow; reticular opacity, cyan; honeycombing, blue; emphysema, red)
Computer-Aided Differential Diagnosis
After the lung quantification, the entire lung area is represented as an area composed of six regional disease patterns. The distribution of the six classes provides important evidence for differentiating UIP and NSIP [15, 16]. We defined CADD features for quantifying the distribution characteristics after consulting with experienced radiologists: area fraction (AF), directional probability density function (dPDF), regional cluster distribution pattern (RCDP), disease division index (DDI), and asymmetric index (AI).
The AF is defined by counting the voxels of each regional disease pattern from the entire lung, and is useful for representing how the entire lung volume is composed, and which regional disease is dominant.
where V is the voxel count, and i is the regional disease pattern.
In radiology, when differentiating UIP and NSIP, it is important to note which regional disease is dominant in which area of the lung [17, 18]. The dPDF represents the distribution patterns of each regional disease pattern throughout the entire lung. We measure the dPDFs in three directions: anterior-posterior (AP), upper-lower (UL), and central-peripheral (CP). The scales of the three direction ranges are normalized from zero to 1. For each regional disease pattern, the mean, standard deviation, and skewness are calculated in three directions, as in the following equation.
where i is the regional disease pattern, and d is the direction, i.e., AP, UL, or CP.
After the lung quantification, each regional disease pattern in the entire lung appears to be an isolated mass. We consider these as connected component voxel clusters and measure the characteristics of the cluster distribution. Regional cluster distribution patterns calculate the number of clusters (RCDP), cluster area (RCDP_AR), and cluster centroid (RCDP_CR):
where i is the regional disease pattern, and T is the connected component cluster set. For each regional disease pattern, the mean and standard deviation of the RCDP_AR and RCDP_CR are calculated. Because the regional clustering can represent how the regional diseases are formed, it can distinguish between the diffused patterns and isolated mass by calculating the number of clusters, sizes, and centroids.
The disease division index (DVI) is calculated by dividing each regional disease pattern pair. Because we defined six regional disease patterns, 50 pairs of DVIs are calculated.
where i and j are regional disease patterns and should have different values. The DVI is also important for differentiating UIP and NSIP; the proportions of the regional disease pairs are a type of differentiation evidence in the field of radiology.
The symmetry between the left and right lungs is one of the important keys in radiological UIP/NSIP differentiation. The asymmetric index (AI) is defined by the measurements of the left and right lung asymmetry of the aforementioned dPDF and RCDP features. The AI of both dPDF and RCDP is calculated through the following equations.
An SVM classifier was again used to classify the UIP and NSIP using the CADD features. Before training the SVM, meaningful features were selected from a number of CADD features to maximize the classification accuracy and avoid the curse of dimensionality. Sequential-forward floating feature selection (SFFS) was employed for selecting the CADD features [19]. A grid search algorithm was applied to optimize the parameters, including the SVM cost and gamma, using the training data. Various cost and gamma pairs were attempted, and the one with the best classification performance was selected. The details of training and testing of the classifiers are described in the following section.
Results
To evaluate the proposed differential diagnosis system, an HRCT dataset of 54 patients, who were clinically and pathologically diagnosed with UIP (n = 26) and NSIP (n = 28), was used. In this study, we carried out two experiments, including a radiologic decision and a classification-based decision.
Radiologic Decision
Two thoracic radiologists were recruited, and asked to review the HRCT images to diagnose each case as either UIP or NSIP, based on a visual assessment without clinical information or diagnosis. During the review, the radiologists assessed each HRCT image and scored 21 entries: five disease-pattern quantifications (five entries, 20 scales from 0 to 100%), three-directional distributions of five disease patterns (15 entries, 20 scales from 0 to 100%), and a radiologic decision (one entry, five scales).
The entities were used as feature sets for the SVM classifier. Effective features were selected through sequential-forward selection, and the classifier parameter was optimized using the grid search algorithm. The trained classifier was evaluated using a five-fold cross-validation with 20 repetitions. The average accuracies of the radiologist decisions were 0.75 and 0.87, respectively.
Qualitative Analysis of Lung Quantification and CADD Features
To verify whether the lung quantification and CADD feature extraction can represent lung-regional disease patterns and characteristics for the differentiation, we compared the quantification results and extracted features with radiological knowledge. For each UIP and NSIP case, the lung quantification results were captured and their CADD features were extracted.
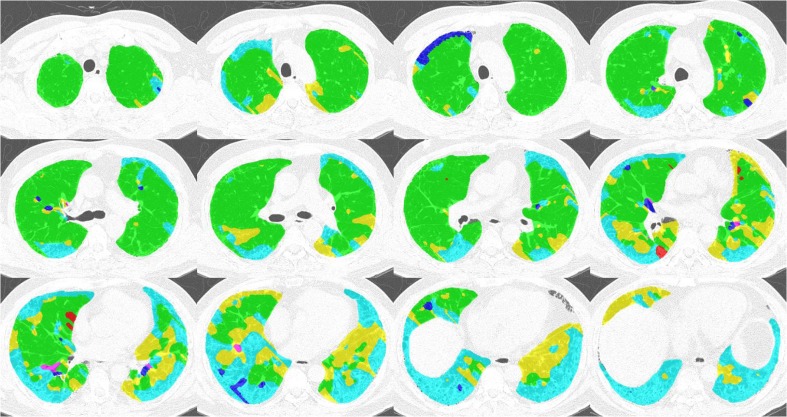
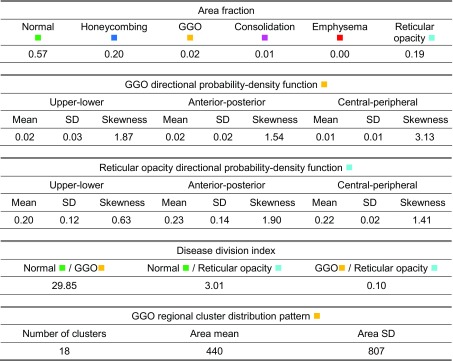
Figure 4 and Table 1 show an example of the lung quantification of a UIP case. The proposed CADD features are calculated based on the quantification. The area fraction and disease division index are used to represent the proportions of reticular opacity and honeycombing in the entire lung parenchyma, and are similar to radiological knowledge. The mean, standard deviation, and skewness of the three-directional probability density functions represent well where the regional disease is positioned and how the distribution is formed. Based on radiological knowledge of the UIP, the reticular opacity and honeycombing usually appear in the sub-pleural region of the lung.
Fig. 4.
Example of a UIP lung quantification
Table 1.
CADD features of a UIP case
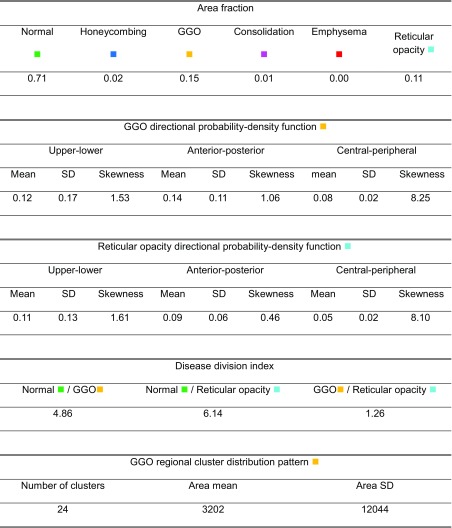
Figure 5 and Table 2 show an example of NSIP lung quantification. Based on radiological knowledge, the diffused patterns of the ground-glass opacity can appear dominantly in the overall lung parenchyma. Reticular opacity can be found in cases of fibrotic NSIP. The lung quantification result of the example case and its extracted CADD features represent the patterns well.
Fig. 5.
Example of NSIP lung quantification
Table 2.
CADD features of an NSIP case
CADD Decision
To observe the effectiveness of the proposed CADD features for differentiating between UIP and NSIP, the accuracy of a fivefold cross-validation with 20 repetitions was measured after training the classifier using each of the extracted CADD features. As shown in Fig. 6, the average accuracy of the classifier trained using AF, dPDF, AI of dPDF, RDP, AI of RDP, and DDI was 0.70, 0.79, 0.77, 0.80, 0.78, and 0.81, respectively.
Fig. 6.
Average accuracy of each classifier trained using CADD features
The SVM classifier using multiple features after sequential-feature forward selection was also evaluated through a fivefold cross-validation with 20 repetitions. The best average accuracy of the classifier was 0.91, and 16 features from the area fraction, AI of dPDF, and AI of RCDP were selected. Fig. 7 shows a comparison of the accuracy between the determination of the radiologists and the proposed CADD system.
Fig. 7.
Comparison of accuracy between radiologists and CADD system
Discussion
The present study aims to differentiate between usual interstitial pneumonia and non-specific interstitial pneumonia using HRCT images, excluding any clinical or pathological information. As shown in the “Results” section, the computer-aided differential diagnosis system can be compared with the visual assessment of experienced radiologists. To the best of our knowledge, this is the first development and validation trial of a CADD system for UIP and NSIP, including the semi-automatic quantification of regional disease patterns of DILD from HRCT images.
A total of 16 of the most accurate CADD features were selected. We found that the features were well fitted to the radiological knowledge for differentiating between UIP and NSIP. The decision procedures of the lung quantification and classifier, using different combinations of the proposed CADD features, were similar to the diagnosis-decision procedures of the radiologists, and showed a similar differentiation performance.
Our computer-aided differential diagnosis system for UIP and NSIP included two steps for quantifying the lung and classifying between UIP and NSIP. For the lung quantification, the trained SVM classifier classified the lung parenchyma into one normal and five regional disease patterns. If the performance of the SVM classifier can be improved using a well-controlled dataset, the trained classifier will consistently produce quality results. Moreover, we found that intra-reader variability exists in the visual assessment of the HRCT images in our previous study, which might have depended on the experience of the radiologist [20]. In this situation, a semi-automatic assessment method can be useful for supporting the decisions of the clinicians or as an initial screening when experts are unavailable.
There are several limitations to the present study. First, the study is dependent on two evidentiary categories, UIP and NSIP, among the various types of lung diseases because it is not easy to clearly differentiate between the different kinds of DILD and we want to prove the validity of the proposed method. However, we need to extend this study to differentiate among UIP, possible UIP, and images inconsistent with UIP or various other types of DILD, which could be a topic of further research. As another limitation, this is a retrospective study, using a dataset collected from patients with regional UIP and NSIP disease patterns. Finally, a lack of consensus among radiologists remains problematic for the type of supervised learning algorithm applied. Unsupervised learning could be a solution to the gold standard used, which is unclear even to expert radiologists.
Conclusion
In this study, we proposed a computer-aided differential diagnosis (CADD) system that differentiates between usual interstitial pneumonia (UIP) and non-specific interstitial pneumonia (NSIP) using high-resolution computed tomography (HRCT) images. Lung quantification was presented to automatically classify the voxels of the HRCT images into one normal and five regional disease patterns. Based on the lung quantification, the CADD features that characterize each regional disease pattern throughout the entire lung were extracted. Using these CADD features, a CADD classifier was able to predict the patient HRCT images as either UIP or NSIP cases.
To evaluate the proposed system, we compared its accuracy against the determinations of radiologists. The results of the comparison indicate that the proposed system can be a robust and quantitative tool supporting the decisions of clinicians and providing an initial screening for UIP and NSIP.
Acknowledgments
This work was supported by the Industrial Strategic technology development program (10072064) funded by the Ministry of Trade, Industry and Energy (MI, Korea).
Compliance with Ethical Standards
Conflict of Interest
Namkug Kim and Joon Beom Seo have conflicts of interest regarding royalties received for a patent on classifying regional diseased patterns of diffuse interstitial lung disease, and as stockholders of Coreline Soft, Inc. The other authors have no relevant conflicts of interest to disclose.
References
- 1.Travis WD, King TE, Bateman ED, Lynch DA, Capron F, Center D, Colby TV, Cordier JF, DuBois RM, Galvin J. American Thoracic Society/European Respiratory Society international multidisciplinary consensus classification of the idiopathic interstitial pneumonias. American journal of respiratory and critical care medicine. 2002;165(2):277–304. doi: 10.1164/ajrccm.165.2.ats01. [DOI] [PubMed] [Google Scholar]
- 2.du Bois R, King TE. Challenges in pulmonary fibrosis · 5: The NSIP/UIP debate. Thorax. 2007;62(11):1008–1012. doi: 10.1136/thx.2004.031039. [DOI] [PMC free article] [PubMed] [Google Scholar]
- 3.Grenier P, Valeyre D, Cluzel P, Brauner MW, Lenoir S, Chastang C. Chronic diffuse interstitial lung disease: diagnostic value of chest radiography and high-resolution CT. Radiology. 1991;179(1):123–132. doi: 10.1148/radiology.179.1.2006262. [DOI] [PubMed] [Google Scholar]
- 4.Scatarige JC, Diette GB, Haponik EF, Merriman B, Fishman EK. Utility of high-resolution CT for management of diffuse lung disease: results of a survey of US pulmonary physicians. Academic radiology. 2003;10(2):167–175. doi: 10.1016/S1076-6332(03)80041-7. [DOI] [PubMed] [Google Scholar]
- 5.Copley SJ, Wells AU, Muller NL, Rubens MB, Hollings NP, Cleverley JR, Milne DG, Hansell DM. Thin-Section CT in Obstructive Pulmonary Disease: Discriminatory Value 1. Radiology. 2002;223(3):812–819. doi: 10.1148/radiol.2233010760. [DOI] [PubMed] [Google Scholar]
- 6.Ge Z, Sahiner B, Chan H-P, Hadjiiski LM, Cascade PN, Bogot N, Kazerooni EA, Wei J, Zhou C. Computer-aided detection of lung nodules: false positive reduction using a 3D gradient field method and 3D ellipsoid fitting. Medical physics. 2005;32(8):2443–2454. doi: 10.1118/1.1944667. [DOI] [PMC free article] [PubMed] [Google Scholar]
- 7.Yamagishi M, Koba H, Nakagawa A, Honma A, Yokokawa K, Saitoh T, Harada H, Watanabe H, Mori Y, Katoh S. Qualitative assessment of centrilobular emphysema using computed tomography. Nihon Igaku Hoshasen Gakkai zasshi. Nippon acta radiologica. 1991;51(3):203–212. [PubMed] [Google Scholar]
- 8.Uppaluri R, Mitsa T, Sonka M, Hoffman EA, McLennan G. Quantification of pulmonary emphysema from lung computed tomography images. American journal of respiratory and critical care medicine. 1997;156(1):248–254. doi: 10.1164/ajrccm.156.1.9606093. [DOI] [PubMed] [Google Scholar]
- 9.Chabat F, Yang G-Z, Hansell DM. Obstructive Lung Diseases: Texture Classification for Differentiation at CT 1. Radiology. 2003;228(3):871–877. doi: 10.1148/radiol.2283020505. [DOI] [PubMed] [Google Scholar]
- 10.Xu Y, van Beek EJ, Hwanjo Y, Guo J, McLennan G, Hoffman EA. Computer-aided classification of interstitial lung diseases via MDCT: 3D adaptive multiple feature method (3D AMFM) Academic radiology. 2006;13(8):969–978. doi: 10.1016/j.acra.2006.04.017. [DOI] [PubMed] [Google Scholar]
- 11.N. Kim, J. B. Seo, Y. S. Sung, B.-W. Park, Y. Lee, S. H. Park, Y. K. Lee, S.-H. Kang: Effect of various binning methods and ROI sizes on the accuracy of the automatic classification system for differentiation between diffuse infiltrative lung diseases on the basis of texture features at HRCT, presented at the Medical Imaging, 2008 (unpublished).
- 12.Raqhu G, Collard HR, Eqan JJ, Martinez FJ, Behr J, Brown KK, Colby TV, Cordier JF, Flaherty KR, Lasky JA, Lynch DA, Ryu JH, Swiqris JJ, Wells AU, Ancochea J, Bouros D, Carvalho C, Costabel U, Ebina M, Hansell DM, Johkoh T, Kim DS, King TE, Jr, Kondoh Y, Myers J, Muller NL, Nicholson AG, Richeldi L, Selman M, Dudden RF, Griss BS, Protzko SL, Schunemann HJ. An official ATS/ERS/JRS/ALAT statement: Idiopathic pulmonary fibrosis: evidence-based guidelines for diagnosis and management. American Journal of Respiratory and Critical Care Medicine. 2011;183(6):788–824. doi: 10.1164/rccm.2009-040GL. [DOI] [PMC free article] [PubMed] [Google Scholar]
- 13.Chang Y, Lim J, Kim N, Seo JB, Lynch DA. A support vector machine classifier reduces interscanner variation in the HRCT classification of regional disease pattern in diffuse lung disease: Comparison to a Bayesian classifier. Medical Physics. 2013;40(5):051912. doi: 10.1118/1.4802214. [DOI] [PubMed] [Google Scholar]
- 14.Kim N, Seo JB, Lee Y, Lee JG, Kim SS, Kang S-H. Development of an Automatic Classification System for Differentiation of Obstructive Lung Disease using HRCT. Journal Of Digital Imaging. 2008;22(2):136–148. doi: 10.1007/s10278-008-9147-7. [DOI] [PMC free article] [PubMed] [Google Scholar]
- 15.Lynch DA, Travis WD, Muller NL, Galvin JR, Hansell DM, Grenier PA, King J, Talmadge E. Idiopathic Interstitial Pneumonias: CT Features 1. Radiology. 2005;236(1):10–21. doi: 10.1148/radiol.2361031674. [DOI] [PubMed] [Google Scholar]
- 16.Mueller-Mang C, Grosse C, Schmid K, Stiebellehner L, Bankier AA. What Every Radiologist Should Know about Idiopathic Interstitial Pneumonias 1. Radiographics. 2007;27(3):595–615. doi: 10.1148/rg.273065130. [DOI] [PubMed] [Google Scholar]
- 17.Akira M, Inoue Y, Kitaichi M, Yamamoto S, Arai T, Toyokawa K. Usual Interstitial Pneumonia and Nonspecific Interstitial Pneumonia with and without Concurrent Emphysema: Thin-Section CT Findings 1. Radiology. 2009;251(1):271–279. doi: 10.1148/radiol.2511080917. [DOI] [PubMed] [Google Scholar]
- 18.Silva CIS, Muller NL, Hansell DM, Lee KS, Nicholson AG, Wells AU. Nonspecific Interstitial Pneumonia and Idiopathic Pulmonary Fibrosis: Changes in Pattern and Distribution of Disease over Time 1. Radiology. 2008;247(1):251–259. doi: 10.1148/radiol.2471070369. [DOI] [PubMed] [Google Scholar]
- 19.Pudil P, Novovičová J, Kittler J. Floating search methods in feature selection. Pattern recognition letters. 1994;15(11):1119–1125. doi: 10.1016/0167-8655(94)90127-9. [DOI] [Google Scholar]
- 20.Lim J, Kim N, Seo JB, Lee YK, Lee Y, Kang S-H. Regional Context-Sensitive Support Vector Machine Classifier to Improve Automated Identification of Regional Patterns of Diffuse Interstitial Lung Disease. Journal Of Digital Imaging. 2011;24(6):1133–1140. doi: 10.1007/s10278-011-9367-0. [DOI] [PMC free article] [PubMed] [Google Scholar]


