

Abstract
Tuberous sclerosis complex (TSC) is a dominantly inherited disease caused by hyperactivation of the mTORC1 pathway and characterized by the development of hamartomas and benign tumors, including in the brain. Among the neurological manifestations associated with TSC, the tumor progression of static subependymal nodules (SENs) into subependymal giant cell astrocytomas (SEGAs) is one of the major causes of morbidity and shortened life expectancy. To date, mouse modeling has failed in reproducing these 2 lesions. Here we report that simultaneous hyperactivation of mTORC1 and Akt pathways by codeletion of Tsc1 and Pten, selectively in postnatal neural stem cells (pNSCs), is required for the formation of bona fide SENs and SEGAs. Notably, both lesions closely recapitulate the pathognomonic morphological and molecular features of the corresponding human abnormalities. The establishment of long-term expanding pNSC lines from mouse SENs and SEGAs made possible the identification of mTORC2 as one of the mediators conferring tumorigenic potential to SEGA pNSCs. Notably, in spite of concurrent Akt hyperactivation in mouse brain lesions, single mTOR inhibition by rapamycin was sufficient to strongly impair mouse SEGA growth. This study provides evidence that, concomitant with mTORC1 hyperactivation, sustained activation of Akt and mTORC2 in pNSCs is a mandatory step for the induction of SENs and SEGAs, and, at the same time, makes available an unprecedented NSC-based in vivo/in vitro model to be exploited for identifying actionable targets in TSC.
Keywords: Neuroscience, Stem cells
Keywords: Neurodevelopment, Neurological disorders, Neuronal stem cells
Introduction
Tuberous sclerosis complex (TSC) is a multisystem autosomal dominant disorder resulting from mutations in either the TSC1 or the TSC2 gene that lead to mTOR complex 1 (mTORC1) pathway hyperactivation (1). TSC is characterized by benign hamartomas and tumors in multiple body organs. The manifestations in the central nervous system (CNS), i.e., cortical tubers, subependymal nodules (SENs), and subependymal giant cell astrocytomas (SEGAs), are the leading cause of morbidity and mortality (1–4).
SENs are asymptomatic periventricular nodular lesions, which may evolve postnatally and throughout early adulthood into benign tumors, known as SEGAs. The latter lesions grow within the ventricles, leading to hydrocephalus, increased intracranial pressure, and even death (1).
Both types of lesions comprise aberrantly differentiated cells, which are often giant and dysplastic. The abnormal cells found in TSC brain lesions express the same markers detected in progenitors within the ventricular/subventricular zone, implying that the brain-associated TSC manifestations may arise pathogenically from a stem/progenitor cell undergoing abnormal differentiation. Thus, others and we previously set out to ablate either Tsc1 or Tsc2 in neural stem cells (NSCs) (5–9). NSC-targeted conditional conventional mouse models were very proficient in developing defects in cortical lamination as well as subventricular zone (SVZ) abnormalities that resembled SENs, as reviewed in ref. 10. Likewise, conditional inducible mice, with Tsc1 deletion targeted to nestin-positive postnatal NSCs (pNSCs), demonstrated induction of focal aberrations, reminiscent of SENs, as well as heterotopias (7, 11). However, well-defined, cell-heterogeneous SENs and, most importantly, full-blown SEGAs were never detected in any mouse model.
Therefore, we reasoned that, in addition to the inactivation of the Tsc1 or Tsc2 gene, other molecular events might be required to induce discrete TSC lesions in genetically modified animals. A classical activator of mTOR is Akt, a downstream effector of PI3K. Notably, increased AKT phosphorylation has been described in human SENs and SEGAs with respect to control brain (12, 13).
To enhance Akt activation, we took advantage of a strategy relying on the inactivation of Pten, the major negative regulator of PI3K activation, which promotes cell proliferation and growth (14). In line with this hypothesis, Pten deletion in nestin-expressing pNSCs resulted in the formation of an aberrantly expanded SVZ (15), reminiscent of the periventricular SEN-like lesions observed upon Tsc1 deletion in embryonic NSC-targeted mouse models (6, 9).
We exploited inducible conditional transgenesis to delete not only Tsc1 but also Pten in a distinct subset of pNSCs, thus leading to hyperactivation of both mTOR and Akt. We generated Tsc1c/cPtenc/c Nestin-CreERT2+ (TPN) mice that, following gene deletion at different time points, harbored brain lesions that, for the first time to our knowledge, closely resembled human SENs and SEGAs, in terms of histology, cellular composition, and molecular pattern. From these lesions, we successfully isolated long-term expanding pNSCs, which were endowed with a distinctive cellular and molecular phenotype. Notably, SEGA-derived pNSCs were also able to give rise to SEGA-like lesions upon transplantation, thus indicating that these pNSCs may represent a valuable preclinical model of TSC brain abnormalities.
Results
Early-postnatal targeted inactivation of Tsc1 and Pten in SVZ pNSCs induces the formation of periventricular focal nodular lesions.
Patients’ SENs and SEGAs arise in the SVZ, which surrounds the lateral ventricles and comprises NSCs that persist postnatally (16). To test whether Tsc1 and Pten loss of function in this compartment might lead to the development of the periventricular lesions typical of TSC, we interbred Nestin-CreERT2 mice (17), in which the CreERT2 transgene is expressed in nestin-positive SVZ NSCs, with compound Tsc1c/cPtenc/c mice. After single or double tamoxifen (TMX) administration at early postnatal stages (i.e., P10 and P10–11), we obtained Tsc1c/cPtenc/c Nestin-CreERT2+ (TPN) mutant mice (n = 21), which were indistinguishable from their Tsc1c/cPtenc/c control littermates up to 4 days after TMX activation. From this time point, mutant mice showed a decrease in size (Supplemental Figure 1A; supplemental material available online with this article; https://doi.org/10.1172/JCI96342DS1) and displayed humped posture, dorsiflexion of the tail, and posterior limb-clasping behavior. They also showed a progressive decline in activity and hampered gait with limited mobility, and were easily identifiable from controls for the presence of disheveled fur and epithelial hamartomas. The brains of mutant mice were larger than controls (Supplemental Figure 1A). Mutant mice eventually died 37–45 days after birth (Supplemental Figure 1B), likely as a consequence of cerebellar defects due to Tsc1/Pten inactivation in nestin-expressing progenitor cells found in the early-postnatal cerebellum (Supplemental Figure 1A) (18).
Firstly, we traced the fate of mutant pNSCs by interbreeding TPN mice with tdT reporter mice (TPN-tdT mice) (Supplemental Figure 1C). Forty-eight hours after TMX administration, tdT+ cells were found all along the SVZ (Supplemental Figure 1C). Most of these cells were immunoreactive (IR) for nestin and were interposed among tdT+ S100β-IR ependymal cells (Supplemental Figure 1D). Some of the tdT+ cells were positive for GFAP, one of the markers of bona fide SVZ NSCs (Supplemental Figure 1E).
Interestingly, 27–32 days after TMX administration, both TPN and TPN-tdT mice showed the presence of multiple alterations distributed along the SVZ bilaterally (Figure 1A and Supplemental Figure 2A). Such abnormalities, which were tdT+ (Supplemental Figure 2A), included an aberrant expansion of the upper SVZ as well as several circumscribed nodules protruding in the lateral ventricles that were also significantly enlarged. Ectopic bulb-like ventral structures, located in the proximity of the interventricular foramen and similar to those described in single Tsc1c/c Nestin-CreERT2+ mice (7, 11) and Ptenc/c Nestin-CreERT2+ mice (15), were also found (Supplemental Figure 2A). Most of the tdT+ cells within all nodules hyperactivated mTORC1, as shown by pS6 staining, and were GFAP-IR (Supplemental Figure 2, B and C).
Figure 1. Targeted inactivation of Tsc1 and Pten in early-postnatal SVZ NSCs promotes the development of SVZ aberrant structures, reminiscent of SENs.

(A) Intraventricular nodular lesions were retrieved in the brains of TPN mice activated at P10 (H&E; original magnification ×40 and ×400) and were never found in controls (H&E, ×40). The lesions comprised small cells that lay within a gliofibrillary matrix (H&E, ×400) and were pS6-IR, GFAP-IR, NeuN-IR, and DCX-IR (IHC, ×100 and ×400; controls, ×40, ×100, ×400 for inset and DCX/GFAP staining). GFAP-IR and NeuN-IR cells were often colabeled for pS6 (IHC and immunofluorescence [IF], ×400). GFAP and DCX expression was never retrieved in the same cells (×400). (B) The stem cell markers Pax6 and Sox2 were expressed only in the small cells of the lesions at low levels (original magnifcation, mutant, ×40, ×100, and ×400; controls, ×40 and ×100), whereas the early neuronal marker Tuj1 was found in the majority of the cells (×40, ×200, and ×400). The late oligodendroglial marker MBP was never expressed in the lesions (×40, ×100, and ×400). (C) S100β immunoreactivity was restricted to ependymal cells and was never found in the nodular lesions (×40 and ×100; controls, ×40 and ×100). Few Iba1-IR microglial cells and vimentin-IR reactive glial cells were retrieved in the nodular lesions (×40 and ×200; controls, ×40 and ×100). The mitotic index of the lesions as measured by Ki67 was very low (×40 and ×200).
Hematoxylin and eosin (H&E) indicated that the lesions retrieved along the ventricular walls of mutant mice, including those located ventrally, were made up of small cells dispersed within a gliofibrillary matrix, with only few large cells observed (Figure 1A). Most cells in the lesions were pS6-IR. Interestingly, GFAP expression was retrieved in the reactive astrocytes contributing to the gliofibrillary matrix as well as in the pS6-IR small cells within the lesions (Figure 1A and Supplemental Figure 2C). The nodules comprised also ectopic NeuN-IR mature neuronal cells that were pS6-IR as well as a high frequency of DCX-IR neuroblasts. Colabeling of neuronal and glial markers (i.e., DCX and GFAP) was never retrieved in the same cell.
As opposed to the ventrally located nodules described in the single Tsc1 mutant mouse model (7), both dorsal and ventral lesions in P10 TPN mice comprised cells that expressed stem cell markers such as Pax6, and, to a lower extent, Sox2, suggesting that a fraction of cells within these lesions retained an immature phenotype (Figure 1B). Accordingly, most cells expressed the early neuronal marker Tuj1, while being negative for the mature oligodendroglial marker MBP (Figure 1B).
S100β expression was present in the ependymal layer that lined the ventricles but not in the nodules, which comprised activated inflammatory Iba1-IR cells and a few vimentin-positive reactive astrocytes (Figure 1C). Notably, the proliferation index of the lesions by Ki67 was negligible, further underlining their benign and static nature (Figure 1C).
Notably, all lesions showed increased pAktT308 activation, as expected in light of the relief of the negative feedback after Pten loss (Figure 2A). Only modest activation of pErk was retrieved in the nodules, which was mostly restricted to cells within the SVZ (Figure 2A and Supplemental Figure 2D). Activation of mTORC2, as measured by pNdrg1, was never observed (Figure 2A).
Figure 2. The periventricular abnormalities developing in P10 TPN mice activate selected signaling pathways and are responsive to mTOR inhibition by rapamycin.

(A) Significant hyperactivation of pAktT308 was observed in SEN-like lesions, whereas only low phosphorylation of Erk and Ndrg1 was found (original magnification, ×40, ×100, and ×400; controls, ×40 and ×200 for pAkt and pErk; ×40 and ×100 for pNdrg1). (B) Chronic rapamycin treatment from P19 to P75 reduced both hydrocephalus and the SVZ nodular lesions and restored the activation of pS6, pErk, and pNdrg1 to control levels (×40 and ×400, insets, for pS6; ×400 for pErk and pNdrg1). Representative analysis of n = 10 pairs of control and mutant mice.
To assess whether treatment with mTOR inhibitors could revert the mutant phenotype in terms of overall survival, behavior, and development of periventricular lesions, we administered rapamycin i.p. to P10 TPN mice (n = 8) every 48 hours from P19, when some of the SVZ alterations were already detectable (Supplemental Figure 2E), up to P75. All mutant mice treated by this regimen increased in size and were alive and healthy at the latest time points assessed (i.e., 2 times the lifespan of vehicle-treated mutant mice), whereas all vehicle-treated mutant mice died at the expected time points. Accordingly, mTOR inhibitor–treated mutant mice did not show any clear periventricular alteration, and their brain cytoarchitecture was identical to that of controls, also in terms of signaling pathway activation (Figure 2B).
All together, these findings suggest that the intraventricular lesions forming after deletion of both Tsc1 and Pten in NSCs at P10 might resemble the benign and static SEN-like lesions found in TSC patients.
The nodular lesions developing in early-postnatally activated TPN mice closely resemble the corresponding human SENs.
To assess whether the lesions in TPN mice activated early-postnatally were reminiscent of the human counterpart, we performed an unprecedented immunohistochemistry-based (IHC-based) comparative analysis with human TSC patient specimens (Figure 3 and Table 1). Remarkably, many morphological and molecular features displayed by the lesions developing in TPN mice activated at P10 or P10–11 (not shown) were the same as observed in human SENs (postmortem specimens, n = 3).
Figure 3. Mouse SENs closely mimic the corresponding human manifestation.

(A) The morphology of human (n = 3) and mouse SENs (n = 3) was characterized by the presence of a gliofibrillary mesh that contained a majority of small cells and only rare giant cells (thick arrows). Some large cells in human and mouse SENs were also multinucleated (thin arrows; H&E; original magnification, ×600 and ×1,000). (B) Many cells in human SENs significantly hyperactivated pS6 and pAKTT308, as observed in mouse SENs. (C) Only a minority of small cells within both human and mouse lesions expressed GFAP (arrows), mostly found in reactive astrocytes, and NeuN (×600). The stem cell markers Pax6 and Sox2 were expressed at a low level in both human and mouse lesions, whereas the early neuronal marker Tuj1 was highly expressed in the majority of the cells. (D) Reactive glial cells but also some giant and small cells were immunoreactive for vimentin in human and mouse SENs. Low phosphorylation of Erk was found in both lesions (×600).
Table 1. Summary of morphological traits and molecular expression patterns found in autochthonous mouse SENs and SEGAs, pNSC-induced mouse SEGAs, and human SENs and SEGAs.
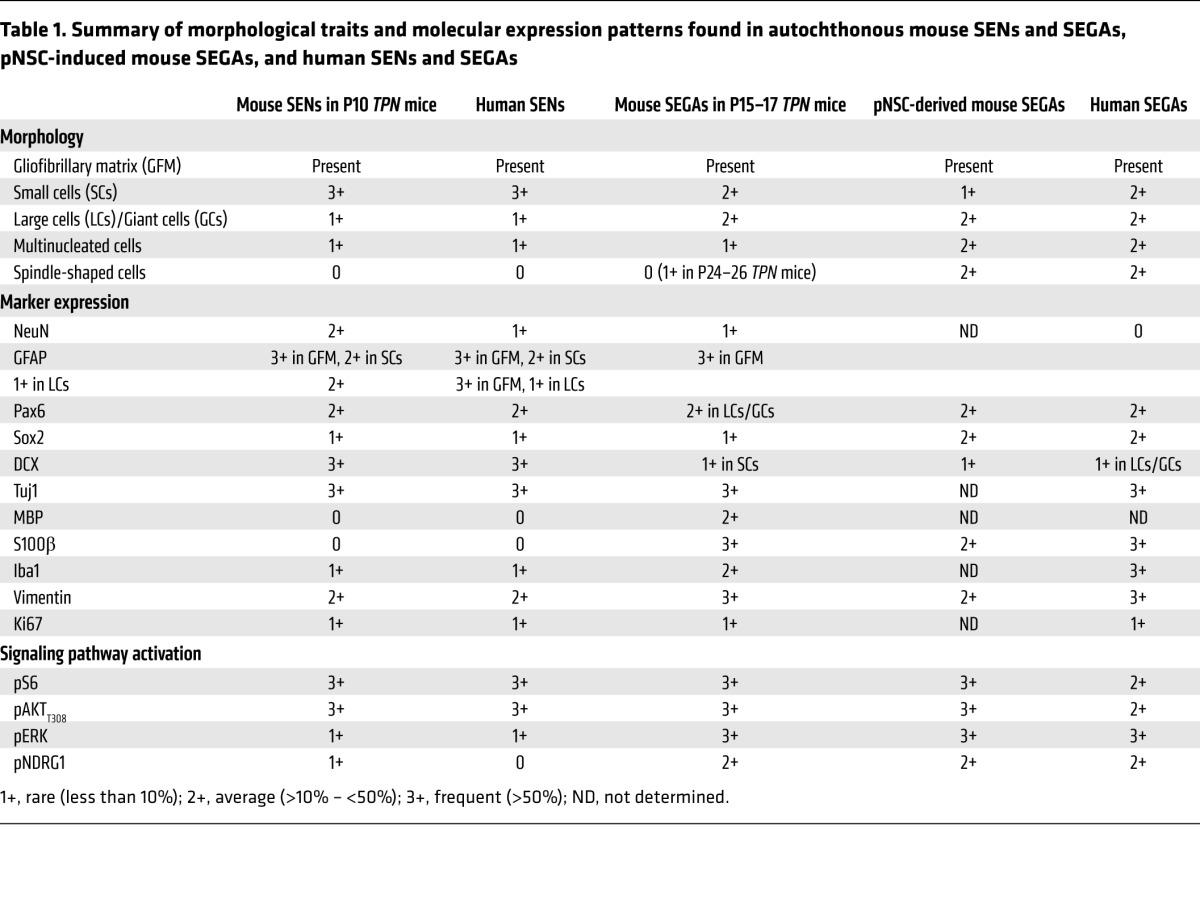
Indeed, human SENs comprised many small cells interspersed within a gliofibrillary matrix with only very few large and multinucleated cells retrieved (Figure 3A). Many cells within the human lesions showed hyperactivation of pS6 and, unexpectedly, pAKTT308, suggesting that the mTORC1-dependent negative feedback might not be in place in human SENs (Figure 3B). Some small cells within human SENs expressed GFAP that was more abundant in cells of the gliofibrillary matrix; few cells were positive for NeuN (Figure 3C). Small cells were also positive for the stem cell markers PAX6 and SOX2. Many cells expressed the early neuronal marker Tuj1. Similarly to GFAP expression, vimentin was mostly retrieved in reactive glial cells, with small nonglial cells only rarely being positive (Figure 3D). Some Iba1-IR microglial cells were found, whereas S100β-IR cells were never retrieved (not shown). Most interestingly, only occasional cells in human SENs did activate pERK, as previously reported (ref. 13 and Figure 3D). Activation of pNDRG1 was never detected (not shown).
Thus, the aberrant structures developing in early-activated TPN mice are endowed with the very same traits retrieved in human SENs and do qualify as SENs.
Late-postnatal targeted inactivation of Tsc1 and Pten in SVZ pNSCs promotes the development of expansive intraventricular lesions.
To test whether late activation of Tsc1/Pten deletion in SVZ pNSCs might allow the formation of lesions displaying features of SEGAs, we administered TMX to TPN mice in 2 distinct time windows, i.e., P15–17 (n = 10) and P24–26 (n = 7). TPN mice treated at P15–17 showed only minor defects in body growth, while displaying a highly enlarged brain (Supplemental Figure 3A). Conversely, mice treated at P24–26 did not show any macroscopic pathological phenotype (not shown). Accordingly, TPN mice treated at P15–17 survived for up to 90 days, with the majority of mutant mice dying around 60 days (Supplemental Figure 3B) owing to a general deterioration of the clinical conditions that was reminiscent of that observed in P10 TPN mice and was again likely dependent on the onset of cerebellar defects (Supplemental Figure 3A). TPN mice activated at very late time points, when cerebellar neurogenesis is over, were still alive and in good health 175 days after birth (Supplemental Figure 3B).
Lineage tracing in P15–17 TPN-tdT mice 48 hours after TMX activation indicated that many tdT+ cells were retrieved in the SVZ, whereas in P24–26 TPN mice they were reduced in number (Supplemental Figure 3, C–E). In both types of mice, tdT+ cells were nestin-IR and GFAP-IR and were still located among tdT+/S100β-IR ependymal cells (Supplemental Figure 3, D and E).
When analyzed 80 days after birth, P15–17 TPN and TPN-tdT mice developed bilateral bulgy structures (Figure 4A and Supplemental Figure 4A), located in the upper portion of the ventricles and gradually erupting ventrally when moving anteroposteriorly (Supplemental Figure 4A), with pS6-IR (Supplemental Figure 4B) and GFAP-IR (Supplemental Figure 4C) tdT+ cells found all throughout the lesions.
Figure 4. Targeted inactivation of Tsc1 and Pten in late-postnatal SVZ NSCs induces SEGA-like lesions.

(A) An aberrant expansion of the lateral ventricles was observed in TPN mice activated at P15–17, which were characterized by the presence of small (H&E, arrowheads) and large cells (H&E, thick arrows) intermixed within a lax fibrillary matrix (H&E; original magnification, ×40, ×400, and ×800). These structures, which were never observed in control brains (H&E; ×40), contained many pS6-IR cells (×100 and ×400). GFAP immunoreactivity was found mostly in reactive glial cells (IHC; ×200 and ×400; IF, pS6 in green, GFAP in red, and DAPI in light blue; ×400, panel with single asterisk), and less frequently in clusters of pS6-IR cells (IF, pS6 in green, GFAP in red, and DAPI in light blue; ×400, panel with double asterisk). Ectopic NeuN-IR neuronal cells were scattered throughout the lesions, some of which were pS6-IR (×200 and ×400). As opposed to SENs, only rare DCX-IR cells were found, which never colabeled with GFAP (×200 and ×400; controls, ×40, ×100, and ×400 for inset and DCX/GFAP staining). (B) Expression of Pax6 and Sox2 was restricted to large cells within the lesions, whereas Tuj1 expression was detected in most cells (mutants, ×40 and ×400; controls, ×40 and ×100). As opposed to SENs, several MBP-IR cells were found in the SEGA-like lesions. (C) S100β-IR cells were found in the intact ependymal layer (arrow), as in controls (×40 and ×100), as well as within the lesions (×40 and ×400). High frequency of Iba1-IR microglial cells and vimentin-IR reactive glial cells was observed in the lesions as compared with SENs (×40, ×200, and ×400; controls, ×40 and ×100). The mitotic index of the lesions as measured by Ki67 was still very low (×40, ×200, and ×400).
By H&E, P15–17 TPN lesions, which presented as well-demarcated intraventricular masses and did not invade the periventricular parenchyma, comprised 2 main morphologically distinct cell populations: some small astrocyte-like cellular elements, and many pS6-IR SEGA-typical giant cells, containing nuclei showing fine granular chromatin, distinct nucleoli, and glassy cytoplasm (Figure 4A). Both cell types were comprised within a gliofibrillary matrix, which was predominantly composed of GFAP-IR reactive glial cells, with very few clusters of GFAP-IR cells being also pS6-IR (Figure 4A). This was at odds with SENs, in which many GFAP-IR cells in the nodular lesion were also pS6-IR. Only scant cells expressing the mature neuronal marker NeuN were present in P15–17 TPN lesions, few of them being pS6-IR (Figure 4A). DCX-IR cells, which did not colabel with GFAP, were also detected and, as opposed to pS6-IR cells, were mostly small in size and restricted to the lesion boundary (Figure 4A). Notably, their frequency and staining intensity in the lesions were lower than in mouse SENs.
The expression of the stem cell markers Pax6, Sox2, and Tuj1 was found at the same frequency observed in SENs, with Pax6 staining in P15–17 TPN lesions being restricted to giant cells (Figure 4B). As opposed to SENs, several MBP-IR cells were scattered throughout P15–17 TPN lesions (Figure 4B).
Interestingly, the S100β-IR ependymal layer in P15–17 TPN lesions was intact, as in human SEGAs, in which ependymal integrity is known to limit the dissemination of tumor cells in the liquor. In contrast with SENs, many S100β-IR cells that were not ependymal were also found in the lesions (Figure 4C). Iba1-IR activated microglial cells as well as vimentin-IR reactive glial cells were detected at higher frequency in these lesions than in SENs, suggesting the activation of a general inflammatory response (Figure 4C). As in SENs, low mitotic activity was observed (Figure 4C).
As in SENs, pAktT308 hyperactivation was again observed, in particular in the SEGA-typical large cells (Figure 5A). Most notably, a significantly higher phosphorylation of Erk (Figure 5A and Supplemental Figure 4D) and Ndrg1 (Figure 5A), mainly confined to small cells, was retrieved in these lesions than in SENs.
Figure 5. The periventricular abnormalities developing in P15–17 TPN mice hyperactivate pErk and pNdrg1 and regress upon rapamycin treatment.

(A) SEGA-like lesions displayed strong hyperactivation of pAktT308, pErk, and pNdrg1 (original magnification, ×40, ×200, and ×400; controls, pAkt, ×40 and ×200; pErk and pNdrg1, ×40 and ×100). (B) Chronic rapamycin treatment from P24 to P185 decreased both hydrocephalus and the SVZ aberrant structures and reduced pS6, pErk, and pNdrg1 phosphorylation to control levels (×40 and ×400, insets, for pS6; ×400 for pErk and pNdrg1). Representative analysis of n = 10 pairs of control and mutant mice.
The same bulb-like ventral abnormalities observed in P10 TPN mice were retrieved also in P15–17 TPN mice (Figure 5B), but in this case they did acquire very clear features of SEGA, e.g., the presence of giant cells and the activation of pErk and pNdrg1, as opposed to SEN-like lesions previously detected in single Tsc1 mutant mice (ref. 7 and not shown).
As done for SEN-bearing mice, we subjected TPN mice activated at P15–17 (n = 8) to rapamycin treatment from P24 to P185, and, again, observed full recovery of mutant mice and absence of any periventricular lesion (Figure 5B).
Most remarkably, very late TMX activation of tdT-TPN and TPN mice at P24–26 induced the formation of focal and discrete SEGA-like lesions (Supplemental Figure 4, E and F) that were characterized by a strong enhancement of the SEGA phenotype. Indeed, in addition to the 2 populations of small and giant cells observed in P15–17 TPN lesions, a third cell population made up of spindle-shaped fascicular cells was also detected (Supplemental Figure 4F). Hyperactivation of pErk and pNdrg1 was observed not only in the small cell component, but also in large cells (Supplemental Figure 4F). Immunofluorescence on tdT-TPN mice activated at P24–26 confirmed the same pattern retrieved by IHC for pS6 and pERK and highlighted the presence of a few GFAP-IR tdT+ cells (Supplemental Figure 4G).
Overall, the lesions forming in P15–17 and P24–26 TPN mice showed benign tumor-like features, such as enlarged cellular mass, reduced cell differentiation, enhanced growth pathway activation, and increased inflammation, thus potentially qualifying as SEGAs.
The abnormal structures developing in late-postnatally activated TPN mice display the same pathognomonic features as human SEGAs.
To confirm the SEGA nature of the above-described lesions, we compared them with human specimens by IHC and found that the mouse lesions developing in TPN mice activated at P15–17 and P24–26 (Figures 4 and 5 and Supplemental Figure 4) did share many morphological features and marker expression with patients’ SEGAs (Figure 6 and Table 1). These specimens, all obtained after surgical resection (n = 15; Supplemental Table 1), were heterogeneous in terms of cell composition. The common morphological trait among different patients’ samples was the abundant gliofibrillary matrix, again made up mostly of reactive astrocytes (Figure 6A), in which distinct cell populations were intermixed, although in variable proportions in different patients’ samples. Three main cell types were reported: (a) cells with ganglionic, balloon-like morphology, very large soma, peripheral nucleus, and eosinophilic glassy cytoplasm, in some cases also bi- or multinucleated (Figure 6B); (b) small cells with glial appearance (Figure 6B); and (c) small/normal-sized cells with a central nucleus, spindle morphology, and long processes intersecting as fascicles (Figure 6C). Notably, both human and mouse lesions did comprise several multinucleated cells (Figure 6B).
Figure 6. Mouse SEGAs reproduce the cellular heterogeneity of human SEGAs.

(A) The morphology of different specimens of human SEGAs (n = 6) was characterized by the presence of a gliofibrillary matrix that surrounded different types of cells, a trait observed also in mouse SEGAs (P15–17 and P24–26 TPN mice; n = 3) (H&E; original magnification, ×600). (B) Large and giant cells (thick arrows) with balloon morphology that were also multinucleated (thin arrows), together with smaller cells (arrowheads), were found in human and, notably, also in mouse SEGA samples (H&E; ×600 and ×1,000). (C) Areas containing fascicles of spindle-shaped cells were observed in both human and mouse SEGAs (H&E; ×600).
All human SEGA samples hyperactivated pS6 and, very interestingly, pAKTT308, again underlining the unexpected lack of activation of the negative-feedback loop in patients’ tumors (Figure 7A). GFAP expression was found mostly in reactive astrocytes and rarely in cells with giant morphology, whereas DCX was expressed only in a few clusters of cells (Figure 7A). Human SEGAs expressed SOX2 and PAX6 as well as Tuj1 at very high levels in the majority of cells (Figure 7B). NeuN expression was never detected (not shown). Interestingly, S100β and vimentin expression was retrieved not only in small reactive astrocytes but also in giant and spindle-shaped cells (Figure 7C). The inflammatory response in human SEGAs was very high, as indicated by the frequency of Iba1-IR activated microglia (Figure 7C). Most significantly, the majority of human SEGA samples hyperactivated pNDRG1 and pERK (Figure 7D).
Figure 7. Mouse SEGAs express markers similar to those expressed by human SEGAs.

(A) Giant cells in human SEGAs significantly hyperactivated pS6 and pAKTT308, as observed in mouse SEGAs. Many cells with variable size within both human and mouse lesions expressed GFAP and DCX (original magnification, ×600). (B) Expression of the stem cell markers Pax6 and Sox2 and of the early neuronal marker Tuj1 was detected in both human and mouse lesions (×600). (C) S100β-IR cells were retrieved in both human and mouse lesions. Many cells with different morphology were immunoreactive for vimentin in human and mouse SEGAs. Interestingly, many Iba1-IR activated microglial cells were found in either lesion (×600). (D) As opposed to SENs, strong hyperactivation of pNDRG1 and pERK was detected in SEGA lesions of human and mouse origin (×600).
Thus, the lesions forming after deletion of both Tsc1 and Pten in NSCs at late postnatal stages faithfully reproduced the SEGAs developing in TSC patients.
Postnatal NSCs isolated from SENs and SEGAs developing in TPN mice retain molecular and cellular features of their lesion of origin.
To determine whether TPN-derived abnormalities did comprise NSCs, we subjected distinct mouse SENs and SEGAs to neurosphere assay (6, 9). We successfully established long-term expanding pNSC lines from both types of mutant lesions (n = 6 from SENs and n = 4 from SEGAs); these pNSC lines underwent efficient ablation of Tsc1 and Pten, as shown by genomic DNA PCR analysis (Supplemental Figure 5A).
Under proliferative culture conditions, SEN and SEGA pNSCs were more adhesive than controls, with SEGA pNSCs being multinucleated and showing a highly aberrant morphology (Figure 8A).
Figure 8. Postnatal NSCs isolated from SENs and SEGAs developing in TPN mice retain molecular and cellular features of their lesion of origin.

(A) Phase contrast microphotographs highlight the increased adhesive behavior of mutant pNSCs as compared with controls (representative P15–17 TPN pNSCs line L1; original magnification, ×400). SEGA-derived pNSC cultures contained multinucleated cells (representative P15–17 TPN pNSCs line L90; red, cortactin; green, nestin; ×800). (B) Both undifferentiated and differentiated P10 and P15–17 TPN cultures (L22 and L1) showed higher pS6 phosphorylation and nestin expression than controls (L26 and L4) (×400). Abnormal expression of neuronal and glial markers, such as Tuj1, GFAP, and GalC-IR, was retrieved by IF in both undifferentiated and differentiated P10 and P15–17 mutant cultures as compared with controls (×400). Data are representative of 3 pairs of pNSC lines for each activation time. (C) WB of undifferentiated P10 and P15–17 pNSCs highlighted efficient deletion of Tsc1 (*specific band) and Pten as well as different hyperactivation of mTORC1, Akt, ERK, and mTORC2 in mutant versus control pNSCs, with pERK and mTORC2 being more activated in SEGA pNSCs than in SEN pNSCs.
To test whether mTORC1 hyperactivation in pNSCs affected their multilineage differentiation potential, we analyzed them before and after differentiation by immunofluorescence (Figure 8B). As expected, pS6 was more highly phosphorylated in SEN and SEGA pNSCs than in controls, even when triggered to terminal differentiation (Figure 8B and Supplemental Table 2). Similarly, whereas control and mutant pNSCs did express the undifferentiated progenitor marker nestin when proliferating, only mutant pNSCs continued to express nestin upon differentiation, suggesting that mutant pNSCs remained immature (Figure 8B). Accordingly, while control pNSCs properly matured into Tuj1-IR neurons, GFAP-IR astrocytes, and GalC-IR oligodendrocytes, mutant pNSC-derived progeny contained many aberrant GFAP-IR cells and few Tuj1-IR, which were often abnormally colabeled with GFAP (Figure 8B and Supplemental Table 3), with no GalC-IR oligodendrocytes detected (Figure 8B).
When analyzed in comparison with their matched controls for the activation of selected molecular pathways by Western blotting (Figure 8C), both SEN and SEGA pNSCs showed lack of Tsc1 and Pten, as well as downregulation of Tsc2. In line with in vivo results, hyperactivation of pS6 and of its upstream activator pS6K was found in mutant pNSCs. Hyperphosphorylation of pAktT308 was retrieved in mutant pNSCs as compared with controls, confirming that the negative feedback active on Akt was relieved upon Pten deletion. Similarly, higher phosphorylation of the mTORC2 regulatory subunit mSin1T86 as well as of mTORC2 downstream effectors such as pAktS473 and pNdrg1 was observed in mutant as compared with control pNSCs, indicating increased signaling through mTORC2. The Akt downstream target pGsk3β was also hyperphosphorylated in mutant pNSCs.
Interestingly, when we compared the activation level of the different signaling pathways in SEN versus SEGA pNSCs, we found that pNdrg1, pErk, and pGsk3β were more highly hyperactivated in SEGA than in SEN pNSCs (Figure 8C), thus proposing them as potential SEGA-specific markers.
Quantitative analysis by Western blot indicated that, even upon differentiation, pAkt (Figure 9A and Supplemental Table 2) remained hyperactivated in both SEN and SEGA pNSC-derived progeny, with pNdrg1 and pErk being also more highly phosphorylated in SEGA than in SEN progeny (Figure 9, A and B, and Supplemental Table 2). Overall, these data suggest that the persistent activation of these pathways was likely involved in the impaired differentiation of mutant pNSCs.
Figure 9. Postnatal NSCs isolated from SENs and SEGAs developing in TPN mice hyperactivate pErk and pNDRG1 upon differentiation.

(A and B) WB and IF of undifferentiated and differentiated P10 and P15–17 pNSC cultures indicated persisting hyperactivation of pErk and pNDRG1 even upon differentiation, in particular in SEGA pNSC-derived progeny (original magnification, ×400). Representative P10 TPN pNSC line L22 and P15–17 TPN pNSC line L1.
Notably, exposure of mutant pNSCs to 100 nM rapamycin under proliferating conditions (48 hours) and during differentiation strongly inhibited pS6 hyperphosphorylation, reduced aberrant nestin expression, and decreased pErk and pNdrg1 activation (Supplemental Figure 5C and Supplemental Table 4), while only occasionally restoring proper differentiation into astrocytes and oligodendrocytes (Supplemental Figure 5C).
Thus, mTORC1 and Akt hyperactivation in SEN and SEGA pNSCs impairs their multipotency and differentiation potential by promoting the differential hyperactivation of growth signaling pathways. In particular, mTORC2 and pErk were significantly hyperactivated in SEGA pNSCs, as observed in the corresponding lesions in vivo.
The ability of SEGA pNSCs to give rise to tumors upon transplantation is sustained by mTORC2 activation.
Next, we asked whether SEN and SEGA pNSCs could give rise to the original parental lesion once implanted in vivo. Sixty days after s.c. injection into nude mice, whereas SEN pNSCs (n = 5 cell lines tested) failed in generating any kind of lesion, SEGA pNSC lines (n = 3 cell lines tested) induced the formation of tumors (n = 4 for each line) that histologically resembled both mouse and human SEGAs (Figure 10A and Table 1). Tumors from distinct SEGA pNSC lines were morphologically very different (Figure 10A), as described for human SEGAs from distinct patients. Tumors derived from TPN pNSC line L3 showed large regions made up of spindle-shaped cells with processes running in intersecting fascicles, as in the SEGA of patient 3 (Figure 10A). In contrast, tumors from TPN pNSC line L90 comprised many areas containing giant and pleomorphic cells, which were often multinucleated, interspersed within a lower number of spindle-shaped cells, as retrieved in the samples from patients 5 and 6 (Figure 10A). Lastly, tumors from line L1 contained both large and spindle-shaped cells in similar proportions, as in patients 10 and 13. All types of subcutaneous lesions activated pS6, pAkt, pErk, and pNdrg1 (Figure 10B and Supplemental Figure 6) and expressed several SEGA-specific markers (Supplemental Figure 6), implying that pNSCs did preserve their SEGA-like features even in vivo.
Figure 10. SEGA pNSCs are endowed with tumorigenic potential and give rise to secondary tumors that resemble the corresponding human lesions both histologically and molecularly.

(A) Tumors generated by the s.c. implantation of distinct pNSCs (H&E, right) reproduced the heterogeneity in morphology and cell composition observed in human SEGA samples (H&E, left). pNSC line L3–derived tumors were characterized by the prevalence of spindle-shaped cells, as in human specimen 3. Conversely, mouse SEGAs from L90 contained mostly large and giant cells, some of which were also multinucleated (arrows), as retrieved in patients 5 and 6. Tumors from line L1 comprised both spindle-shaped and giant cells at similar frequency, as shown in patients 10 and 13. (Original magnification, ×400 and ×600 in human samples; in mouse samples: L3 and L90 tumors, ×200, ×400, and ×600; L1 tumors, ×400 and ×600). (B) Subcutaneous tumors activated pS6, pAktS473, pErk, and pNDRG1 (×600). Representative P15–17 TPN pNSC line L3. (C) Heatmap showing the top 10 increased/decreased genes differentially expressed between control pNSCs and mouse SEGAs, ranked based on their P value (P < 0.001). Blue, low; red, high (n = 3 independent biological replicates for each condition). Quantitative PCR analysis confirms Gpnmb as the top-ranking upregulated gene in mouse SEGAs (n = 3 independent biological replicates for each condition). Quantitative PCR results are expressed as the mean ± SEM. Two-group comparisons were performed with the independent-samples t test. *P < 0.05 (P = 0.0216). (D) GSEA enrichment plot indicating that the 809 genes upregulated in human SEGAs versus normal control human brain tissue positively correlated with genes preranked based on their expression in pNSC-derived mouse SEGAs versus control pNSCs. Nominal P < 0.00001; FDR q < 0.00001; enrichment score, 0.178; normalized enrichment score, 5.69.
To corroborate these findings from a molecular standpoint, we subjected subcutaneous SEGAs to transcriptional profiling by RNA sequencing (RNA-Seq). Interestingly, many genes that were upregulated in pNSC-derived mouse SEGAs versus control pNSCs (with log2 fold change ranging from 5 to 8) (Figure 10C) were highly expressed also in the corresponding human TSC lesions, e.g., Gpnmb (6, 19, 20), Mpeg1 (20), Ltf, and Sln (19) (Supplemental Table 5 and Supplemental Figure 7). Notably, Gpnmb, one of the 10 top-ranking upregulated genes in mouse SEGAs (Figure 10C), was confirmed as being overexpressed more than 200 times in mouse SEGAs over control pNSCs by quantitative PCR analysis (Figure 10C).
Then, we formally assessed whether the gene signatures qualifying mouse SEGAs correlated with the gene expression profiles of human SEGAs (20) by gene set enrichment analysis. To this end, we selected all the genes expressed in mouse SEGAs as compared with control pNSCs and queried this list with the genes that were upregulated in the comparison between 13 human SEGA samples and control brain tissues (20). Remarkably, almost all genes overexpressed in human SEGAs positively correlated with those upregulated in mouse SEGAs (Figure 10D and Supplemental Table 6).
Next, to further test the degree of molecular commonality between mouse and human brain lesions, we exploited mutational data derived from human SEN/SEGA specimens (20) and assessed whether somatic mutations could be retrieved in the human PTEN locus or in protein known to interact with PTEN (21). Notably, no mutations were retrieved either in PTEN or in members of its interactome (data not shown). However, in line with the hyperactivation of AKT in human SENs and SEGAs that we described above, AKT-related pathways and their associated genes were significantly enriched within the transcripts upregulated in human SEGAs by Enrichr-based analysis (Supplemental Table 7).
To pinpoint the mechanism(s) responsible for the evolution of SENs into SEGAs, as recapitulated ex vivo by the exclusive tumorigenic ability of SEGA-derived pNSCs, we interfered with the expression of one of the pathways that were hyperactive in SEGA versus SEN lesions as well as in SEGA versus SEN pNSCs, i.e., mTORC2. To this end, we silenced Rictor, the mTORC2-specific subunit, in TPN SEGA pNSC line L1 by RNAi. Significant knockdown of Rictor and reduced activation of the mTORC2 subunit pmSin1T86 as well as of the mTORC2 downstream effectors pNdrg1 and pAktS473 were achieved by means of lentiviral shRNAs (Figure 11A). Remarkably, shRNA Rictor–transduced pNSCs gave rise to tumors that were significantly reduced in size as compared with empty vector–infected lesions (Figure 11B). Accordingly, Rictor-silenced tumors retained a significant decrease in mTORC2 activation (Figure 11C) and displayed a strong reduction in SEGA-like features, as large and giant cells were not found (Figure 11D).
Figure 11. The tumorigenic potential of SEGA is modulated by mTORC2 pathway activation.

(A) Rictor knockdown in pNSC negatively impacted on mTORC2 activation (WB). WB contains distinct lanes coming from replicate samples run on parallel gels. (B) Rictor silencing in pNSCs resulted in tumor growth impairment (histogram plot, left panel; example of tumor volumes, right panel). Results are expressed as the mean ± SEM. Two-group comparisons were performed with the independent-samples t test. *P < 0.05. Representative P15–17 TPN pNSC line L1. (C) Tumors in which mTORC2 was inactivated showed decreased pAktS473 and pNDRG1 activation (WB). WB contains distinct lanes coming from replicate samples run on parallel gels. (D) Rictor-silenced tumors were morphologically different from controls, as they contained only rare giant and/or large cells, being mostly composed of spindle-shaped cells (H&E; original magnification, ×400). In line with WB results, the activation of pAktS473 and pNDRG1 was reduced in Rictor-silenced tumors; no significant modifications were seen in pS6 and pERK activity (×400). Representative P15–17 TPN pNSC line L1.
Single mTOR inhibition is a more effective strategy than dual PI3K-mTOR blockade in hampering mouse SEGA growth.
To assess whether single mTOR or dual PI3K-mTOR inhibition could elicit distinct responses in terms of SEGA growth by differentially inhibiting Pten loss–induced Akt activation, SEGA pNSCs were implanted s.c. into nude mice, and, when tumor volume reached 10–20 mm3 42 days after transplant, animals were randomized and treated for 5 days a week with either rapamycin (6 mg/kg) or the dual PI3K-mTOR inhibitor PI-103 (5 mg/kg) (22) up to 4 weeks. Mice treated with either drug did not show any sign of toxicity based on body weight, food/water intake, and activity. Overall, both rapamycin and PI-103 showed inhibitory activity up to 63 days after transplant in vivo (Figure 12A). However, a significant — more than 5-fold — and persistent reduction in average tumor size was observed at 71 days only in mice treated with rapamycin as compared with those treated with vehicle and PI-103 (Figure 12B). In line with these findings, whereas both vehicle- and PI-103–treated tumors comprised atypical cells with large eosinophilic cytoplasm and spindle-shaped cells with hyperchromatic elongated nuclei and numerous mitotic figures and necrotic foci, rapamycin-treated tumors were characterized by low cellularity and by cells with large eosinophilic cytoplasm and round or oval nuclei with 1 or more prominent nucleoli (Figure 12C). Spindle-shaped cells were scarcely represented, mitotic figures were sporadic, and no necrotic foci were found (Figure 12C). Accordingly, tumors treated with rapamycin showed a much higher extent of pS6, pAktT308/S473, and pNdrg1 inhibition than those treated with the dual inhibitor (Figure 12C). As opposed to rapamycin, PI-103 did not effectively inhibit mTORC2, as shown by persistent pAktS473 and pNdrg1 hyperactivation (Figure 12C), thus supporting the main role of mTORC2 activation in promoting SEGA development and growth and the requirement for its inhibition to achieve significant SEGA reduction (Figure 11, A–D).
Figure 12. Single mTOR inhibition by chronic rapamycin treatment effectively reduces SEGA growth.

(A and B) Chronic treatment with rapamycin and the dual PI3K-mTOR inhibitor PI-103 both resulted in impairment in the growth of pNSC-derived mouse SEGAs with respect to treatment with vehicle up to 63 days after transplantation (n = 3 replicates). Later, only rapamycin yielded sustained antitumor activity, whereas PI-103 was no longer effective. Results are expressed as the mean ± SEM. Two-group comparisons were performed with the independent-samples t test. *P < 0.05 and **P < 0.01. (C) When analyzed 71 days after transplantation, vehicle-treated tumors contained proliferating cells, which were atypical with either large eosinophilic cytoplasm or a spindle-shaped morphology with elongated hyperchromatic nuclei and foci of neoplastic necrosis. IHC showed strong and diffuse positivity for pS6, pAktT308, pAktS473, and pNDRG1 in most of the neoplastic cells. PI-103–treated tumors were characterized by moderate cellularity with features similar to those of vehicle-treated tumors. They were mainly composed of medium-sized cells with eosinophilic cytoplasm and atypical nuclei with a minor component of spindle-shaped cells, sparse mitotic figures, and only focal necrotic areas. Rapamycin-treated tumors did show strongly reduced cellularity as compared with vehicle- and dual inhibitor–treated tumors. They mostly comprised cells with large eosinophilic cytoplasm and round or oval nuclei with 1 or more prominent nucleoli. Spindle-shaped cells were rare, mitotic figures were only sporadic, and no necrotic foci were found. IHC for pS6 showed heterogeneous signal with only a few cells being faintly positive. pAktT308-IR, pAktS473-IR, and pNDRG1-IR cells were barely detected and only lightly stained. Original magnification, ×400.
Discussion
Although the lesions developing in the brains of several TSC mouse models showed some degree of similarity to those retrieved in patients, none of these mutants gave rise to well-defined SENs and full-blown SEGAs (10). The latter lesions are thought to evolve from SENs and are a frequent cause of morbidity in TSC patients, having also a significant impact on patients’ quality of life. Thus, the generation of in vivo preclinical models reproducing these 2 disease manifestations is strongly needed.
To this end, we exploited a combined deletion strategy, by which we ablated in pNSCs not only the TSC disease gene Tsc1, as previously performed by different groups (10), but also the tumor suppressor Pten. By this approach, we impaired the Pten restraining function on the PI3K/Akt cascade, thus relieving the S6K1-dependent inhibitory feedback loop impinging on Akt. Thus, we achieved the sustained hyperactivation of mTORC1 and, at the same time, of Akt in pNSCs. Interestingly, activating mutations in different components of the PI3K/Akt axis, such as PIK3CA, PI3KR, and AKT3, have been associated with a variety of developmental brain disorders (4). Accordingly, AKT hyperactivation through PTEN loss has been recently shown to promote cell cycle reentry and to delay neuronal differentiation in human neural progenitors (23). Most significantly, and quite unexpectedly, AKT hyperactivation has been previously reported in both human SENs and SEGAs (12, 13).
We set out to exploit the same gene inactivation strategy described in seminal prior publications (7, 11, 15), i.e., deleting the genes of interest in pNSCs, thus endowing mice with a longer survival than through embryonic targeting. At the same time, this strategy allows delivery of gene deletion to a small number of cells, thus ideally achieving the generation of focal abnormalities.
Notably, the lesions induced by TMX activation at relatively close-in-time postnatal stages were very different phenotypically and molecularly. One possible reason for this might lie in the different nature of the cells targeted by gene deletion at each stage. We selected different time windows of nestin-driven Cre recombination, which included distinct stages of development of the postnatal SVZ, characterized by different features and involving several types of progenitors (24). Radial glia is the prevalent glial cell population in the perinatal and early postnatal stages and expresses nestin (24). At P10, nestin-positive radial glia undergoes changes in shape and orientation, to eventually transform into adult SVZ astrocytes, whereas at P15 nestin-positive radial glial cells start to decrease in number and GFAP-IR glial cells appear, although not yet organized as glial tubes. At P24, nestin-expressing cells are very few, and glial cells consistently aggregated to form a glial meshwork homogeneously distributed in the whole SVZ area. Thus, the different phenotypes of the lesions developing at different stages might be explained by different types of pNSCs being targeted and by a different SVZ niche composition.
Another explanation that might account for the variegated features of the lesions developing at distinct phases of postnatal development is the different lifespan of mutant mice. Although TPN mice activated at P10 and P15–17 live longer than other conditional models, they still show limited survival that we associated with the onset of cerebellar neurological signs (e.g., ataxic traits and motor deficits). Indeed, nestin expression in cerebellar NSCs persists up to 4 postnatal weeks (25). Thus, gene inactivation may take place in cerebellar pNSCs, thus markedly impacting on proper cerebellar neurogenesis. Accordingly, cerebellar alterations were evident in mutant mice activated at P10, while becoming less severe in TPN mice activated at P15–17 and disappearing in mutant mice activated at P24–26, when nestin expression is almost negligible (Paola Zordan and Rossella Galli, unpublished observations). The survival of the mutant mice increased accordingly. Thus, it is plausible that the extended lifespan of mutant mice activated at P15–17 might allow the development of lesions that had the time to acquire SEGA-like features. Likewise, the normal lifespan of mutant mice activated at P24–26 may promote the “maturation” of early-stage SEGA-like lesions, such as those observed in mice activated at P15–17, into late-stage SEGA lesions with a more variegated and complex phenotype.
Notably, although the TSC neurological manifestations in patients arise during fetal developmental, postnatal targeting in mouse models is effective in promoting tissue alterations that closely reproduce the human lesions, thus making burdensome gene targeting at embryonic stages unnecessary.
Postnatal periventricular lesions have been previously described in conditional inducible mice in which Tsc1 only was ablated in nestin-expressing pNSCs (7). Those lesions, developing along the SVZ and in the intraventricular foramen, have been identified as showing both SEN and SEGA features. However, while clearly reproducing SENs, those lesions did not recapitulate SEGAs, as they did not contain either giant or multinucleated cells, did not show expansive growth, and did not present evident signs of pathological inflammation, all of which, on the contrary, were retrieved in the tissue abnormalities developing in late-postnatally activated TPN mice.
Most relevantly and for the first time to our knowledge, the structural abnormalities developing in our TPN mice highlight the requirement for Akt hyperactivation to enhance the mTORC1-dependent development of TSC neurological lesions. Here we have shown that the mechanism accounting for the sustained activation of Akt observed in TPN mice is the impairment of the negative-feedback loop driven by pS6K1 as a consequence of Pten loss. Based on this assumption, we might hypothesize that the same feedback mechanism may not be active in human SENs and SEGAs as well. Given that we did not find any mutation in PTEN or in proteins interacting with it in human SENs/SEGA, other genetic events might be responsible for the negative-feedback loop inactivity and/or for the increase in Akt signaling in human lesions, such as those recently described that lead to activation of the PI3K/AKT/mTOR pathway in distinct types of tumors (26). Indeed, here we report that the genes upregulated in human SEGAs, as described in (20), were enriched in several AKT-associated pathways.
Another interesting molecular event that emerged from our results was the hyperactivation of mTORC2, retrieved not only in TPN mouse and pNSC-derived SEGAs, but also in the corresponding human lesions. Loss of the Tsc1-Tsc2 complex is known to attenuate mTORC2 activation, independent of Rheb and of the mTORC1-dependent negative feedback on Akt (27). However, as in our mouse models, Pten loss might promote Akt signaling toward its many downstream substrates, including mTORC2. Indeed, it has been recently shown that, in a variety of tissue-specific cell lines, AktT308 may work as an upstream activator of mTORC2 by phosphorylating mSin1T86 (28, 29). Similarly, in our SEGA lesions, mTORC2 might be hyperactivated by increased AktT308 phosphorylation, together with the contribution of other molecular players. The resulting mTORC2 hyperactivation might further promote Akt signaling, giving rise to a positive-feedback loop on AktS473 (29). Alternatively, the accumulation of PtdIns(3,4,5)P3 species through Pten loss may also activate mTORC2 by releasing SIN1-PH inhibition (30). Thus, in addition to ERK hyperphosphorylation, which was previously described as restricted to human SEGAs (12, 13, 19), mTORC2 hyperactivation might also be involved in the progression of SENs into SEGAs, as suggested by the impaired tumorigenicity of SEGA pNSCs following mTORC2 inactivation by Rictor knockdown. Importantly, since the histomorphological features of SENs and SEGAs failed to show any correlation with the clinical course or disease severity, the activation status of mTORC2 might be exploited as a novel biomarker to help identify TSC patients with SENs at risk of evolution into SEGA or stratify SEGA-bearing patients.
Here we report that single mTOR inhibition by rapamycin is sufficient to reduce mouse SEGA burden. Rapalog-induced mTOR inhibition in cancer cell lines and in tumor models displaying mTOR hyperactivation is known to promote IRS-1 expression and to abrogate feedback inhibition of the pathway, resulting in prolonged Akt activation. To overcome this issue, dual inhibition of mTOR and Akt has been proposed as an alternative strategy to rapalogs in order to treat TSC-associated lesions. In model systems displaying mTOR hyperactivation by deletion of Tsc1 only, different studies described the effect of the combined inhibition of mTOR and Akt by either coadministration of rapamycin with a single Akt inhibitor (31), or delivery of a dual PI3K-mTOR inhibitor (32). The first study indicated that the combination of rapamycin (delivered, to be noted, at unusually low doses) and a single Akt inhibitor was more effective than each single agent alone in impairing the growth of Tsc1–/– Tsc2–/– fibroblast–derived grafts (31). On the contrary, the second study reported that the rapalog and the dual inhibitor had indistinguishable effects on the growth of TSC-associated mouse kidney cystadenomas and tumors (32).
In contrast, our experimental setting relies on the constitutive activation of not only mTOR but also Akt through Pten loss that makes the negative feedback on IRS-1 inactive and leads to basal Akt and mTORC2 hyperactivation. Indeed, in our study, we demonstrated persistent mTORC2 hyperactivation in both mouse brain lesions and human SEGA specimens and proved that it plays a central role in the regulation of SEGA growth. Thus, the superior efficacy of rapamycin treatment on the growth of mouse SEGAs in comparison with the dual PI3K-mTOR kinase inhibitor PI-103 as described in our study might relate to the observation that prolonged rapamycin treatment strongly impairs Akt signaling by very efficiently interfering with the assembly of mTORC2 (33). Accordingly, although PI-103 was effective in reducing both pS6 and pAkt activation in mouse SEGAs, it performed poorly in inhibiting mTORC2, as shown by the sustained activation of the mTORC2 surrogate markers pAktS473 and pNDRG1. Thus, in agreement with results from recent clinical trials (34, 35), chronic treatment with rapalogs alone seems to be sufficient for significantly reducing the burden of brain-associated TSC lesions as SEGAs.
To date, genetic and biochemical studies on TSC have been performed mostly by exploiting Tsc1- or Tsc2-null mouse embryonic fibroblasts or other standard cell lines, which, although highly proficient as in vitro model systems, do not recapitulate tissue-specific features. Very recently, neural progenitors derived from induced pluripotent stem cells have been isolated from TSC patient specimens. However, these cellular models only partially reproduce the neurological defects seen in TSC (36, 37). On the contrary, the mouse SEN and SEGA pNSCs described in our study make available a powerful and unprecedented in vitro model that uniquely mimics the cellular and molecular features of TSC brain abnormalities also upon transplantation, as demonstrated by IHC and RNA-Seq–based transcriptome profiling of pNSC-derived mouse SEGAs, and that, together with the corresponding in vivo mouse models, might be instrumental to identify lesion-specific molecular alterations and novel therapeutic vulnerabilities.
Methods
Generation of TPN mice.
To generate Tsc1c/cPtenc/c Nestin-CreERT2+ (TPN) mutant mice, mixed-background (129S4/SvJae, C57BL/6) Tsc1ccPtencc mice (both from The Jackson Laboratory) were intercrossed with Nestin-CreERT2 heterozygous mice (17). We obtained Tsc1c/wPtenc/w Nestin-CreERT2 mice in Mendelian ratios, which were then mated twice with Tsc1ccPtencc mice, in order to obtain Tsc1c/cPtenc/c Nestin-CreERT2+ mice. We used “c,” “WT,” and “–” to denote the conditional (floxed), WT, and null alleles of Tsc1/Pten mice. To monitor Cre activity, we intercrossed TPN mice with a Tomato (tdT) conditional reporter mouse line [The Jackson Laboratory; B6.Cg-Gt(ROSA)26Sortm14(CAG-tdTomato)Hze/J]. Mutant animals were genotyped by tail-derived genomic DNA PCR using the following primers: Tsc1 forward 4536, AGGAGGCCTCTTCTGCTACC; Tsc1 reverse 6548, TGGGTCCTGACCTATCTCCTA; Tsc1 reverse 4830, CAGCTCCGACCATGAAGTG; Pten forward, CAAGCACTCTGCGAACTGAG; Pten reverse, AAGTTTTTGAAGGCAAGATGC; Cre forward, TATATCTTCAGGCGCGCGGT; Cre reverse, GCAATCCCCAGAAATGCCAG; TdT forward oIMR9020 WT, AAGGGAGCTGCAGTGGAGTA; TdT reverse oIMR9021 WT, CCGAAAATCTGTGGGAAGTC; TdT forward oIMR9105 mutant, CTGTTCCTGTACGGCATGG; TdT reverse oIMR9103 mutant, GGCATTAAAGCAGCGTATCC.
For CreERT2 activation, tamoxifen (TMX; Sigma-Aldrich) was dissolved in corn oil (Sigma-Aldrich) at a final concentration of 10 mg/ml and then injected i.p. at 0.1 mg/g body weight at the different postnatal time points.
Immunostaining on frozen sections.
Brains from adult mice were fixed for 24 hours in 4% paraformaldehyde (PFA) at 4°C, dehydrated with 30% sucrose, and then frozen in OCT compound. Ten-micrometer-thick frozen sections were washed with PBS, fixed with 4% PFA for 10 minutes, and incubated with 0.1% Triton/1% BSA/PBS for 30 minutes. Nonspecific sites were blocked with the blocking solution 1% BSA/10% Normal Goat Serum/PBS for at least 30 minutes. Sections were incubated overnight with primary antibodies and revealed with Alexa Fluor secondary antibodies (Supplemental Table 8). Sections were counterstained with DAPI. Images were acquired by a Nikon camera mounted on a Nikon microscope using CellF imaging software (Soft Imaging System GmbH).
Immunostaining on paraffin-embedded sections.
From paraffin-embedded mouse brains and human samples, 2-μm-thick paraffin sections were obtained, deparaffinized, rehydrated, treated for antigen retrieval, and incubated in 10% serum blocking solution before incubation with primary antibodies at room temperature for 1 hour or at 4°C for 18 hours (Supplemental Table 8).
Biotin-conjugated secondary antibodies (Vector Laboratories) were used for Vectastain Elite ABC development and Dako EnVision+Dual Link System Peroxidase (Dako Cytomation). Images were acquired through an Olympus DP70 camera mounted on an Olympus Bx60 microscope using CellF imaging software (Soft Imaging System GmbH).
Isolation and characterization of pNSCs from control and mutant TPN mice.
pNSC cultures were established by neurosphere assay (NSA) (38) under mildly hypoxic (5% O2) culture conditions from the SVZ of adult control and mutant P10 and P15–17 TPN mice. Tissues from single animals were dissociated by trituration after enzymatic digestion in a papain-containing mixture and used to establish single neurosphere cultures. Cells were cultured in NSA medium, i.e., DMEM/F12 supplemented with EGF (20 ng/ml) and FGF2 (10 ng/ml) (PeproTech) (39). Neurospheres were collected every 3–5 days and, after dissociation, seeded under the same culture conditions. The total number of viable cells was assessed at each passage by trypan blue (Sigma-Aldrich) exclusion.
To evaluate multipotency and differentiation potential, pNSCs were seeded at a density of 3 × 10⁴ cells/cm2 on Matrigel-coated glass coverslips in 24-well plates. Cells were then cultured sequentially in different media to promote, respectively, the selection, expansion, and differentiation of pNSCs. Briefly, pNSCs were cultured for 48 hours in proliferation medium containing both EGF and FGF2 to select for undifferentiated progenitors, followed by 3 days of culture in the same medium containing only FGF2, in order to promote the expansion of lineage-restricted precursors. Then, to promote terminal differentiation, cells were cultured in mitogen-free medium containing 2% FBS for an additional 5 days. Cells were fixed with 4% PFA for 10 minutes after 48 hours and at the end of differentiation and then processed for the detection of lineage antigens.
Immunofluorescence on pNSCs.
Cells were incubated with 0.1% Triton/1% BSA/PBS for 30 minutes. Nonspecific sites were blocked with blocking solution 1% BSA/10% Normal Goat Serum/PBS for at least 30 minutes. Coverslips were incubated overnight with primary antibodies and revealed with Alexa Fluor secondary antibodies (Supplemental Table 8). Images were acquired by a Nikon camera (DS-Ri2) mounted on a Nikon microscope (Eclipse E600) using CellF imaging software (NIS-Elements F 4.30.01 64-bit).
Western blotting.
Each frozen tissue/cell pellet was homogenized in 10× volume of RIPA lysis buffer (10 mM Tris-Cl pH 7.2, 150 mM NaCl, 1 mM EDTA pH 8) with 1% Triton X-10/0.1% deoxycholate, 0.1% SDS, and protease and phosphatase inhibitor mixture (Roche). Samples were then diluted in Laemmli’s SDS sample buffer. Proteins were separated by electrophoresis on 10% polyacrylamide gels according to the TGX Stain-Free FastCast Acrylamide kit protocol (Bio-Rad), and transferred onto Trans-Blot nitrocellulose membranes (Bio-Rad) according to the Trans-Blot Turbo Transfer System kit protocol (Bio-Rad). Ponceau staining (Sigma-Aldrich) was performed to confirm that the samples were loaded equally. The membranes were blocked in 5% nonfat dry milk in TBS-T (pH 7.4, with 0.1% Tween-20) for 1 hour at room temperature. Primary antibodies were diluted in 3% BSA (Sigma-Aldrich) in TBS-T, and the membranes were incubated overnight at 4°C (Supplemental Table 8). The primary antibody was removed, and the blots were washed in TBS-T and then incubated for 1 hour at room temperature in HRP-conjugated secondary antibodies (Amersham). Reactive proteins were visualized using a Clarity Western ECL substrate kit (Bio-Rad), and exposure was performed using UVItec (Cambridge MINI HD). Images were acquired by NineAlliance software.
Treatment of autochthonous mouse SENs and SEGAs with rapamycin.
For in vivo administration, rapamycin (LC Laboratories) was dissolved in 100% ethanol, stored at –20°C, and diluted in a vehicle solution containing 5% Tween-80, 5% PEG 400 (Sigma-Aldrich) immediately before injection. Mice were injected i.p. with either 6 mg/kg of drug or vehicle every 2 days. For in vitro treatment, rapamycin was dissolved in DMSO and used at a final concentration of 100 nM in medium.
Evaluation of tumorigenicity.
For s.c. injection, 3 × 10⁶ SEN and SEGA pNSCs, subcultured in vitro for 30–37 passages, were transferred in 200 μl of PBS and injected into the right flank of 45- to 60-day-old nu/nu female mice. Mice were sacrificed at different time points between 4 and 12 weeks after injection, according to the pNSC line originally injected.
Quantitative PCR analysis.
Total RNA was extracted using the RNeasy Mini Kit (Qiagen). One microgram of total RNA was reverse-transcribed using first-strand synthesis kit Superscript III RNaseH Reverse Transcriptase (Invitrogen) and oligo-dT primers. Quantitative real-time PCR was carried out by IQ SybrGreen technology (Bio-Rad) following the manufacturer’s instructions. β-Actin was used as housekeeping gene. The sequences of mouse-specific Gpnmb primers were: forward, CGCCTCCACCTTCAACTC; reverse, CAATTGTGATGGTGGCTCTG.
RNA sequencing.
RNA from mouse SEGAs and WT NSCs was extracted using the RNeasy Mini Kit (Qiagen) according to the manufacturer’s protocol. The cDNA was synthesized starting from total RNA by QuantSeq 3′ mRNA-Seq Library Prep Kits (Lexogen). After barcoding, the RNA libraries were pooled, denatured, and diluted to 2.4 pM final concentration. RNA-Seq was performed using NextSeq 550 (Illumina) set for 76 cycles in single end (SE), yielding an average of 15 × 106 clusters for each sample. Sequences were aligned using STAR (version 2.5.3a) on the reference genome GRCm38; association between reads and genes was performed by feature counts, using GENCODE (version M13) basic annotation as reference. Analysis of count data was performed using the DESeq2 (differential gene expression analysis based on the negative binomial distribution) pipeline (version 1.0.19). The independent filtering of genes with low counts was set to a mean of 9 raw counts between all samples. The cutoff imposed for differential gene expression was the one suggested by the Sequencing Quality Control Consortium, which defines a gene as differentially expressed when it has an associated FDR value lower than 0.1 (Padj < 0.1, Benjamini and Hochberg correction) and, at the same time, the absolute value of its log2 fold change is greater than 1 (log2 FC >1 or log2 FC <–1). RNA-Seq data are available at the NCBI’s Gene Expression Omnibus (GEO) database (GEO GSE109321).
Bioinformatics analysis.
Differentially expressed gene lists were analyzed using preranked gene set enrichment analysis (GSEA) (40). Genes were preranked using the log2 fold change of the expression values between mouse SEGAs and control samples. The human SEGA gene set included in the GSEA was obtained from ref. 20. Pathway enrichment analysis was performed by Enrichr (http://amp.pharm.mssm.edu/Enrichr/).
Gene silencing.
Rictor silencing was performed by exploiting commercially available lentiviral vectors coding for gene-specific shRNA clones (Mission RNAi, Sigma-Aldrich). Infection of pNSC was performed according to the manufacturer’s instructions.
Treatment of subcutaneous mouse SEGAs with rapamycin and dual inhibitor.
For s.c. injection, 3 × 10⁶ SEGA pNSCs (L1) were injected into the right flank of 45- to 60-day-old nu/nu female mice (n = 3; 1 control mouse of the original 4 was excluded from the study because its volume value was a statistical outlier, i.e., greater than 2 SDs from the mean). When tumors reached 10–20 mm3 in volume, mice were treated for 5 days a week with vehicle or each of the 2 inhibitors. Rapamycin was prepared and delivered as outlined above; PI-103 (Selleck Laboratories) was dissolved in 100% DMSO, stored at –20°C, and diluted in a vehicle solution containing 50% DMSO at a final concentration of 5 mg/kg immediately before i.p. injection. Mice were sacrificed 71 days after transplantation and tumors processed for IHC.
Statistics.
For animal experiments, n represents the number of animals generated, treated, and analyzed. For experiments involving in vitro NSC cultures, n represents the number of single mouse-derived NSC lines. For experiments involving transplanted NSC lines, n represents the number of individual animals that were transplanted with a single NSC line.
Results for continuous variables were expressed as mean ± SEM. Two-group comparisons were performed with the independent-samples 1-tailed Student’s t test. P values of less than 0.05 were considered statistically significant.
Study approval.
The retrospective study on human SEN and SEGA samples (n = 3 and n = 15, respectively) was conducted in compliance with the Declaration of Helsinki and with policies approved by the Ethics Board of Spedali Civili di Brescia, University of Brescia. Specifically, for the retrospective and exclusively observational study on archival material obtained for diagnostic purposes, patient consent was not needed (Delibera del Garante n. 52 del 24/7/2008 and DL 193/2003).
All animal experiments were approved by and performed in accordance with the guidelines of the International Animal Care and Use Committee.
Author contributions
PZ designed and performed experiments, acquired and analyzed data, prepared the figures, and wrote the manuscript. FC and ET performed experiments. MC performed experiments and acquired and analyzed data. PLP analyzed data. RG conceived and supervised the project, designed experiments, and wrote the manuscript.
Supplementary Material
Acknowledgments
We thank Giulia Scotti and Ivan Molineris at the Centre for Translational Genomics and Bioinformatics, Ospedale San Raffaele, for RNA-Seq data processing, GSEA, and meta-analysis. This work was supported by Associazione Sclerosi Tuberosa (to RG) and by Telethon (grant GGP13022 to RG and PLP).
Version 1. 02/01/2018
In-Press Preview
Version 2. 03/12/2018
Electronic publication
Version 3. 04/02/2018
Print issue publication
Funding Statement
Funded to R.G. and P. L. P
Funded to R. G.
Footnotes
Conflict of interest: The authors have declared that no conflict of interest exists.
Reference information: J Clin Invest. 2018;128(4):1688–1706.https://doi.org/10.1172/JCI96342.
Contributor Information
Paola Zordan, Email: zordan.paola@hsr.it.
Manuela Cominelli, Email: elemanu2003@libero.it.
Federica Cascino, Email: CASCINO.F@hotmail.it.
Elisa Tratta, Email: elisa.tratta@libero.it.
Pietro L. Poliani, Email: luigi.poliani@unibs.it.
Rossella Galli, Email: galli.rossella@hsr.it.
References
- 1.Caban C, Khan N, Hasbani DM, Crino PB. Genetics of tuberous sclerosis complex: implications for clinical practice. Appl Clin Genet. 2017;10:1–8. doi: 10.2147/TACG.S90262. [DOI] [PMC free article] [PubMed] [Google Scholar]
- 2.Curatolo P, Bombardieri R, Jozwiak S. Tuberous sclerosis. Lancet. 2008;372(9639):657–668. doi: 10.1016/S0140-6736(08)61279-9. [DOI] [PubMed] [Google Scholar]
- 3.Crino PB. mTOR: a pathogenic signaling pathway in developmental brain malformations. Trends Mol Med. 2011;17(12):734–742. doi: 10.1016/j.molmed.2011.07.008. [DOI] [PubMed] [Google Scholar]
- 4.Crino PB. The mTOR signalling cascade: paving new roads to cure neurological disease. Nat Rev Neurol. 2016;12(7):379–392. doi: 10.1038/nrneurol.2016.81. [DOI] [PubMed] [Google Scholar]
- 5.Way SW, McKenna J, Mietzsch U, Reith RM, Wu HC, Gambello MJ. Loss of Tsc2 in radial glia models the brain pathology of tuberous sclerosis complex in the mouse. Hum Mol Genet. 2009;18(7):1252–1265. doi: 10.1093/hmg/ddp025. [DOI] [PMC free article] [PubMed] [Google Scholar]
- 6.Magri L, et al. Sustained activation of mTOR pathway in embryonic neural stem cells leads to development of tuberous sclerosis complex-associated lesions. Cell Stem Cell. 2011;9(5):447–462. doi: 10.1016/j.stem.2011.09.008. [DOI] [PubMed] [Google Scholar]
- 7.Zhou J, et al. Tsc1 mutant neural stem/progenitor cells exhibit migration deficits and give rise to subependymal lesions in the lateral ventricle. Genes Dev. 2011;25(15):1595–1600. doi: 10.1101/gad.16750211. [DOI] [PMC free article] [PubMed] [Google Scholar]
- 8.Carson RP, Van Nielen DL, Winzenburger PA, Ess KC. Neuronal and glia abnormalities in Tsc1-deficient forebrain and partial rescue by rapamycin. Neurobiol Dis. 2012;45(1):369–380. doi: 10.1016/j.nbd.2011.08.024. [DOI] [PMC free article] [PubMed] [Google Scholar]
- 9.Magri L, et al. Timing of mTOR activation affects tuberous sclerosis complex neuropathology in mouse models. Dis Model Mech. 2013;6(5):1185–1197. doi: 10.1242/dmm.012096. [DOI] [PMC free article] [PubMed] [Google Scholar]
- 10.Magri L, Galli R. mTOR signaling in neural stem cells: from basic biology to disease. Cell Mol Life Sci. 2013;70(16):2887–2898. doi: 10.1007/s00018-012-1196-x. [DOI] [PMC free article] [PubMed] [Google Scholar]
- 11.Feliciano DM, Quon JL, Su T, Taylor MM, Bordey A. Postnatal neurogenesis generates heterotopias, olfactory micronodules and cortical infiltration following single-cell Tsc1 deletion. Hum Mol Genet. 2012;21(4):799–810. doi: 10.1093/hmg/ddr511. [DOI] [PMC free article] [PubMed] [Google Scholar]
- 12.Jozwiak J, et al. Brain tumor formation in tuberous sclerosis depends on Erk activation. Neuromolecular Med. 2007;9(2):117–127. doi: 10.1007/BF02685886. [DOI] [PubMed] [Google Scholar]
- 13.Siedlecka M, Szlufik S, Grajkowska W, Roszkowski M, Jóźwiak J. Erk activation as a possible mechanism of transformation of subependymal nodule into subependymal giant cell astrocytoma. Folia Neuropathol. 2015;53(1):8–14. doi: 10.5114/fn.2015.49969. [DOI] [PubMed] [Google Scholar]
- 14.Manning BD, Logsdon MN, Lipovsky AI, Abbott D, Kwiatkowski DJ, Cantley LC. Feedback inhibition of Akt signaling limits the growth of tumors lacking Tsc2. Genes Dev. 2005;19(15):1773–1778. doi: 10.1101/gad.1314605. [DOI] [PMC free article] [PubMed] [Google Scholar]
- 15.Zhu G, et al. Pten deletion causes mTorc1-dependent ectopic neuroblast differentiation without causing uniform migration defects. Development. 2012;139(18):3422–3431. doi: 10.1242/dev.083154. [DOI] [PMC free article] [PubMed] [Google Scholar]
- 16.Lim DA, Alvarez-Buylla A. The adult ventricular-subventricular zone (V-SVZ) and olfactory bulb (OB) neurogenesis. Cold Spring Harb Perspect Biol. 2016;8(5):a018820. doi: 10.1101/cshperspect.a018820. [DOI] [PMC free article] [PubMed] [Google Scholar]
- 17.Imayoshi I, Ohtsuka T, Metzger D, Chambon P, Kageyama R. Temporal regulation of Cre recombinase activity in neural stem cells. Genesis. 2006;44(5):233–238. doi: 10.1002/dvg.20212. [DOI] [PubMed] [Google Scholar]
- 18.Zhu G, et al. PTEN signaling in the postnatal perivascular progenitor niche drives medulloblastoma formation. Cancer Res. 2017;77(1):123–133. doi: 10.1158/0008-5472.CAN-16-1991. [DOI] [PMC free article] [PubMed] [Google Scholar]
- 19.Tyburczy ME, et al. Novel proteins regulated by mTOR in subependymal giant cell astrocytomas of patients with tuberous sclerosis complex and new therapeutic implications. Am J Pathol. 2010;176(4):1878–1890. doi: 10.2353/ajpath.2010.090950. [DOI] [PMC free article] [PubMed] [Google Scholar]
- 20.Martin KR, et al. The genomic landscape of tuberous sclerosis complex. Nat Commun. 2017;8:15816. doi: 10.1038/ncomms15816. [DOI] [PMC free article] [PubMed] [Google Scholar]
- 21.Malaney P, Pathak RR, Xue B, Uversky VN, Davé V. Intrinsic disorder in PTEN and its interactome confers structural plasticity and functional versatility. Sci Rep. 2013;3:2035. doi: 10.1038/srep02035. [DOI] [PMC free article] [PubMed] [Google Scholar]
- 22.Fan QW, et al. A dual PI3 kinase/mTOR inhibitor reveals emergent efficacy in glioma. Cancer Cell. 2006;9(5):341–349. doi: 10.1016/j.ccr.2006.03.029. [DOI] [PMC free article] [PubMed] [Google Scholar]
- 23.Li Y, et al. Induction of expansion and folding in human cerebral organoids. Cell Stem Cell. 2017;20(3):385–396.e3. doi: 10.1016/j.stem.2016.11.017. [DOI] [PMC free article] [PubMed] [Google Scholar]
- 24.Peretto P, Giachino C, Aimar P, Fasolo A, Bonfanti L. Chain formation and glial tube assembly in the shift from neonatal to adult subventricular zone of the rodent forebrain. J Comp Neurol. 2005;487(4):407–427. doi: 10.1002/cne.20576. [DOI] [PubMed] [Google Scholar]
- 25.Chen J, Kwon CH, Lin L, Li Y, Parada LF. Inducible site-specific recombination in neural stem/progenitor cells. Genesis. 2009;47(2):122–131. doi: 10.1002/dvg.20465. [DOI] [PMC free article] [PubMed] [Google Scholar]
- 26.Zhang Y, et al. A pan-cancer proteogenomic atlas of PI3K/AKT/mTOR pathway alterations. Cancer Cell. 2017;31(6):820–832.e3. doi: 10.1016/j.ccell.2017.04.013. [DOI] [PMC free article] [PubMed] [Google Scholar]
- 27.Huang J, Dibble CC, Matsuzaki M, Manning BD. The TSC1-TSC2 complex is required for proper activation of mTOR complex 2. Mol Cell Biol. 2008;28(12):4104–4115. doi: 10.1128/MCB.00289-08. [DOI] [PMC free article] [PubMed] [Google Scholar]
- 28.Humphrey SJ, et al. Dynamic adipocyte phosphoproteome reveals that Akt directly regulates mTORC2. Cell Metab. 2013;17(6):1009–1020. doi: 10.1016/j.cmet.2013.04.010. [DOI] [PMC free article] [PubMed] [Google Scholar]
- 29.Yang G, Murashige DS, Humphrey SJ, James DE. A positive feedback loop between Akt and mTORC2 via SIN1 phosphorylation. Cell Rep. 2015;12(6):937–943. doi: 10.1016/j.celrep.2015.07.016. [DOI] [PubMed] [Google Scholar]
- 30.Liu P, et al. PtdIns(3,4,5)P3-dependent activation of the mTORC2 kinase complex. Cancer Discov. 2015;5(11):1194–1209. doi: 10.1158/2159-8290.CD-15-0460. [DOI] [PMC free article] [PubMed] [Google Scholar]
- 31.Ji S, et al. Combined targeting of mTOR and Akt using rapamycin and MK-2206 in the treatment of tuberous sclerosis complex. J Cancer. 2017;8(4):555–562. doi: 10.7150/jca.17205. [DOI] [PMC free article] [PubMed] [Google Scholar]
- 32.Pollizzi K, Malinowska-Kolodziej I, Stumm M, Lane H, Kwiatkowski D. Equivalent benefit of mTORC1 blockade and combined PI3K-mTOR blockade in a mouse model of tuberous sclerosis. Mol Cancer. 2009;8:38. doi: 10.1186/1476-4598-8-38. [DOI] [PMC free article] [PubMed] [Google Scholar]
- 33.Sarbassov DD, et al. Prolonged rapamycin treatment inhibits mTORC2 assembly and Akt/PKB. Mol Cell. 2006;22(2):159–168. doi: 10.1016/j.molcel.2006.03.029. [DOI] [PubMed] [Google Scholar]
- 34.Franz DN, et al. Everolimus for subependymal giant cell astrocytoma: 5-year final analysis. Ann Neurol. 2015;78(6):929–938. doi: 10.1002/ana.24523. [DOI] [PMC free article] [PubMed] [Google Scholar]
- 35.Trelinska J, et al. Maintenance therapy with everolimus for subependymal giant cell astrocytoma in patients with tuberous sclerosis (the EMINENTS study) Pediatr Blood Cancer. 2017;64(6):e26347. doi: 10.1002/pbc.26347. [DOI] [PubMed] [Google Scholar]
- 36.Costa V, et al. mTORC1 inhibition corrects neurodevelopmental and synaptic alterations in a human stem cell model of tuberous sclerosis. Cell Rep. 2016;15(1):86–95. doi: 10.1016/j.celrep.2016.02.090. [DOI] [PubMed] [Google Scholar]
- 37.Li Y, et al. Abnormal neural progenitor cells differentiated from induced pluripotent stem cells partially mimicked development of TSC2 neurological abnormalities. Stem Cell Reports. 2017;8(4):883–893. doi: 10.1016/j.stemcr.2017.02.020. [DOI] [PMC free article] [PubMed] [Google Scholar]
- 38.Reynolds BA, Rietze RL. Neural stem cells and neurospheres — re-evaluating the relationship. Nat Methods. 2005;2(5):333–336. doi: 10.1038/nmeth758. [DOI] [PubMed] [Google Scholar]
- 39.Gritti A, et al. Multipotential stem cells from the adult mouse brain proliferate and self-renew in response to basic fibroblast growth factor. J Neurosci. 1996;16(3):1091–1100. doi: 10.1523/JNEUROSCI.16-03-01091.1996. [DOI] [PMC free article] [PubMed] [Google Scholar]
- 40.Subramanian A, et al. Gene set enrichment analysis: a knowledge-based approach for interpreting genome-wide expression profiles. Proc Natl Acad Sci U S A. 2005;102(43):15545–15550. doi: 10.1073/pnas.0506580102. [DOI] [PMC free article] [PubMed] [Google Scholar]
Associated Data
This section collects any data citations, data availability statements, or supplementary materials included in this article.