Abstract
Lupus nephritis (LN) often results in progressive renal dysfunction. The inactive rhomboid 2 (iRhom2) is a newly identified key regulator of A disintegrin and metalloprotease 17 (ADAM17), whose substrates, such as TNF-α and heparin-binding EGF (HB-EGF), have been implicated in the pathogenesis of chronic kidney diseases. Here, we demonstrate that deficiency of iRhom2 protects the lupus-prone Fcgr2b–/– mice from developing severe kidney damage without altering anti-double-stranded DNA (anti-dsDNA) Ab production by simultaneously blocking HB-EGF/EGFR and TNF-α signaling in the kidney tissues. Unbiased transcriptome profiling of kidneys and kidney macrophages revealed that TNF-α and HB-EGF/EGFR signaling pathways are highly upregulated in Fcgr2b–/– mice, alterations that were diminished in the absence of iRhom2. Pharmacological blockade of either TNF-α or EGFR signaling protected Fcgr2b–/– mice from severe renal damage. Finally, kidneys from LN patients showed increased iRhom2 and HB-EGF expression, with interstitial HB-EGF expression significantly associated with chronicity indices. Our data suggest that activation of iRhom2/ADAM17-dependent TNF-α and EGFR signaling plays a crucial role in mediating irreversible kidney damage in LN, thereby uncovering a target for selective and simultaneous dual inhibition of 2 major pathological pathways in the effector arm of the disease.
Keywords: Autoimmunity, Inflammation
Keywords: Lupus, Mouse models
Introduction
Systemic lupus erythematosus (SLE) is a prototypic autoimmune disease that can affect multiple organs. Production of autoreactive Abs triggers formation of immune complexes (IC), which are widely deposited and lead to organ dysfunction. Renal involvement in SLE is known as lupus nephritis (LN). LN affects 40%–60% of adult SLE patients (1) and is characterized by Ab and complement deposition in the kidneys (2, 3). IC deposition initiates recruitment and activation of neutrophils and monocytes that produce inflammatory mediators to amplify injury, often resulting in irreversible loss of renal function, i.e., end-stage fibrosis (4–6).
Evidence has accumulated supporting a role of the cell-surface metalloprotease A disintegrin and metalloprotease 17 (ADAM17), a principal sheddase for release of a variety of membrane-anchored substrates, including TNF-α and EGFR ligands (7, 8) in SLE. Peripheral blood mononuclear cells (PBMCs) of SLE patients show increased Adam17 expression (9). Soluble shedding substrates of ADAM17 have been found in the plasma and urine of lupus mice and SLE patients, and some of these soluble factors are elevated prior to flare (10–12). Among these, 2 major ADAM17 substrates, TNF-α and heparin-binding EGF (HB-EGF) (7, 8), have been separately implicated as important mediators of kidney damage in lupus (13, 14).
Although blocking ADAM17 could simultaneously shut down multiple pathogenic pathways and has been proposed for treating chronic kidney diseases not related to LN (15–17), there are substantial concerns about therapeutically targeting ADAM17, mainly because ADAM17 has an essential role in protecting the skin and intestinal barrier through activating the EGFR pathway (18, 19). Indeed, mice lacking Adam17 die at birth due to defects in EGFR signaling, and individuals with ADAM17 mutation or those treated with EGFR inhibitors display skin and intestinal inflammation (20–22).
Recently, 2 essential regulators of ADAM17 were discovered, the inactive rhomboids inactive rhomboid 1 (iRhom1) and iRhom2 (23–27), each of which, in the absence of the other, can support ADAM17-dependent protection of the skin and intestinal barrier. In leukocytes, iRhom2 (gene name Rhbdf2) controls the function of ADAM17, as expression of iRhom1 is minimal (23, 24, 26, 28). Mice lacking iRhom2 have normal development and are protected from TNF-α–dependent septic shock and rheumatoid arthritis, similarly to mice lacking Adam17 in myeloid cells, underscoring its importance as a regulator of inflammation (21, 26, 28). In addition, iRhom2 regulates the substrate selectivity of ADAM17, even in cells that contain both iRhom1 and iRhom2 (25). Specifically, iRhom2 is required for the stimulated release of several EGFR ligands, including HB-EGF and amphiregulin, but not TGF-α, which is crucial for skin and intestinal barrier protection (25). These unique properties of iRhom2 raised the intriguing possibility that targeting iRhom2 would provide an advantage over targeting ADAM17 and allow simultaneous inactivation of multiple pathways, including TNF-α and EGFR signaling in the effector cells involved in LN. However, the translational relevance of this attractive concept has never been tested directly in vivo.
The inhibitory Fc γ receptor IIB (Fcgr2b) is essential for maintaining tolerance, and its polymorphism is associated with lupus (29). Fcgr2b-deficient mice spontaneously develop lupus-like syndromes, including production of anti–double-stranded DNA (anti-dsDNA) Abs and fatal LN (30, 31). To study the role of iRhom2 in the development of LN, we crossed Rhbdf2–/– mice with Fcgr2b–/– mice. We found that iRhom2 deficiency protected Fcgr2b–/– mice from severe kidney damage with attenuated TNF and EGFR signaling in the kidneys. Our data demonstrate that activation of the iRhom2/ADAM17 pathway, most likely via cleavage of TNF-α and the EGFR ligand HB-EGF, plays a critical role in mediating tissue inflammation and damage in LN.
Results
iRhom2 deficiency protects Fcgr2b–/– mice from severe kidney damage.
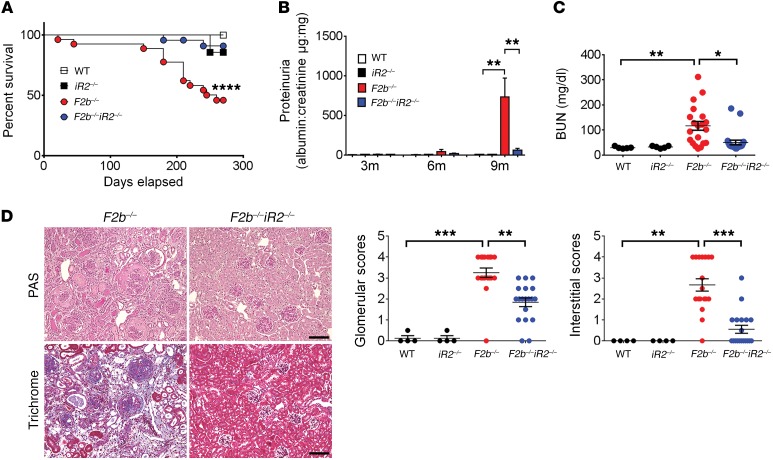
To explore the role of iRhom2 in LN, we studied lupus-prone Fcgr2b–/– mice on a B6 background, which have 80% penetrance of nephritis and 50%–60% mortality by 8 to 9 months of age (30, 31). Inactivation of iRhom2 in Fcgr2b–/– mice (Fcgr2b–/–Rhbdf2–/– mice) prevented disease-related mortality, severe proteinuria, and elevated blood urea nitrogen (BUN) in Fcgr2b–/– mice at 7 to 9 months of age (Figure 1, A–C).
Figure 1. iRhom2 deficiency protected Fcgr2b–/– mice from severe kidney injury.
Female Fcgr2b–/– (F2b–/–) mice crossed with Rhbdf2–/– (iR2–/–) mice were assessed for survival and kidney injury. Survival (A), proteinuria (B), and BUN (C) were measured. For survival and proteinuria, n = 15 WT, n = 7 Rhbdf2–/–, n = 27 Fcgr2b–/–, and n = 24 Fcgr2b–/–Rhbf2–/– mice. For BUN, n = 5 WT, n = 5 Rhbdf2–/–, n = 20 Fcgr2b–/–, and n = 21 Fcgr2b–/–Rhbdf2–/– mice. For survival, the log-rank (Mantel-Cox) test was used. (D) Histological analysis of kidneys by PAS and Masson trichrome staining. Scale bars: 50 μm. Pathological scores for glomerular and tubular-interstitial areas. n = 4 WT, n = 4 Rhbdf2–/–, n = 20 Fcgr2b–/–, and n = 21 Fcgr2b–/–Rhbdf2–/– mice. (B–D) Data are shown as mean ± SEM. *P < 0.05; **P < 0.01; ***P < 0.001; ****P < 0.0001, 1-way ANOVA with Dunnett’s multiple comparisons test.
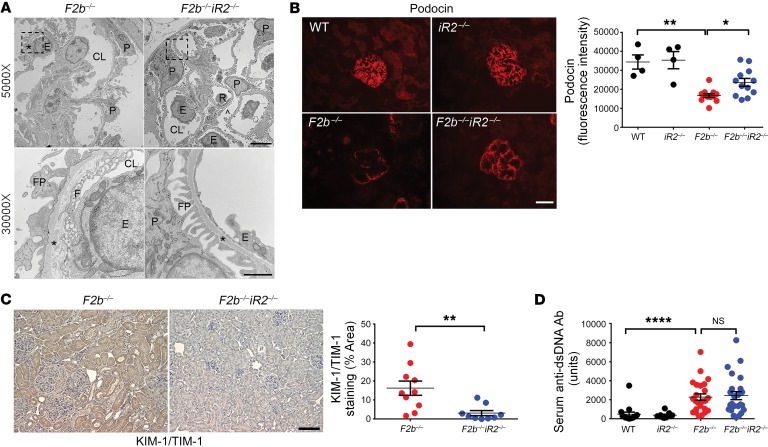
Histological analysis of Fcgr2b–/– kidneys revealed glomerular and tubulo-interstitial injury characteristic of LN, including glomerular hypercellularity and crescents as well as interstitial inflammation and fibrosis. These were markedly attenuated in the absence of iRhom2 (Figure 1D). Transmission electron microscopy demonstrated loss of glomerular filtration barrier integrity with damaged podocyte foot processes, fenestra, and glomerular basement membranes in Fcgr2b–/– kidneys, whereas Fcgr2b–/–Rhbdf2–/– mice were protected from these defects (Figure 2A). Inactivation of iRhom2 also prevented downregulation of podocin, an indicator of podocyte damage and loss (Figure 2B), and upregulation of kidney injury molecule-1 (KIM-1)/T cell Ig and mucin domain-1 (TIM-1), a marker for glomerular and tubular injury, in Fcgr2b–/– kidneys (Figure 2C). Interestingly, absence of iRhom2 did not alter serum levels of anti-dsDNA Abs (Figure 2D).
Figure 2. iRhom2 deficiency rescued renal damage in Fcgr2b–/– mice without altering anti-dsDNA Ab levels.
(A) Transcription electron microscopy analysis of kidney cortex. Photographs shown represent 2 mice in each group with similar results. CL, capillary lumen; E, endothelial cell; F, fenestrae; FP, foot processes; P, podocyte; R, red blood cells. Asterisks show glomerular basement membrane. Scale bars: 5 μm (top panels; original magnification, ×5,000); 1 μm (bottom panels; original magnification, ×30,000). (B) Immunofluorescence staining of podocin in the kidney glomeruli. Scale bar: 25 μm. n = 4 WT, n = 4 Rhbdf2–/–, n = 12 Fcgr2b–/–, n = 12 Fcgr2b–/–Rhbdf2–/– mice. (C) IHC staining of KIM-1/TIM-1 (brown) in the kidneys. Scale bar: 50 μm. n = 10 Fcgr2b–/–, n = 9 Fcgr2b–/–Rhbdf2–/– mice. (D) Serum anti-dsDNA Abs in 7- to 9-month-old mice. n = 13 WT, n = 7 Rhbdf2–/–, n = 24 Fcgr2b–/–, n = 24 Fcgr2b–/–Rhbdf2–/– mice. Data are shown as mean ± SEM. *P < 0.05; **P < 0.01; ****P < 0.0001, 1-way ANOVA with Dunnett’s multiple comparisons test (B and D), 2-tailed unpaired Student’s t test (C).
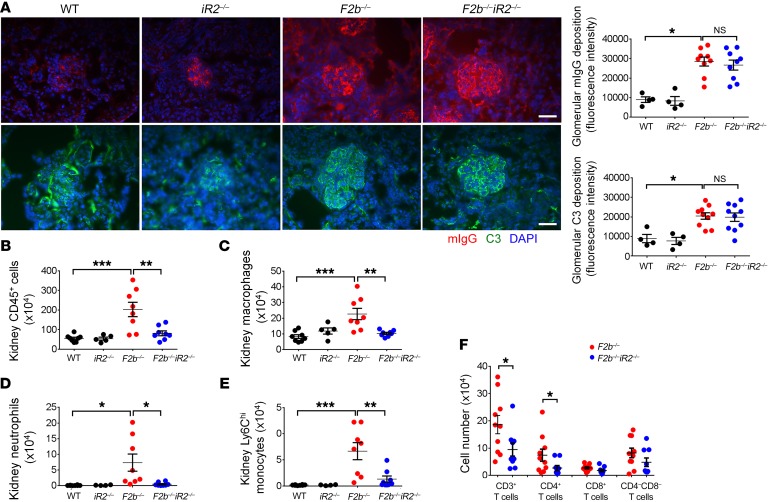
In the kidneys of Fcgr2b–/– mice, the extent of IC deposition (staining for mouse IgG) and complement C3 was not altered by absence of iRhom2 (Figure 3A). However, flow cytometry revealed a marked increase in CD45+ leukocytes in Fcgr2b–/– kidneys, including macrophages, neutrophils, monocytes, and CD4+ T cells, as compared with WT (Fcgr2b+/+Rhbdf2+/+) or Rhbdf2–/– kidneys. Notably, inflammatory cell infiltration was significantly decreased in Fcgr2b–/–Rhbdf2–/– mice (Figure 3, B–F, gating strategy in Supplemental Figure 1, A and B; supplemental material available online with this article; https://doi.org/10.1172/JCI97650DS1). In contrast, expansion of immune cells in the spleen of Fcgr2b–/–mice was not affected by lack of iRhom2 (Supplemental Figure 2).
Figure 3. Deficiency of iRhom2 attenuated inflammatory cell infiltration without affecting renal deposition of IC and C3 in the kidneys of Fcgr2b–/– mice.
(A) Kidneys were stained for mIgG and C3 by immunofluorescence. Photographs shown represent kidneys from n = 4 WT, n = 4 Rhbdf2–/–, n = 10 Fcgr2b–/–, and n = 10 Fcgr2b–/–Rhbdf2–/– mice. Scale bar: 25 μm. (B–F) Inflammatory cell infiltrates were analyzed by flow cytometry in mouse kidneys. Cell numbers of CD45+ leukocytes (B), macrophages (C), neutrophils (D), Ly6Chi monocytes, (E) and T cell subsets (F) are illustrated. Numbers shown are cells per kidney. (B–E) n = 8 WT, n = 5 Rhbdf2–/–, 8 Fcgr2b–/–, n = 8 Fcgr2b–/–Rhbdf2–/– mice. (F) n = 10 Fcgr2b–/–, n = 9 Fcgr2b–/–Rhbd2–/– mice. Data are shown as mean ± SEM. *P < 0.05; **P < 0.01; ***P < 0.001; ****P < 0.0001, 1-way ANOVA with Dunnett’s multiple comparisons test (A–E), 2-tailed unpaired Student’s t test (F).
Collectively, these findings suggest that inactivation of iRhom2 in Fcgr2b–/– mice does not affect characteristic features of autoimmunity in SLE, such as anti-dsDNA Abs and splenic immune cell expansion, but rather provides protection by blunting responses downstream of IC deposition and blocking infiltration of inflammatory cells that cause renal damage.
iRhom2 deficiency limits inflammation and tissue-remodeling pathways in Fcgr2b–/–kidneys.
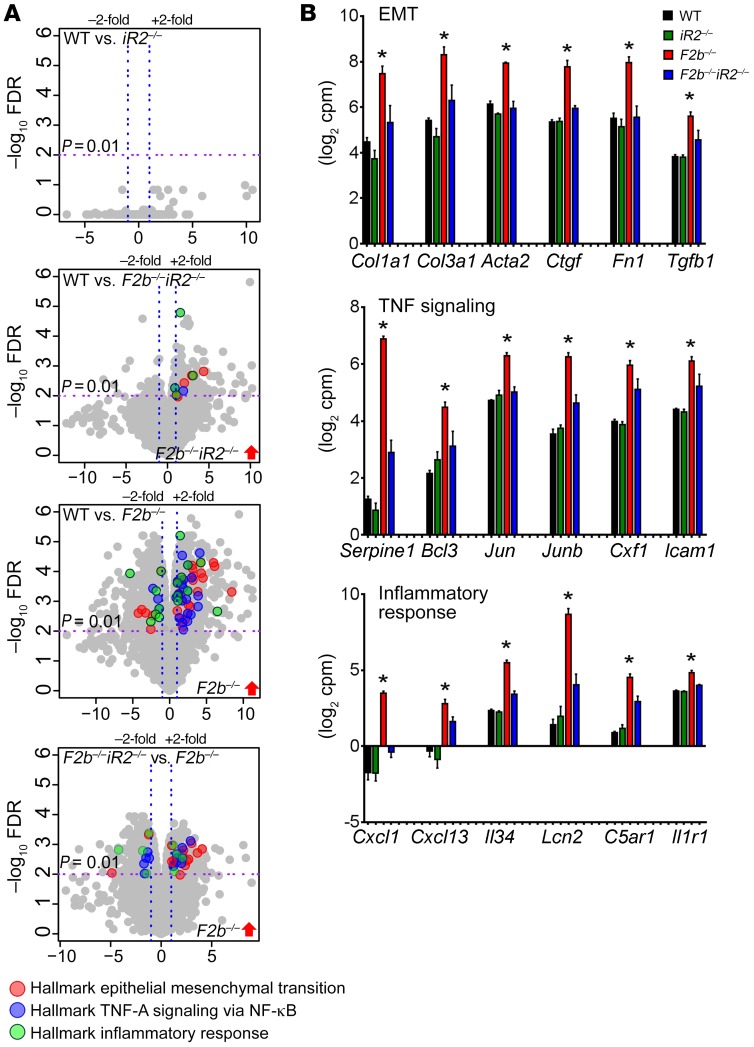
To explore how iRhom2 deficiency protects Fcgr2b–/– mice from kidney damage, we performed RNA-sequencing (RNA-seq) on whole kidneys. We found differential expression (DE) of 1,794 genes in Fcgr2b–/– kidneys compared with WT controls (fold change [FC] > 2, P < 0.01). Deletion of iRhom2 in Fcgr2b–/– mice prevented dysregulation of many of these genes (Fcgr2b–/–Rhbdf2–/– vs. WT, 229 DE genes; Fcgr2b–/– vs. Fcgr2b–/–Rhbdf2–/–, 827 DE genes), whereas iRhom2 deficiency in WT mice alone had no significant effect on renal gene expression (Rhbdf2–/– vs. WT, 0 gene) (Figure 4A and Supplemental Figure 3A).
Figure 4. RNA-seq analysis of kidneys from Fcgr2b–/– mice.
(A) Volcano plots of genes differentially expressed between indicated mouse genotypes (P = 0.01, FC = 2). Differentially expressed genes that belong to the enriched hallmark gene sets identified by GSEA are shown in colors, as indicated. (B) Expression of representative genes in the hallmark gene sets. Data are shown as mean ± SEM. *P < 0.01. n = 4 mice per group. Serpine1, serpin peptidase inhibitor, clade E member 1; Bcl3, B cell CLL/lymphoma 3; Jun, jun oncogene; Junb, jun B proto-oncogene; Csf1, colony stimulating factor 1; Icam1, intercellular adhesion molecule 1; C5ar1, complement C5a receptor 1; Il1r1, interleukin 1 receptor type 1.
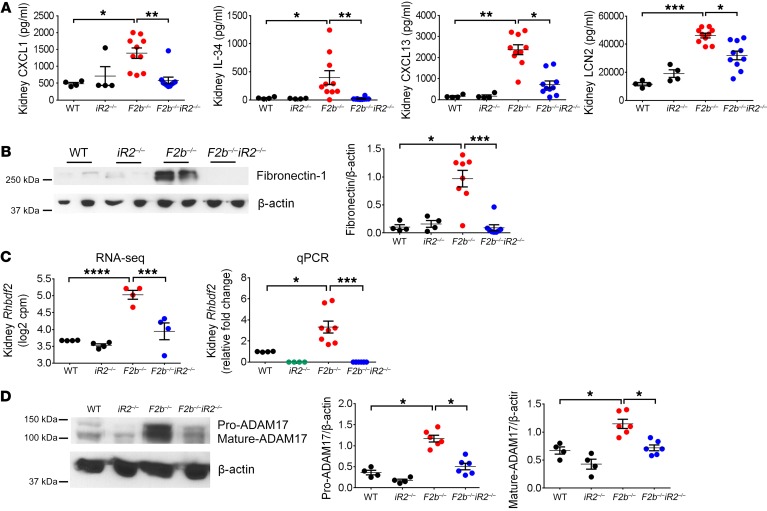
Gene set enrichment analysis (GSEA) (http://www.broad.mit.edu/gsea/index.html) revealed that gene sets involved in inflammation and tissue injury/remodeling were dysregulated in Fcgr2b–/– versus WT kidneys. Among hallmark gene sets identified, pathways associated with epithelial mesenchymal transition (EMT), TNF signaling, and the inflammatory response (MSigDb database, https://software.broadinstitute.org/gsea/msigdb/; Broad Institute) emerged as the top 3 gene sets upregulated in Fcgr2b–/– kidneys (Figure 4, A and B), followed by gene sets encoding apical junction, apoptosis, IL-6–JAK–STAT3 signaling, and extracellular matrix (ECM) receptor interaction (Supplemental Figure 3, B–D). Indeed, the highly upregulated genes included profibrotic factors, such as collagen type I α 1 (Col1a1), collagen type III α 1 (Col3a1), actin α 2 smooth muscle (Acta2), connective tissue growth factor (Ctgf), fibronectin 1 (Fn1), and tissue growth factor β 1 (Tgfb1), and inflammatory cytokines/chemokines, such as neutrophil chemoattractant Cxcl1, lymphocyte chemoattractant Cxcl13, growth factor for macrophages and monocyte IL-34 (Il34), and renal injury biomarker lipocalin 2 (Lcn2) (Figure 4B). Hierarchical clustering of EMT, TNF signaling, and inflammatory response gene sets indicated distinct expression patterns in the Fcgr2b–/– kidneys compared with the other groups (Supplemental Figure 4). Absence of iRhom2 significantly reduced dysregulation of these gene sets in Fcgr2b–/– kidneys (Figure 4, A and B; Supplemental Figure 3, B–D; and Supplemental Figure 4). We also detected a concomitant increase in the expression of CXCL1, CXCL13, IL-34, LCN2, and fibronectin proteins in Fcgr2b–/– kidneys, which was also significantly attenuated in the absence of iRhom2 (Figure 5, A and B). Moreover, p53 and TGF-β signaling were markedly upregulated in Fcgr2b–/– kidneys compared with WT controls, but not in Fcgr2b–/–Rhbdf2–/– kidneys (data not shown). We also found substantial downregulation of genes involved in oxidative phosphorylation and fatty acid metabolism in Fcgr2b–/– kidneys, a finding consistent with reports on the crucial role of defective fatty acid metabolism in kidney fibrosis (32). Importantly, the expression of these genes was restored in iRhom2-deficient Fcgr2b–/– kidneys (Supplemental Figure 5A).
Figure 5. Local inflammation and tissue injury/remodeling in Fcgr2b–/– kidneys were attenuated by iRhom2 deficiency.
(A) Measurement of CXCL1, IL-34, CXCL13, and LCN2 proteins in kidney lysates by ELISA. n = 4 WT, n = 4 Rhbdf2–/–, n = 10 Fcgr2b–/–, n = 10 Fcgr2b–/–Rhbdf2–/– mice. (B) Expression of fibronectin in kidneys. n = 4 WT, n = 4 Rhbdf2–/–, n = 8 Fcgr2b–/–, n = 8 Fcgr2b–/–Rhbdf2–/– mice. (C) Renal expression of Rhbdf2 measured by RNA-seq (n = 4 mice/group) and by qPCR. n = 4 WT, n = 4 Rhbdf2–/–, 8 Fcgr2b–/–, n = 8 Fcgr2b–/–Rhbdf2–/– mice. (D) ADAM17 expression in the kidneys by Western blot. β-actin was used as loading control. n = 4 WT, n = 4 Rhbdf2–/–, n = 6 Fcgr2b–/–, n = 6 Fcgr2b–/–Rhbdf2–/– mice. Data are shown as mean ± SEM. *P < 0.05; **P < 0.01; ***P < 0.001; ****P < 0.0001, 1-way ANOVA with Dunnett’s multiple comparisons test except RNA-seq data.
Recently, iRhom2 was shown to regulate the trafficking and stability of stimulator of IFN genes (STING), and iRhom2-deficient mice showed reduced production of type I IFN and IL-6 in response to DNA virus infection (33). In the current study, IFN gene signatures were induced to similar levels in Fcgr2b–/– and Fcgr2b–/–Rhbdf2–/– kidneys (Supplemental Figure 5B), with the highest FC present in the IFN-inducible gene Ifi202b (Supplemental Figure 6A). Moreover, serum IL-6 and splenic Il6 mRNA were equally increased in Fcgr2b–/– and Fcgr2b–/–Rhbdf2–/– mice compared with WT mice, while Ifna and Ifnb were not significantly induced in the spleens (Supplemental Figure 6, B and C). Thus, iRhom2 deficiency does not appear to affect STING signaling or the type I IFN pathway in Fcgr2b–/– mice.
In addition, we found markedly increased expression of Rhbdf2 in Fcgr2b–/– kidneys compared with other groups by both RNA-seq and quantitative real-time PCR (qPCR) (Figure 5C), along with markedly increased expression of ADAM17 proteins (Figure 5D). When we examined the public transcriptome database, we discovered that Rhbdf2 mRNA was significantly upregulated in the kidneys from LN patients compared with healthy donors, and it was also higher in nephrotic than subnephrotic patients (Supplemental Figure 7, A and B) (34, 35) (NCBI’s Gene Expression Omnibus [GEO] GSE32591), providing evidence that the iRhom2/ADAM17 pathway is also activated in human LN.
TNF and EGFR pathways are activated in kidney macrophages in Fcgr2b–/– mice.
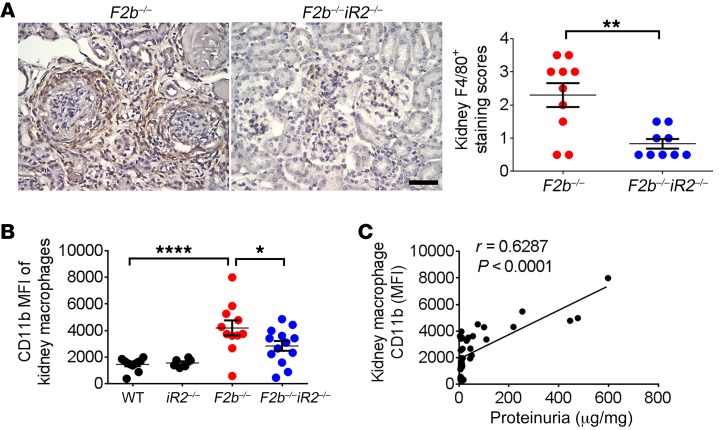
iRhom2-dependent ADAM17 activity is prominent in the myeloid cell compartment, particularly in macrophages (23, 28). Flow cytometric analysis of cells from kidneys of Fcgr2b–/– mice revealed increased numbers of macrophages (Figure 3C). Immunohistochemical staining with F4/80 showed that macrophages accumulated around glomeruli and tubulo-interstitium in aged (7 to 9 months old) Fcgr2b–/– kidneys (Figure 6A). These macrophages also have increased expression of the cell activation marker CD11b (Figure 6B). Both the number of kidney macrophages and CD11b levels were significantly lower in Fcgr2b–/–Rhbdf2–/– mice (Figure 6, A and B). Moreover, CD11b levels in kidney macrophages positively correlated with proteinuria levels (Figure 6C), suggesting an association between activated kidney macrophages and tissue injury.
Figure 6. Activation of kidney macrophages was associated with renal injury in Fcgr2b–/– mice.
(A) Staining of F4/80+ macrophages in the kidneys of Fcgr2b–/– and Fcgr2b–/–Rhbdf2–/– mice by immunohistochemistry. Brown shows F4/80+. (n = 10 Fcgr2b–/–, n = 9 Fcgr2b–/–Rhbdf2–/– mice). Data are shown as mean ± SEM. Scale bar: 25 μm. **P < 0.01, 2-tailed Mann-Whitney U test. (B) Expression of CD11b in CD45+F4/80hiCD11b+ kidney macrophage population assessed by flow cytometry. n = 11 WT, n = 6 Rhbdf2–/–, n = 11 Fcgr2b–/–, n = 13 Fcgr2b–/–Rhbdf2–/– mice. Data are shown as mean ± SEM. *P < 0.05; ****P < 0.0001, 1-way ANOVA with Dunnett’s multiple comparisons test. (C) Correlation analysis of kidney macrophage CD11b levels and proteinuria. n = 11 WT, n = 6 Rhbdf2–/–, n = 11 Fcgr2b–/–, n = 13 Fcgr2b–/–Rhbdf2–/– mice, 41 mice in total. Spearman’s correlation, 2-tailed.
To further explore the role of iRhom2 in the function of kidney macrophages in Fcgr2b–/– mice, we analyzed transcriptomes of kidney macrophages (Supplemental Figure 8 and sorting strategy in Supplemental Figure 1C). Similarly to our findings in the whole kidneys, 2,144 genes were differentially expressed in Fcgr2b–/– kidney macrophages compared with WT controls (P < 0.01, FC = 2), while only 212 genes were differentially expressed between Fcgr2b–/–Rhbdf2–/– and WT cells, 769 genes between Fcgr2b–/– and Fcgr2b–/– Rhbdf2–/– cells, and none between WT and Rhbdf2–/– cells (Supplemental Figure 8A). Similarly to what was seen in whole kidney, GSEA identified genes involved in TNF signaling highly upregulated in Fcgr2b–/– macrophages. Gene sets associated with cell cycle regulation, including E2F and Myc targets, were also upregulated (Supplemental Figure 8B).
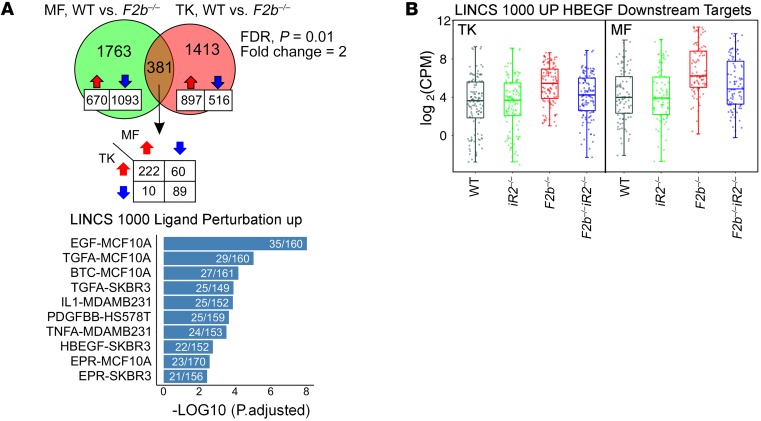
Comparison of differentially expressed genes in Fcgr2b–/– versus WT mice revealed 381 genes shared between macrophages and kidneys. Using Library of Integrated Network-Based Cellular Signatures (LINCS) (http://www.lincsproject.org/) gene sets, we determined that the shared 381 genes were enriched for genes induced by EGFR ligands, including EGF, TGF-α, betacellulin (BTC), and HB-EGF as well as for TNF-α, IL-1, and PDGF (Figure 7A). Among the above-listed EGFR ligands, HB-EGF is the only iRhom2/ADAM17-selective substrate (8). As expected, deletion of iRhom2 reduced expression of HB-EGF–induced genes in both macrophages and kidneys (Figure 7B). These results support the notion that the EGFR (likely via HB-EGF) and TNF signaling pathways are strongly activated in Fcgr2b–/– kidney tissues and macrophages and that loss of iRhom2 offers protection from the dysregulation of these key pathogenic pathways.
Figure 7. Comparison of differentially expressed genes in total kidneys and kidney macrophages of Fcgr2b–/– mice.
(A) Comparison of differentially expressed genes (Fcgr2b–/– vs. WT) in total kidneys (TK) and kidney macrophages (MF). Bar graph illustrates the top 10 enriched gene sets identified in the 381 shared genes by overrepresentation analysis using LINCS data sets. (B) Expression of HB-EGF–induced genes from LINCS data set in total kidneys (n = 4 mice/group) and kidney macrophages (n = 3 mice/group). FC > 2, P < 0.01 by EdgeR. See Methods.
Activation of EGFR signaling contributes to progressive renal injury in Fcgr2b–/– mice.
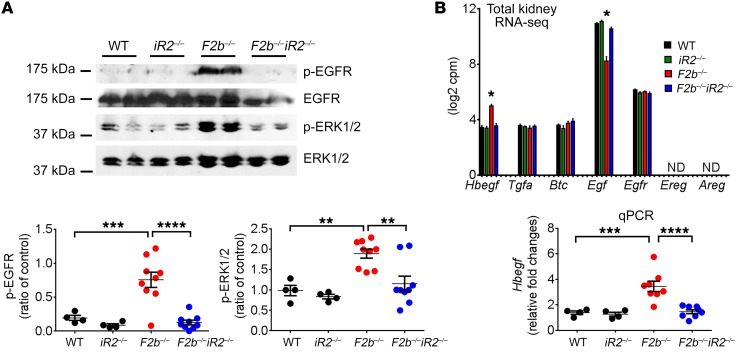
Overexpression of EMT and ECM receptor pathways in Fcgr2b–/– kidneys can lead to accumulation of ECM, activation of myofibroblasts, and end-stage fibrosis, processes described in chronic kidney diseases. These processes require EGFR signaling, and cleavage of most EGFR ligands is mediated by ADAM17 (22, 36, 37). To determine whether iRhom2/ADAM17-dependent EGFR activation occurs in Fcgr2b–/– kidneys, we assessed phosphorylation of EGFR and ERK1/2, the main kinase downstream of EGFR signaling. Kidneys from aged Fcgr2b–/– mice demonstrated increased EGFR and ERK1/2 phosphorylation compared with WT and Rhbdf2–/– kidneys, which were abrogated in Fcgr2b–/–Rhbdf2–/– kidneys (Figure 8A).
Figure 8. Activation of EGFR signaling in the kidneys of Fcgr2b–/– mice was diminished by iRhom2 deficiency.
(A) Kidney expression of p-EGFR and p-ERK1/2. Total ERK1/2 was used as control (n = 4 WT, n = 4 Rhbdf2–/–, n = 9 Fcgr2b–/–, n = 9 Fcgr2b–/–Rhbdf2–/– mice). (B) Kidney expression of EGFR ligands and the Egfr gene on RNA-seq (n = 4 mice per group) and renal Hbegf expression measured by qPCR (n = 4 WT, n = 4 Rhbdf2–/–, n = 8 Fcgr2b–/–, n = 8 Fcgr2b–/–Rhbdf2–/– mice). Data are shown as mean ± SEM. *P < 0.05; **P < 0.01; ***P < 0.001; ****P < 0.0001, 1-way ANOVA with Dunnett’s multiple comparisons test. ND, not detected.
Among EGFR ligands shed by iRhom2/ADAM17, only Hbegf was significantly increased in the kidneys of Fcgr2b–/– mice compared with WT or Fcgr2b–/–Rhbdf2–/– mice, as assessed by RNA-seq and confirmed by qPCR (Figure 8B). Neither epiregulin (Ereg) nor amphiregulin (Areg), 2 other iRhom2/ADAM17-dependent EGFR ligands, were detected. Tgfα, an iRhom1 and iRhom2/ADAM17 substrate (25), and Btc, an ADAM10 substrate, as well as their common receptor Egfr, were highly expressed at equal levels in the kidneys of all 4 strains. The ADAM10 substrate Egf was downregulated in the Fcgr2b–/– kidneys (Figure 8B).
To determine whether EGFR activation is required for renal damage in Fcgr2b–/– mice, we treated Fcgr2b–/– mice with erlotinib, an EGFR tyrosine kinase inhibitor (10 mg/kg i.p. 3 times/wk for 12 weeks) beginning at 6 months of age, after the onset of proteinuria. Erlotinib treatment protected mice from serious kidney damage (Figure 9, A–C), but did not alter serum anti-dsDNA Ab levels (Figure 9D). Renal function assessed by BUN was preserved (Figure 9A), but levels of proteinuria were not affected (Figure 9B). Histological analysis of kidneys showed marked improvement in tubulo-interstitial injury and a trend toward glomerular recovery (Figure 9C), suggesting that EGFR signaling participates in irreversible late-stage kidney damage. Moreover, erlotinib treatment reduced expression of Ctgf and Col1a1, key factors involved in EMT (38, 39), in kidneys of Fcgr2b–/– mice to levels similar to those in Fcgr2b–/–Rhbdf2–/– mice (Figure 9E). That erlotinib effectively blocked EGFR signaling was confirmed by decreased phosphorylation of EGFR and ERK1/2 in kidney lysates (Figure 9F). Taken together, these findings suggest that activation of EGFR plays an essential role in kidney injury in Fcgr2b–/– mice.
Figure 9. Blockade of EGFR signaling protected Fcgr2b–/– mice from severe kidney injury.
Female Fcgr2b–/– mice were treated with erlotinib (E) or vehicle control (V) (10 mice/group). Kidney damage was assessed by BUN (A), proteinuria (B) and histology (C, PAS and Masson trichrome staining). Scale bars: 50 μm. (D) Serum anti-dsDNA IgGs upon euthanasia between 7 and 9 months. (E) qPCR analysis of renal expression of Ctgf and Col1a1. n = 3 WT, n = 3 Rhbdf2–/–, n = 8 vehicle-treated Fcgr2b–/– mice, n = 8 erlotinib-treated Fcgr2b–/– mice, n = 8 Fcgr2b–/–Rhbdf2–/– mice. (F) Kidney expression of p-EGFR and p-ERK1/2. Total ERK1/2 was used as control. Data are shown as mean ± SEM. *P < 0.05; **P < 0.01; ***P < 0.001, 2-tailed unpaired Student’s t test (A, B, D, F), 2-tailed Mann-Whitney U test (C), 1-way ANOVA with Dunnett’s multiple comparisons test (E).
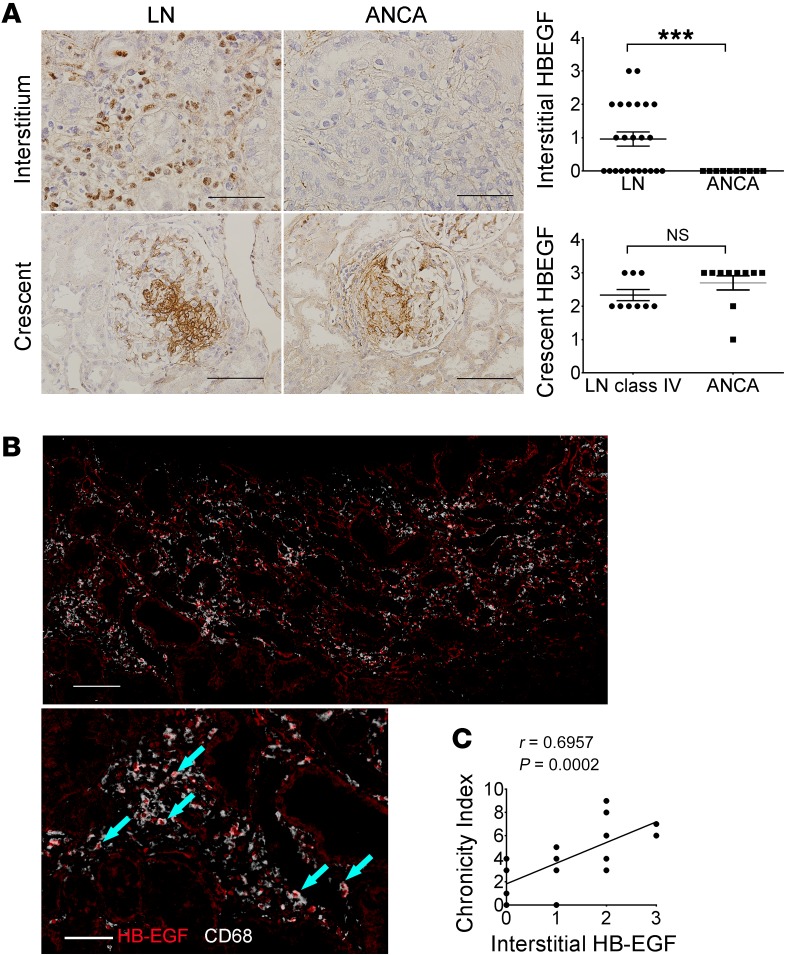
To determine whether HB-EGF expression is also upregulated in kidneys from patients with LN, we studied kidney biopsies with class IV and V nephritis. Consistent with previous reports (13), we found increased expression of HB-EGF in the glomerular crescents of LN patients. In addition, the interstitial infiltrates of LN kidneys were strongly stained for HB-EGF, as compared with our positive control patients with pauci-immune crescentic glomerulonephritis (anti-neutrophil cytoplasmic Ab–associated [ANCA-associated] vasculitis), who had HB-EGF overexpression only in the crescents (Figure 10A and Supplemental Table 1). Importantly, and consistent with the RNA-seq data from kidney macrophages in Fcgr2b–/– mice, HB-EGF colocalized with CD68+ macrophages in the interstitium of LN patients (Figure 10B and Supplemental Figure 7C ). Moreover, the intensity of HB-EGF expression in interstitial cells in LN kidneys positively correlated with the disease chronicity index (Figure 10C), an indicator of irreversible damage and poor prognosis.
Figure 10. Increased expression of HB-EGF in the kidneys of LN patients.
(A) HB-EGF staining in the interstitium and glomerular crescents of LN and ANCA patients (n = 9 LN class IV patients with crescents, n = 10 ANCA patients). Data are shown as mean ± SEM. ***P < 0.001, 2-tailed unpaired Student’s t test. Scale bars: 50 μm (upper panels); 100 μm (lower panels). (B) Sequential HB-EGF and CD68 staining in the kidney interstitium of LN patients. Arrows indicate overlapping staining of HB-EGF (red nuclei) and CD68 (white cytoplasm). Scale bars: 100 μm (top); 50 μm (bottom). (C) Correlation of interstitial HB-EGF and chronicity of lupus patients. n = 24 LN patients (n = 18 class IV and n = 6 class V). Two-tailed Spearman’s correlation.
Activation of TNF-α is required for kidney damage in Fcgr2b–/– mice.
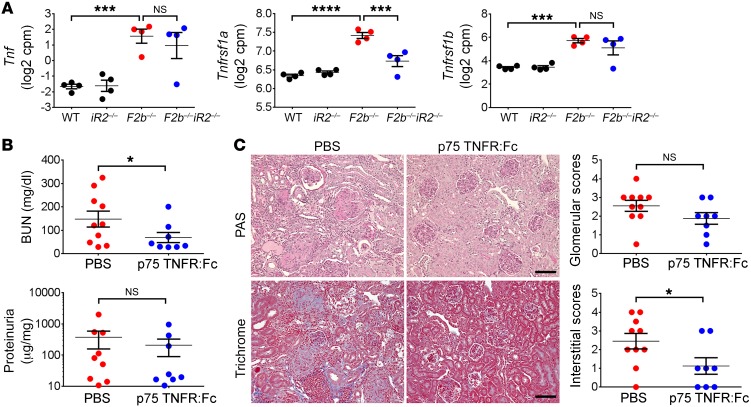
We next assessed the contribution of TNF-α, a major substrate of iRhom2/ADAM17, to kidney damage in Fcgr2b–/– mice. At the level of transcription, Tnf and its receptors TNF receptor I (TNFRI, gene name Tnfrsf1a) and II (TNFRII, gene name Tnfrsf1b) were markedly increased in aged Fcgr2b–/– kidneys. Deficiency of iRhom2 did not alter expression of Tnf and Tnfrsf1b, but reduced Tnfrsf1a levels (Figure 11A). Given that the proinflammatory signaling of TNF-α is predominantly mediated via soluble TNF/TNFRI binding (40) and that the highly upregulated TNF signaling pathway in Fcgr2b–/– kidneys is normalized in the absence of iRhom2 (Figure 4, A and B; Supplemental Figure 3, C and D; and Supplemental Figure 4), it is likely that iRhom2/ADAM17-dependent generation of soluble TNF-α contributes to kidney damage in Fcgr2b–/– mice.
Figure 11. Activation of the TNF-α pathway was required for kidney damage in Fcgr2b–/– mice.
(A) Expression of Tnf, Tnfrsf1a, and Tnfrsf1b in the kidneys of Fcgr2b–/– mice measured by RNA-seq. n = 4 mice/group. (B and C) Fcgr2b–/– mice were treated with murine p75TNFR:Fc or PBS. Kidney damage was assessed by proteinuria (albumin/creatinine ratio), BUN (B), and histology analysis (C, PAS and Masson trichrome staining). Scale bars: 50 μm. (n = 10 PBS-treated Fcgr2b–/– mice, n = 8 p75TNFR:Fc-treated Fcgr2b–/– mice). Data are shown as mean ± SEM. *P < 0.05; ***P < 0.001; ****P < 0.0001, 2-tailed unpaired Student’s t test (B), 2-tailed Mann-Whitney U test (C), EdgeR (A); see Methods.
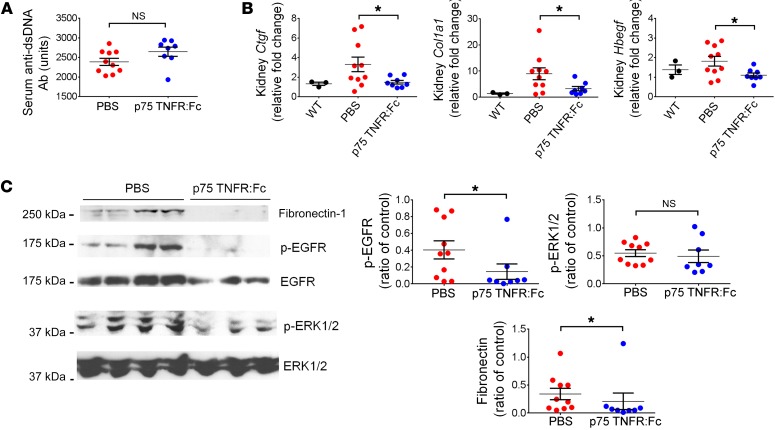
To determine whether TNF-α is required for development of LN in Fcgr2b–/– mice, we treated these animals with a TNF-α blocker, murine p75TNFR:Fc (41, 42), starting at 6 months of age, once proteinuria started to develop. After 12 weeks of treatment, mice receiving p75TNFR:Fc showed significantly reduced BUN levels, although the change in proteinuria levels was not significant (Figure 11B). Treatment with p75TNFR:Fc also markedly diminished tubulo-interstitial damage and led to a trend toward improved glomerular scores (Figure 11C). There was a modest, but not significant, increase in serum anti-dsDNA Ab levels in mice treated with p75TNFR:Fc (Figure 12A). Kidney expression of profibrotic factors Ctgf and Col1a1, measured by qPCR (Figure 12B), and fibronectin, measured by Western blot (Figure 12C), was reduced by p75TNFR:Fc treatment. Renal expression of Hbegf was also decreased with the treatment (Figure 12B). Moreover, activation of EGFR signaling in the kidneys, as indicated by phosphorylation of EGFR, was diminished in p75TNFR:Fc-treated mice, but phosphorylation of ERK1/2 was not significantly reduced (Figure 12C). These data suggest that iRhom2/ADAM17-dependent shedding of TNF-α and subsequent activation of TNF-α signaling contribute to the pathogenesis of renal damage in Fcgr2b–/– mice.
Figure 12. Blockade of TNF-α signaling ameliorated overexpression of profibrotic factors in Fcgr2b–/– kidneys.
Fcgr2b–/– mice were treated with murine p75TNFR:Fc or PBS. Serum anti-dsDNA Abs (A), renal expression of Ctgf, Col1a1,and Hbegf (B), and kidney expression of fibronectin, p-EGFR, EGFR, p-ERK1/2, and ERK1/2 (C) were assessed. n = 3 WT, n = 10 PBS-treated Fcgr2b–/– mice, n = 8 p75TNFR:Fc-treated Fcgr2b–/– mice. Data are shown as mean ± SEM. *P < 0.05, 2-tailed unpaired Student’s t test (A–C, p-EGFR and p-ERK1/2), 2-tailed Mann-Whitney U test (C, fibronectin).
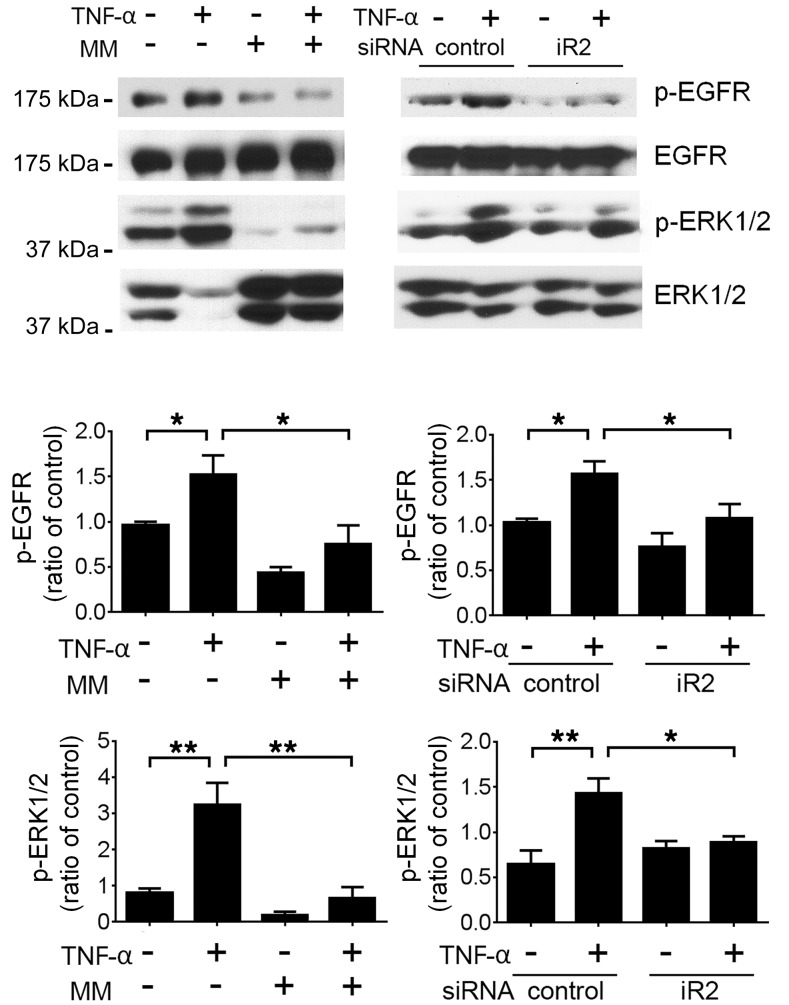
Given that both EGFR and TNF-α signaling appear to be critical mediators of kidney injury that leads to renal failure in Fcgr2b–/– mice and that EGFR phosphorylation is reduced with TNF blockade, we tested to determine whether TNF-α can directly activate EGFR in kidney cells. We found that treatment of the kidney podocyte cell line MPC5 (43) with TNF-α led to phosphorylation of both EGFR and ERK, which was abrogated by pretreatment cells with marimastat, a metalloproteinase inhibitor. More importantly, siRNA knockdown of iRhom2 abolished TNF-α–induced EGFR and ERK phosphorylation (Figure 13). Similar results were obtained in kidney tubular epithelial cell line C1 (44) (Supplemental Figure 9). Indeed, iRhom2-deficient mice had significantly lower expression of mature ADAM17 in their nephrons (glomeruli and tubules) (Supplemental Figure 10), further supporting the possibility that lack of iRhom2/ADAM17-dependent shedding in resident kidney cells, such as podocytes and tubular cells, also contributes to the protection of TNF-α–mediated transactivation of EGFR in Fcgr2b–/–Rhbdf2–/– mice.
Figure 13. TNF-α transactivates EGFR via iRhom2/ADAM17 in podocyte cell line.
MPC5 cells pretreated with marimastat (MM) or transfected with siRNA were stimulated with mouse TNF-α. Expression of p-EGFR, EGFR, p-ERK1/2, and ERK1/2 was assessed by Western blot. Densitometry of p-EGFR and p-ERK1/2 expression was calculated as ratios against total EGFR or ERK1/2, respectively. Data are shown as mean ± SEM. n = 3 independent experiments. *P < 0.05; **P < 0.01, 1-way ANOVA with Dunnett’s multiple comparisons test.
Discussion
Applying genetic and pharmacologic approaches to the Fcgr2b–/– mouse model of LN (30, 31), we established a pivotal role for iRhom2, a key regulator of ADAM17, in the pathogenesis of LN. We found that Fcgr2b–/– mice lacking iRhom2 are protected from progressive renal injury, likely by simultaneous blockade of TNF-α and EGFR signaling. We thus provide what we believe is the first proof of concept that targeting iRhom2 can protect from the deleterious consequences of dysregulation of these 2 major signaling pathways, thereby revealing a promising new target for attenuating LN.
Deficiency of iRhom2 in Fcgr2b–/– mice prevented major renal pathology, including proteinuria, excess deposition of ECM, infiltration of inflammatory cells, and structural damage of the glomeruli, but did not affect splenic immune cell expansion, production of anti-dsDNA Abs, or kidney deposition of IC and C3, suggesting that protection is achieved by blocking the effector arm of the disease.
TNF signaling was markedly upregulated in the kidneys of Fcgr2b–/– mice, and TNF-α blockade prevented severe kidney damage, demonstrating that activation of TNF signaling is an important mediator of injury in Fcgr2b–/– mice. Importantly, activation of the TNF signaling pathway in Fcgr2b–/– kidneys was diminished in the absence of iRhom2. As an early and potent master cytokine in tissue inflammation, TNF-α not only triggers production of numerous cytokines, including CXCL1, CXCL13, and IL-34, which further recruit inflammatory cells and amplify injury (2, 45), but can also cause direct injury in podocytes (46). TNF-α blockade using murine p75TNFR:Fc prevented interstitial, but not glomerular, injury in Fcgr2b–/– mice. In previous studies, this intervention has been shown to prevent both glomerular and interstitial damage in NZB/W mice (47). Lack of protection for proteinuria in the p75TNFR:Fc-treated Fcgr2b–/– mice could be due to strain differences in pathogenesis, disease severity, or TNF-α levels in different murine models of SLE (48). In addition, given that deficiency of iRhom2 markedly reduced proteinuria levels in Fcgr2b–/– mice, whereas blockade of TNF-α did not, glomerular injury associated with development of proteinuria may involve iRhom2-dependent, TNF-α–independent mechanism(s) in these mice. Whether blocking iRhom2 is beneficial to LN needs to be corroborated in other murine models of SLE in future studies.
In patients with lupus, treatment with TNF-α blockers had variable results and remains controversial. Although proteinuria was reported to be ameliorated in most patients with LN treated with TNF-α inhibitors, in some patients, disease was exacerbated with the emergence of auto-Abs. This is likely because anti–TNF-α Abs (e.g., infliximab and adalimumab) and soluble TNFR-Fc (etanercept) bind to both soluble TNF-α, which transduces a proinflammatory signal, and membrane-bound TNF-α, which mediates regulatory signals (40, 48–50). Blockade of iRhom2 has the advantage of specifically inhibiting generation of soluble TNF-α and thereby primarily targeting the proinflammatory pathway while circumventing adverse effects of complete TNF-α inhibition (40). That anti-dsDNA Ab levels were not altered in iRhom2-deficient Fcgr2b–/– mice while p75TNFR:Fc treatment led to a moderate increase in these Abs further supports the concept that effector functions of soluble TNF-α are blocked.
Activation of EGFR signaling in Fcgr2b–/– kidneys would explain the upregulation of tissue-remodeling genes, including EMT, apical junction, and ECM receptor interaction, which are signs of end-stage changes in chronic kidney diseases (37). Selective blockade of EGFR signaling with erlotinib decreased histological damage scores, lowered BUN levels, and reduced expression of markers of myofibroblast transition in Fcgr2b–/– kidneys. Thus, EGFR activation plays a crucial role in kidney disease progression in Fcgr2b–/– mice, driving pathways that cause aberrant tissue repair and fibrosis (13, 16, 37, 51, 52). That proteinuria was not affected by erlotinib in this study suggests that EGFR signaling is not mandatory for pathological urinary protein loss, as previously described for LPS-induced proteinuria (13), although EGFR does contribute to pathogenesis of some proliferative glomerular disorders (37).
Various EGFR ligands have been implicated in EGFR activation in other experimental models of nephritis (37). However, only Hbegf was highly upregulated in diseased kidneys from Fcgr2b–/– mice. HB-EGF is constitutively expressed along the nephrons and is induced in TLR- or IC-stimulated macrophages (53–56). Ours is the first work, to our knowledge, to implicate kidney macrophages as a critical source for HB-EGF in progressive kidney injury of LN. Consistent with studies in Fcgr2b–/– mice, which recapitulate the human condition with glomerular and interstitial inflammation and fibrosis (30, 31), our studies of human LN biopsies revealed that expression of HB-EGF occurred in both the glomerular crescents and interstitial cells. Interstitial HB-EGF colocalized mainly with macrophages. Most importantly, interstitial HB-EGF expression in human LN biopsies was associated with chronicity index, a measure of signs of irreversible kidney damage and poor prognosis. In nephrotoxic serum–induced nephritis, it is thought that HB-EGF produced from podocytes and parietal epithelial cells triggers activation of EGFR in podocytes and leads to rapidly progressive glomerulonephritis, whereas endothelium-derived HB-EGF drives angiotension II–induced renal fibrosis (13, 57). Collectively, our results indicate that both renal macrophages and resident kidney cells contribute to production of HB-EGF and subsequent EGFR signaling in Fcgr2b–/– kidneys. Importantly, ADAM17-dependent stimulated release of HB-EGF is controlled by iRhom2 (25), providing a compelling explanation for why inactivation of iRhom2 affects dysregulated EGFR signaling in this model.
Gene-expression analysis of kidney macrophages from Fcgr2b–/– mice further supports results from whole kidneys regarding TNF-α and HB-EGF/EGFR signaling. Since macrophages are a major source of TNF-α in response to IC or TLR stimulation, diminished TNF signaling in Fcgr2b–/–Rhbdf2–/– kidney macrophages provides another mechanism by which the iRhom2/ADAM17 pathway is a crucial contributor to pathogenesis of LN.
Moreover, TNF-α transactivates EGFR/ERK1/2 in podocyte and tubular cell lines, as observed previously (58, 59), suggesting that TNF-α can further amplify EGFR signaling and its detrimental effects on LN. Importantly, this transactivation is iRhom2/ADAM17 dependent. Moreover, transactivation of the EGFR by other factors, such as CXCL1 and TNF-like weak inducer of apoptosis (TWEAK) (60, 61), and most likely also via iRhom2/ADAM17, could also contribute to EGFR activation in Fcgr2b–/– kidneys. In addition, other iRhom2/ADAM17 substrates, such as IL-6R, may also contribute to renal damage in this model (62–64), which requires future study.
The common regulator of TNF-α and EGFR ligands, ADAM17, has been considered as a potential therapeutic target for chronic kidney diseases, particularly progressive fibrosis (15–17). In diseased Fcgr2b–/– kidneys, both ADAM17 and iRhom2 were upregulated, and iRhom2 was overexpressed in the kidneys of LN patients. Previous studies by our group indicate that iRhom2-deficient macrophages lack ADAM17 activity (26, 28). Our data here also show a marked loss of ADAM17 expression in the nephrons of mice lacking iRhom2. Thus, glomerular and tubular cells as well as leukocytes, such as macrophages, may both contribute to iRhom2/ADAM17-dependent shedding of its substrates, including HB-EGF. Compared with a kidney fibrosis model in which blockade of ADAM17 protected against fibrosis, but not elevated proteinuria or BUN or KIM-1/TIM-1 expression (17), iRhom2 deficiency rescued both renal function and profibrotic parameters. Importantly, iRhom2 deficiency seems to be more potent than erlotinib or p75TNFR:Fc alone. Hence, targeting iRhom2 could provide significant advantages over individually targeting ADAM17, TNF, or EGFR, all of which have been reported to cause adverse effects (37, 65, 66).
Recently, iRhom2 has also been reported to function as a regulator of STING (33), yet mechanistically, our data did not support engagement of iRhom2/STING in kidney damage of Fcgr2b–/– mice. Inactivation of the cGAS/STING pathway in murine lupus models is often associated with changes in anti-dsDNA Ab production and lymphoid hypertrophy (67–69), while iRhom2 deficiency did not affect anti-dsDNA Ab production in Fcgr2b–/– mice. Moreover, we found no change in the type I IFN signature in iRhom2-deficient Fcgr2b–/– mice.
In summary, we provide what we believe is the first proof-of-concept that iRhom2 is critical for the development of LN in Fcgr2b–/– mice, most likely by activating ADAM17-dependent TNF-α and HB-EGF/EGFR pathways, and we present evidence for increased HB-EGF expression in severe human LN. These results provide the rationale for future studies of iRhom2 in human lupus patients. Blockade of iRhom2 offers a mechanism for inhibiting 2 important mediators of renal damage as well as a new therapeutic approach to LN.
Methods
Animal experiments.
Fcgr2b–/– mice on a C57BL/6 background previously described (30, 31) were purchased from the Jackson Laboratory. C57BL/6 Rhbdf2–/– mice bred in-house (26) were crossed with Fcgr2b–/– mice for more than 10 generations. Female littermates (WT, Rhbdf2–/–, Fcgr2b–/–, and Fcgr2b–/–Rhbdf2–/– mice) were used in the study of lupus development from 3 to 9 months of age. For p75TNFR:Fc and erlotinib treatment, female Fcgr2b–/– mice were treated with murine p75TNFR:Fc (a gift from Amgen, 50 μg i.p. injection 3 times/wk, PBS as control) or erlotinib (LC Laboratories, catalog E4997) dissolved in 5% N-methyl-2-pyrrolidone, 45% polyethylene glycol 400, and 50% dextrose in water (10 mg/kg, i.p. injection, 3 times/wk, vehicle as control) starting at 6 months of age for 12 weeks. Mice were housed in the animal facility of Weill Cornell Medicine in accordance with NIH guidelines.
To assess development of lupus-like syndromes, mouse serum was collected and tested for anti-dsDNA IgGs by ELISA, as previously described (70), proteinuria was assessed by measuring the urine albumin/creatinine ratio using the Albuwell M Test Kit and Creatinine Companion Kit (Exocell), and BUN was measured in mouse serum on an AU 680 Beckman Coulter Analyzer. Mice were extensively perfused with 50 ml of PBS before harvesting kidneys for histology, immunohistology, flow cytometry, and isolation of RNA. For kidney histology and pathology, kidneys were fixed in 10% neutral buffered formalin (Sigma-Aldrich) and paraffin-embedded kidney sections (4 μm) were stained with PAS or Masson’s Trichrome (Sigma-Aldrich). Glomerular and tubular injury were assessed in a blinded manner by an experienced nephron-pathologist (M. Madaio) with a scoring system ranging from 0 to 4 (71). For EM analysis, kidney sections were examined under a JEOL JEM 1400 electron microscope equipped with a digital imaging system.
Immunofluorescence and IHC of mouse kidneys.
To detect kidney deposition of IC and C3, frozen kidney sections were stained with FITC-conjugated anti-mouse C3 (Cedarlane, catalog CL7503F) or Alexa Fluor 594–conjugated goat anti-mouse IgG (Abcam, catalog ab150116). For podocin staining, frozen kidney sections were stained with rabbit anti-mouse podocin Abs (Sigma-Aldrich, catalog P0372). Alexa Fluor 594–conjugated goat anti-rabbit IgG (Abcam, catalog ab150080) was used as s secondary Ab. Photographs were taken from a Nikon Eclipse E600 fluorescence microscope. Kidney KIM-1/TIM-1 and F4/80 were stained by immunohistochemistry. Briefly, paraffin-embedded kidney sections were deparaffinized. After Ag retrieval, slides were blocked and incubated with rabbit anti-mouse KIM-1/TIM-1 (Novus, catalog NBP1-76701) or rat anti-mouse F4/80 (Abcam, catalog ab16911). Biotin-conjugated secondary Abs were then applied. The standard ABC method (R&D Systems) was used for detection. Photographs were taken on a Nikon Eclipse E400 light microscope. ImageJ software (NIH) was used to quantify intensity of staining.
Flow cytometry analysis.
Single-cell suspensions were prepared from spleen and kidney. Briefly, for splenocytes, single-cell suspension was obtained by forcing the spleen through a 70 μm cell strainer. Red blood cells were then lysed with ammonium-chloride-potassium (ACK) buffer. To obtain leukocytes from kidneys, kidneys were minced and digested with collagenase B (Roche) for 45 minutes at 37°C. Cells were forced through a 100 μm cell strainer, and leukocytes were enriched by centrifuging cells resuspended in 40% percoll/PBS (v/v) at 1000 g for 15 minutes at room temperature. Cells on the bottoms of the tubes were collected, washed, and resuspended in FACS buffer.
Cells were stained with the following fluorochrome-conjugated anti-mouse Abs purchased from BioLegend or eBioscience. Anti-MHC class II I-A/I-E and anti-PDCA-1 mAbs are from eBioscience. All other mAb for FACS described here are from Biolegend: anti-CD45 (clone 30-F11), anti-F4/80 (clone BM8), anti-CD11b (clone M1/70), anti-Ly6C (clone HK1.4), anti-Ly6G (clone 1A8), anti-CD3ε (clone 145-2C11), anti-CD4 (clone GK1.5), anti-CD8a (clone 53-6.7), anti-CD69 (clone H1.2F3), anti-B220 (clone RA3-6B2), anti-CD11c (clone N418), anti-MHC class II I-A/I-E (clone M5/114.15.2), anti–PDCA-1 (clone 927). Immune cell populations were identified using the following gating strategy: macrophages as CD45+F4/80hiCD11b+, neutrophils as CD45+F4/80intCD11bhiLy6C+Ly6G+, monocytes as CD45+F4/80intCD11bhiLy6ChiLy6G–, T cells as CD45+CD11b–CD3+B220–CD4+ or CD45+CD11b–CD3+B220–CD8+ cells, splenic B cells as CD45+CD11b–CD3–B220+CD4–, splenic conventional DCs (cDCs) as CD11chiMHCclassII+PDCA–, and plasmacytoid DCs (pDCs) as CD11cloPDCA+ cells. Data were acquired on an upgraded 11-color FACSCalibur cytometer (BD/Cytex). FACS data were analyzed using FlowJo software (Tree Star).
Chemokine ELISA and Western blot.
Kidney lysates were prepared with tissue extraction reagent I (Thermo Fisher Scientific) supplemented with protease inhibitor cocktail (Roche) and phosphatase inhibitor cocktail (Roche). ELISA kits for CXCL1, IL-34, CXCL13, and LCN2 were from R&D Systems. A TNF-α ELISA kit was purchased from eBioscience. Abs used in Western blot were as follows: phosphorylated EGFR (p-EGFR) (Cell Signaling Technology, Y1068, catalog 3777), EGFR (R&D Systems, catalog AF1280), p-ERK1/2 (Cell Signaling Technology, T202/Y204, catalog 4370), ERK1/2 (Cell Signaling Technology, catalog 4695), fibronectin (Abcam, catalog ab2413), ADAM17 (ref. 28), and β-actin (Cell Signaling Technology, catalog 4970). Densitometry was analyzed with ImageJ software.
RNA-seq and data analysis.
For RNA-seq in mouse kidneys, total RNA was extracted with an RNeasy Mini Kit (QIAGEN). Library preparation and sequencing were performed by Genomics Resources Core Facility at Weill Cornell Medicine using the TruSeq RNA Library Prep Kit (Illumina) followed by single-read sequencing on the Illumina HiSeq 2500 instrument.
To sort kidney macrophages for RNA-seq, kidneys from 7- to 9-month-old mice were first minced and digested with collagenase B (Roche) for 45 minutes at 37°C. Macrophages were enriched by centrifuging cells in 40% percoll/PBS (v/v). Cells were centrifuged at 1000 g for 15 minutes at room temperature with low acceleration and no brake. Cells were stained with fluorochrome-conjugated anti-mouse Abs, and CD45+F4/80hiCD11b+Ly6G–Ly6C– kidney macrophages were sorted directly into RLT lysis buffer (QIAGEN) on a BD Vantage cell sorter, with more than 95% cell purity. Total RNA was extracted using an RNeasy Mini Kit (QIAGEN). Library preparation and sequencing were performed at the Epigenetics Core Facility at Weill Cornell Medicine using the SMART-Seq v4 Ultra Low Input RNA Kit (Clontech) followed by single-read clustering and 51 cycles of sequencing on the Illumina HiSeq 2500 instrument.
51 bp reads were aligned to annotated mouse genome (mm10, build 38.75, 41,128 genes and 87,108 transcripts) using CLC Bio Genomic Workbench 7.5 (QIAGEN). DE analysis was performed using EdgeR (72) with the unique exon read counts as a measure of gene-expression levels. Genes with less than 3 counts per million (cpm) in all replicates were filtered out prior to DE analysis. The feature counts were normalized to the library size using the weighted trimmed mean of M values methods (73). Analysis of multidimensional scaling plot indicated good separation and clustering of relevant genotypes with no visible batch effect. A quasi-likelihood negative binomial generalized log-linear model was fit to read counts for each gene. An empirical Bayes quasi-likelihood F test or a likelihood ratio test was performed gene-wise to evaluate the significance of differences in expression between analyzed groups. Genes with a Benjamini-Hochberg false discovery rate–corrected (FDR-corrected) P value of less than 0.01 and at least 2-fold expression change were considered to be differentially expressed.
GSEA was performed using the difference of log-transformed cpm as a ranking metric using Molecular Signatures DataBase v 5.2 (Broad Institute). Gene sets with 15 to 1,000 genes were included in analysis. Nominal P values were FDR corrected, and gene sets with an FDR of less than 0.01 were used to create a GSEA enrichment plot using customized R script.
All original RNA-seq data were deposited in the NCBI’s Gene Expression Omnibus database (GEO GSE107705).
Quantitative real-time RT-PCR (qPCR).
Total RNA was extracted with an RNeasy Mini Kit (QIAGEN) from mouse kidneys. cDNA was further synthesized with the Superscript III First-Strand Synthesis System for reverse transcription PCR (QIAGEN). qPCR was performed in duplicate with the SYBR green method on the ABI PRISM 7900HT Sequence Detection System (Applied Biosystems). The expression of each gene was normalized to the control gene, Gapdh. A last step dissociation curve was performed to demonstrate synthesis of the PCR product. Primer sequences were as follows: Rhbdf2 forward primer: 5′-GCTCAACCGAAGCTATCGAC-3′; Rhbdf2 reverse primer: 5′-ACGAACGTCAGCCAGTAGGT-3′; Hbegf forward primer: 5′-GACCCATGCCTCAGGAAATA-3′; Hbegf reverse primer: 5′-GACACCTGTGTCCGTGGTAA-3′; Ctgf forward primer: 5′-AGCTGACCTGGAGGAAAACA-3′; Ctgf reverse primer: 5′-GCAGCCAGAAAGCTCAAACT-3′; Col1a1 forward primer: 5′-AAGAAGCACGTCTGGTTTGG-3′; Col1a1 reverse primer: 5′-GGTCAGCTGGATAGCGACAT-3′; Ifna forward primer: 5′-AGTGAGCTGACCCAGCAGAT-3′; Ifna reverse primer: 5′-GGTGGAGGTCATTGCAGAAT-3′; Ifnb forward primer: 5′-CCCTATGGAGATGACGGAGA-3′; Ifnb reverse primer: 5′-ACCCAGTGCTGGAGAAATTG-3′; Il6 forward primer: 5′-TTCCATCCAGTTGCCTTCTT-3′; Il6 reverse primer: 5′-CAGAATTGCCATTGCACAAC-3′; Gapdh forward primer: 5′-ACCCAGAAGACTGTGGATGG-3′; and Gapdh reverse primer: 5′-GGATGCAGGGATGATGTTCT-3’.
Kidney cell line culture.
The conditionally immortalized mouse kidney podocyte cell line MPC5, established by Peter Mundel, was a gift from Chaim Putterman (Albert Einstein College of Medicine, New York, New York, USA). The tubular epithelial cell line C1 was a gift from Vicki R. Kelley (Harvard Medical School, Brigham and Women’s Hospital, Boston, Massachusetts, USA). Cells were cultured as previously described (43, 44). Cells were pretreated with 5 μM of the metalloprotease inhibitor marimastat (Sigma-Aldrich) for 15 minutes or transfected with siRNA (Life Technologies) 24 hours prior to stimulation with 20 ng/ml of mouse recombinant TNF-α (Peprotec) for 10 minutes.
Isolation of nephrons.
Mice were injected with 100 μl of clodronate liposome i.v. to deplete tissue macrophages 7 days before euthanasia. Mice were thoroughly perfused with PBS. Minced kidneys were digested with 1 mg/ml of collagenase A (Sigma-Aldrich) in PBS for 30 minutes at 37°C. The solution was then successively passed through fine mesh metal sieves (Endecotts) with a diameter of 250 μm, 106 μm, and 53 μm. The nephrons containing glomeruli and tubules were collected by rinsing from the 53 μm sieve. Collected nephrons were lysed with lysis buffer containing protease inhibitors. The purity of the nephrons was confirmed under a Nikon TMS inverted phase contrast microscope.
Human kidney biopsies.
Human kidney biopsies were randomly selected from the biobank of the Department of Pathology at the Academic Medical Center, University of Amsterdam. Biopsies were selected based on tissue diagnosis (18 cases of LN class IV, 6 cases of LN class V, 10 cases of ANCA-associated pauci immune crescentic glomerulonephritis, and 4 controls with normal kidney tissues from patients who underwent nephrectomy because of renal cell carcinoma). All biopsies contained a minimum of 10 glomeruli.
Histological parameters were scored in a blinded fashion by an experienced nephropathologist (J.J.T.H. Roelofs). LN was classified according to the WHO/RPS 2003 classification (74). Chronicity indices were determined according to the method of Austin et al. (75).
IHC of HB-EGF in human kidney samples.
Paraffin-embedded tissue sections (4 μm) were deparaffinized. Antigen retrieval was performed by boiling sections in a buffer containing 10 mM TRIS and 1 mM EDTA (pH 9.0) for 10 minutes. Sections were labeled with rabbit anti-human HB-EGF (Sigma-Aldrich), followed by labeling with an HRP-labeled goat anti-rabbit IgG (Immunologic), and stained with DAB (Sigma-Aldrich). Nuclei were counterstained with hematoxylin, and slides were mounted with VectorMount (Vector Laboratories). All control specimens with normal kidney tissues were negative for HB-EGF staining (data not shown).
Sequential IHC of human kidney samples.
Sequential IHC was performed as previously described (76). Briefly, paraffin-embedded human kidney sections (4 μm) were deparaffinized. Antigen retrieval was performed by boiling sections in a buffer containing 10 mM TRIS and 1 mM EDTA (pH 9.0) for 10 minutes. Sections were labeled and stained with Vector NovaRED (Vector Laboratories), nuclei were counterstained with hematoxylin, and slides were mounted with VectorMount (Vector Laboratories), after which slides were scanned on a digital slide scanner (IntelliSite Pathology Ultra Fast Scanner, Philips). The coverslip was removed, and Ab and staining were stripped by incubation for 30 minutes in 1 M Tris–HCl (pH 7.5) supplemented with 2% (v/v) sodium dodecyl sulfate and 0.7% (v/v) β-mercaptoethanol at 50°C, followed by rinsing in tap water. Complete removal of the stain was ensured by visual inspection. Sequential staining was performed on the same section. Primary Abs, sequentially applied, were rabbit anti-human HB-EGF (Sigma-Aldrich, catalog SAB1302715), mouse anti-human CD79a (DAKO, catalog GA62161-2), rabbit anti-human CD3 (Thermo Fisher Scientific, catalog PA5-28313), and mouse anti-human CD68 (DAKO, catalog M081401-2). Primary Abs were labeled using HRP-labeled anti-mouse or anti-rabbit IgG (Immunologic).
Composite images were generated from sequential IHC. Digital images of individual IHC staining performed on a single section were stacked and registered in the Fiji software package (http://fiji.sc/Fiji) using the StackReg plugin. The inversed red color channel generated using the Colour Deconvolution plugin 20 was used to create a false color composite image of the stacked images. The intensity of HB-EGF staining of interstitial cells was scored in a semiquantitative fashion from 0 to 3 in at least 7 high-power fields per biopsy section.
Statistics.
Data were expressed as mean ± SEM. The D’Agostino-Pearson omnibus normality test was used to test normal distribution. To compare 2 groups, 2-tailed unpaired Student’s t test (for data with Gaussian distribution) or Mann-Whitney U test (for data with no Gaussian distribution) was used. To compare 3 or more groups, 1-way ANOVA with Dunnett’s multiple comparisons was used. Spearman’s correlation was used for correlation analysis. Statistical analysis was performed using GraphPad Prism 6.0. P < 0.05 was assigned to reject the null hypothesis.
Study approval.
The animal studies were approved by the Institutional Animal Care and Use Committee of Weill Cornell Medicine. Under Dutch law, the secondary use of anonymous human biopsy specimens is not subject to ethical review or patient consent, following the Code of Conduct for Responsible Use of Human Tissue (Federation of Dutch Medical Scientific Societies, 2011; https://www.federa.org/sites/default/files/digital_version_first_part_code_of_conduct_in_uk_2011_12092012.pdf).
Author contributions
XQ designed and performed research, collected data, analyzed and interpreted data, performed statistical analysis, and wrote the manuscript. YC analyzed and interpreted data, performed statistical analysis, and wrote the manuscript. PR and MM performed research and collected data. JJTHR performed research and analyzed data. GF, PDI, and LD performed research. DRM and TWM contributed vital mouse strains. CPB and JES designed studies, reviewed data, and wrote the manuscript.
Supplementary Material
Acknowledgments
This work is supported by the Lupus Research Institute (to JES and CPB), NIH grant GM64750 (to CPB), and the Michael D. Lockshin Fellowship of the Barbara Volcker Center for Women and Rheumatic Disease at the Hospital for Special Surgery (to XQ). We thank Gang Lin (Weill Cornell Medical College), Frank Barrat (Hospital for Special Surgery), and Nike Claessen and Onno J. de Boer (Department of Pathology, Academic Medical Center, University of Amsterdam) for thoughtful suggestions and technical support for the project and Amgen Inc. for providing murine p75TNFR:Fc.
Version 1. 01/25/2018
In-Press Preview
Version 2. 03/05/2018
Electronic publication
Version 3. 04/02/2018
Print issue publication
Footnotes
Conflict of interest: The authors have declared that no conflict of interest exists.
Reference information: J Clin Invest. 2018;128(4):1397–1412.https://doi.org/10.1172/JCI97650.
Contributor Information
Xiaoping Qing, Email: qingx@hss.edu.
Yurii Chinenov, Email: chinenovy@hss.edu.
Patricia Redecha, Email: T_Redecha@Hotmail.com.
Michael Madaio, Email: MMADAIO@augusta.edu.
Joris J.T.H. Roelofs, Email: j.j.roelofs@amc.uva.nl.
Gregory Farber, Email: grf2005@med.cornell.edu.
Priya D. Issuree, Email: priya.issuree@gmail.com.
Laura Donlin, Email: DonlinL@HSS.EDU.
Tak W. Mak, Email: tmak@uhnres.utoronto.ca.
Carl P. Blobel, Email: blobelc@hss.edu.
Jane E. Salmon, Email: salmonj@hss.edu.
References
- 1.Mohan C, Putterman C. Genetics and pathogenesis of systemic lupus erythematosus and lupus nephritis. Nat Rev Nephrol. 2015;11(6):329–341. doi: 10.1038/nrneph.2015.33. [DOI] [PubMed] [Google Scholar]
- 2.Davidson A. What is damaging the kidney in lupus nephritis? Nat Rev Rheumatol. 2016;12(3):143–153. doi: 10.1038/nrrheum.2015.159. [DOI] [PMC free article] [PubMed] [Google Scholar]
- 3.Yung S, Chan TM. Anti-DNA antibodies in the pathogenesis of lupus nephritis--the emerging mechanisms. Autoimmun Rev. 2008;7(4):317–321. doi: 10.1016/j.autrev.2007.12.001. [DOI] [PubMed] [Google Scholar]
- 4.Nimmerjahn F, Ravetch JV. Fcgamma receptors as regulators of immune responses. Nat Rev Immunol. 2008;8(1):34–47. doi: 10.1038/nri2206. [DOI] [PubMed] [Google Scholar]
- 5.Moulton VR, Suarez-Fueyo A, Meidan E, Li H, Mizui M, Tsokos GC. Pathogenesis of human systemic lupus erythematosus: a cellular perspective. Trends Mol Med. 2017;23(7):615–635. doi: 10.1016/j.molmed.2017.05.006. [DOI] [PMC free article] [PubMed] [Google Scholar]
- 6.Suárez-Fueyo A, Bradley SJ, Klatzmann D, Tsokos GC. T cells and autoimmune kidney disease. Nat Rev Nephrol. 2017;13(6):329–343. doi: 10.1038/nrneph.2017.34. [DOI] [PubMed] [Google Scholar]
- 7.Black RA, et al. A metalloproteinase disintegrin that releases tumour-necrosis factor-alpha from cells. Nature. 1997;385(6618):729–733. doi: 10.1038/385729a0. [DOI] [PubMed] [Google Scholar]
- 8.Sahin U, et al. Distinct roles for ADAM10 and ADAM17 in ectodomain shedding of six EGFR ligands. J Cell Biol. 2004;164(5):769–779. doi: 10.1083/jcb.200307137. [DOI] [PMC free article] [PubMed] [Google Scholar]
- 9.Bohgaki T, et al. Up regulated expression of tumour necrosis factor {alpha} converting enzyme in peripheral monocytes of patients with early systemic sclerosis. Ann Rheum Dis. 2005;64(8):1165–1173. doi: 10.1136/ard.2004.030338. [DOI] [PMC free article] [PubMed] [Google Scholar]
- 10.Munroe ME, Vista ES, Guthridge JM, Thompson LF, Merrill JT, James JA. Proinflammatory adaptive cytokine and shed tumor necrosis factor receptor levels are elevated preceding systemic lupus erythematosus disease flare. Arthritis Rheumatol. 2014;66(7):1888–1899. doi: 10.1002/art.38573. [DOI] [PMC free article] [PubMed] [Google Scholar]
- 11.Wu T, et al. Elevated urinary VCAM-1, P-selectin, soluble TNF receptor-1, and CXC chemokine ligand 16 in multiple murine lupus strains and human lupus nephritis. J Immunol. 2007;179(10):7166–7175. doi: 10.4049/jimmunol.179.10.7166. [DOI] [PubMed] [Google Scholar]
- 12.Wu T, et al. Urine proteome scans uncover total urinary protease, prostaglandin D synthase, serum amyloid P, and superoxide dismutase as potential markers of lupus nephritis. J Immunol. 2010;184(4):2183–2193. doi: 10.4049/jimmunol.0900292. [DOI] [PMC free article] [PubMed] [Google Scholar]
- 13.Bollée G, et al. Epidermal growth factor receptor promotes glomerular injury and renal failure in rapidly progressive crescentic glomerulonephritis. Nat Med. 2011;17(10):1242–1250. doi: 10.1038/nm.2491. [DOI] [PMC free article] [PubMed] [Google Scholar]
- 14.Davis LS, Hutcheson J, Mohan C. The role of cytokines in the pathogenesis and treatment of systemic lupus erythematosus. J Interferon Cytokine Res. 2011;31(10):781–789. doi: 10.1089/jir.2011.0047. [DOI] [PMC free article] [PubMed] [Google Scholar]
- 15.Lattenist L, et al. Renal endothelial protein C receptor expression and shedding during diabetic nephropathy. J Thromb Haemost. 2016;14(6):1171–1182. doi: 10.1111/jth.13315. [DOI] [PubMed] [Google Scholar]
- 16.Lautrette A, et al. Angiotensin II and EGF receptor cross-talk in chronic kidney diseases: a new therapeutic approach. Nat Med. 2005;11(8):867–874. doi: 10.1038/nm1275. [DOI] [PubMed] [Google Scholar]
- 17.Kefaloyianni E, et al. ADAM17 substrate release in proximal tubule drives kidney fibrosis. JCI Insight. 2016;1(13):e87023. doi: 10.1172/jci.insight.87023. [DOI] [PMC free article] [PubMed] [Google Scholar]
- 18.Franzke CW, et al. Epidermal ADAM17 maintains the skin barrier by regulating EGFR ligand-dependent terminal keratinocyte differentiation. J Exp Med. 2012;209(6):1105–1119. doi: 10.1084/jem.20112258. [DOI] [PMC free article] [PubMed] [Google Scholar]
- 19.Vahdat AM, et al. TNF-alpha-converting enzyme (TACE/ADAM17)-dependent loss of CD30 induced by proteasome inhibition through reactive oxygen species. Leukemia. 2010;24(1):51–57. doi: 10.1038/leu.2009.230. [DOI] [PubMed] [Google Scholar]
- 20.Blaydon DC, et al. Inflammatory skin and bowel disease linked to ADAM17 deletion. N Engl J Med. 2011;365(16):1502–1508. doi: 10.1056/NEJMoa1100721. [DOI] [PubMed] [Google Scholar]
- 21.Horiuchi K, et al. Cutting edge: TNF-alpha-converting enzyme (TACE/ADAM17) inactivation in mouse myeloid cells prevents lethality from endotoxin shock. J Immunol. 2007;179(5):2686–2689. doi: 10.4049/jimmunol.179.5.2686. [DOI] [PubMed] [Google Scholar]
- 22.Peschon JJ, et al. An essential role for ectodomain shedding in mammalian development. Science. 1998;282(5392):1281–1284. doi: 10.1126/science.282.5392.1281. [DOI] [PubMed] [Google Scholar]
- 23.Li X, et al. iRhoms 1 and 2 are essential upstream regulators of ADAM17-dependent EGFR signaling. Proc Natl Acad Sci U S A. 2015;112(19):6080–6085. doi: 10.1073/pnas.1505649112. [DOI] [PMC free article] [PubMed] [Google Scholar]
- 24.Adrain C, Zettl M, Christova Y, Taylor N, Freeman M. Tumor necrosis factor signaling requires iRhom2 to promote trafficking and activation of TACE. Science. 2012;335(6065):225–228. doi: 10.1126/science.1214400. [DOI] [PMC free article] [PubMed] [Google Scholar]
- 25.Maretzky T, et al. iRhom2 controls the substrate selectivity of stimulated ADAM17-dependent ectodomain shedding. Proc Natl Acad Sci U S A. 2013;110(28):11433–11438. doi: 10.1073/pnas.1302553110. [DOI] [PMC free article] [PubMed] [Google Scholar]
- 26.McIlwain DR, et al. iRhom2 regulation of TACE controls TNF-mediated protection against Listeria and responses to LPS. Science. 2012;335(6065):229–232. doi: 10.1126/science.1214448. [DOI] [PMC free article] [PubMed] [Google Scholar]
- 27.Siggs OM, et al. iRhom2 is required for the secretion of mouse TNFα. Blood. 2012;119(24):5769–5771. doi: 10.1182/blood-2012-03-417949. [DOI] [PMC free article] [PubMed] [Google Scholar]
- 28.Issuree PD, et al. iRHOM2 is a critical pathogenic mediator of inflammatory arthritis. J Clin Invest. 2013;123(2):928–932. doi: 10.1172/JCI66168. [DOI] [PMC free article] [PubMed] [Google Scholar]
- 29.Li X, Ptacek TS, Brown EE, Edberg JC. Fcgamma receptors: structure, function and role as genetic risk factors in SLE. Genes Immun. 2009;10(5):380–389. doi: 10.1038/gene.2009.35. [DOI] [PMC free article] [PubMed] [Google Scholar]
- 30.Bolland S, Ravetch JV. Spontaneous autoimmune disease in Fc(gamma)RIIB-deficient mice results from strain-specific epistasis. Immunity. 2000;13(2):277–285. doi: 10.1016/S1074-7613(00)00027-3. [DOI] [PubMed] [Google Scholar]
- 31.Bolland S, Yim YS, Tus K, Wakeland EK, Ravetch JV. Genetic modifiers of systemic lupus erythematosus in FcgammaRIIB(–/–) mice. J Exp Med. 2002;195(9):1167–1174. doi: 10.1084/jem.20020165. [DOI] [PMC free article] [PubMed] [Google Scholar]
- 32.Kang HM, et al. Defective fatty acid oxidation in renal tubular epithelial cells has a key role in kidney fibrosis development. Nat Med. 2015;21(1):37–46. doi: 10.1038/nm.3762. [DOI] [PMC free article] [PubMed] [Google Scholar]
- 33.Luo WW, et al. iRhom2 is essential for innate immunity to DNA viruses by mediating trafficking and stability of the adaptor STING. Nat Immunol. 2016;17(9):1057–1066. doi: 10.1038/ni.3510. [DOI] [PubMed] [Google Scholar]
- 34.Ju W, et al. Defining cell-type specificity at the transcriptional level in human disease. Genome Res. 2013;23(11):1862–1873. doi: 10.1101/gr.155697.113. [DOI] [PMC free article] [PubMed] [Google Scholar]
- 35.Berthier CC, et al. Cross-species transcriptional network analysis defines shared inflammatory responses in murine and human lupus nephritis. J Immunol. 2012;189(2):988–1001. doi: 10.4049/jimmunol.1103031. [DOI] [PMC free article] [PubMed] [Google Scholar]
- 36.Sunnarborg SW, et al. Tumor necrosis factor-alpha converting enzyme (TACE) regulates epidermal growth factor receptor ligand availability. J Biol Chem. 2002;277(15):12838–12845. doi: 10.1074/jbc.M112050200. [DOI] [PubMed] [Google Scholar]
- 37.Harskamp LR, Gansevoort RT, van Goor H, Meijer E. The epidermal growth factor receptor pathway in chronic kidney diseases. Nat Rev Nephrol. 2016;12(8):496–506. doi: 10.1038/nrneph.2016.91. [DOI] [PubMed] [Google Scholar]
- 38.Burns WC, et al. Connective tissue growth factor plays an important role in advanced glycation end product-induced tubular epithelial-to-mesenchymal transition: implications for diabetic renal disease. J Am Soc Nephrol. 2006;17(9):2484–2494. doi: 10.1681/ASN.2006050525. [DOI] [PubMed] [Google Scholar]
- 39.Hosper NA, et al. Epithelial-to-mesenchymal transition in fibrosis: collagen type I expression is highly upregulated after EMT, but does not contribute to collagen deposition. Exp Cell Res. 2013;319(19):3000–3009. doi: 10.1016/j.yexcr.2013.07.014. [DOI] [PubMed] [Google Scholar]
- 40.Kalliolias GD, Ivashkiv LB. TNF biology, pathogenic mechanisms and emerging therapeutic strategies. Nat Rev Rheumatol. 2016;12(1):49–62. doi: 10.1038/nrrheum.2015.169. [DOI] [PMC free article] [PubMed] [Google Scholar]
- 41.Kim HY, Renshaw-Gegg LW, Balciunas AM, Kohno T. Construction and purification of the murine p75-murine IgG1 fusion protein. J Investig Dermatol Symp Proc. 2007;12(1):48–49. doi: 10.1038/sj.jidsymp.5650035. [DOI] [PubMed] [Google Scholar]
- 42.Hu YL, Kim HY, Kohno T, Khare SD. Pharmacodynamic effects of the murine p75-Fc fusion protein in mice. J Investig Dermatol Symp Proc. 2007;12(1):50–51. doi: 10.1038/sj.jidsymp.5650030. [DOI] [PubMed] [Google Scholar]
- 43.Mundel P, et al. Rearrangements of the cytoskeleton and cell contacts induce process formation during differentiation of conditionally immortalized mouse podocyte cell lines. Exp Cell Res. 1997;236(1):248–258. doi: 10.1006/excr.1997.3739. [DOI] [PubMed] [Google Scholar]
- 44.Menke J, et al. CSF-1 signals directly to renal tubular epithelial cells to mediate repair in mice. J Clin Invest. 2009;119(8):2330–2342. doi: 10.1172/JCI39087. [DOI] [PMC free article] [PubMed] [Google Scholar]
- 45.Baek JH, et al. IL-34 mediates acute kidney injury and worsens subsequent chronic kidney disease. J Clin Invest. 2015;125(8):3198–3214. doi: 10.1172/JCI81166. [DOI] [PMC free article] [PubMed] [Google Scholar]
- 46.Pedigo CE, et al. Local TNF causes NFATc1-dependent cholesterol-mediated podocyte injury. J Clin Invest. 2016;126(9):3336–3350. doi: 10.1172/JCI85939. [DOI] [PMC free article] [PubMed] [Google Scholar]
- 47.Bethunaickan R, et al. Anti-tumor necrosis factor α treatment of interferon-α-induced murine lupus nephritis reduces the renal macrophage response but does not alter glomerular immune complex formation. Arthritis Rheum. 2012;64(10):3399–3408. doi: 10.1002/art.34553. [DOI] [PMC free article] [PubMed] [Google Scholar]
- 48.Aringer M, Smolen JS. The role of tumor necrosis factor-alpha in systemic lupus erythematosus. Arthritis Res Ther. 2008;10(1):202. doi: 10.1186/ar2341. [DOI] [PMC free article] [PubMed] [Google Scholar]
- 49.Aringer M, Smolen JS. Therapeutic blockade of TNF in patients with SLE-promising or crazy? Autoimmun Rev. 2012;11(5):321–325. doi: 10.1016/j.autrev.2011.05.001. [DOI] [PubMed] [Google Scholar]
- 50.Kaymakcalan Z, et al. Comparisons of affinities, avidities, and complement activation of adalimumab, infliximab, and etanercept in binding to soluble and membrane tumor necrosis factor. Clin Immunol. 2009;131(2):308–316. doi: 10.1016/j.clim.2009.01.002. [DOI] [PubMed] [Google Scholar]
- 51.Kaissling B, Lehir M, Kriz W. Renal epithelial injury and fibrosis. Biochim Biophys Acta. 2013;1832(7):931–939. doi: 10.1016/j.bbadis.2013.02.010. [DOI] [PubMed] [Google Scholar]
- 52.Rintala JM, Savikko J, Rintala SE, Palin N, Koskinen PK. Epidermal growth factor receptor inhibition with erlotinib ameliorates anti-Thy 1.1-induced experimental glomerulonephritis. J Nephrol. 2016;29(3):359–365. doi: 10.1007/s40620-015-0233-x. [DOI] [PubMed] [Google Scholar]
- 53.Rehder P. Re: Harris SE, Guralnick ML, O’Connor RC: Urethral erosion of transobturator male sling. (Urology 2009;73:443) Urology. 2009;73(2):449–450; author reply 450. doi: 10.1016/j.urology.2008.08.495. [DOI] [PubMed] [Google Scholar]
- 54.Nakagawa T, et al. Distribution of heparin-binding EGF-like growth factor protein and mRNA in the normal rat kidneys. Kidney Int. 1997;51(6):1774–1779. doi: 10.1038/ki.1997.244. [DOI] [PubMed] [Google Scholar]
- 55.Triantafyllopoulou A, et al. Proliferative lesions and metalloproteinase activity in murine lupus nephritis mediated by type I interferons and macrophages. Proc Natl Acad Sci U S A. 2010;107(7):3012–3017. doi: 10.1073/pnas.0914902107. [DOI] [PMC free article] [PubMed] [Google Scholar]
- 56.Edwards JP, Zhang X, Mosser DM. The expression of heparin-binding epidermal growth factor-like growth factor by regulatory macrophages. J Immunol. 2009;182(4):1929–1939. doi: 10.4049/jimmunol.0802703. [DOI] [PMC free article] [PubMed] [Google Scholar]
- 57.Zeng F, Kloepfer LA, Finney C, Diedrich A, Harris RC. Specific endothelial heparin-binding EGF-like growth factor deletion ameliorates renal injury induced by chronic angiotensin II infusion. Am J Physiol Renal Physiol. 2016;311(4):F695–F707. doi: 10.1152/ajprenal.00377.2015. [DOI] [PMC free article] [PubMed] [Google Scholar]
- 58.Waheed F, et al. Central role of the exchange factor GEF-H1 in TNF-α-induced sequential activation of Rac, ADAM17/TACE, and RhoA in tubular epithelial cells. Mol Biol Cell. 2013;24(7):1068–1082. doi: 10.1091/mbc.E12-09-0661. [DOI] [PMC free article] [PubMed] [Google Scholar]
- 59.Kakiashvili E, et al. The epidermal growth factor receptor mediates tumor necrosis factor-alpha-induced activation of the ERK/GEF-H1/RhoA pathway in tubular epithelium. J Biol Chem. 2011;286(11):9268–9279. doi: 10.1074/jbc.M110.179903. [DOI] [PMC free article] [PubMed] [Google Scholar]
- 60.Rayego-Mateos S, et al. TWEAK transactivation of the epidermal growth factor receptor mediates renal inflammation. J Pathol. 2013;231(4):480–494. doi: 10.1002/path.4250. [DOI] [PubMed] [Google Scholar]
- 61.Bolitho C, Hahn MA, Baxter RC, Marsh DJ. The chemokine CXCL1 induces proliferation in epithelial ovarian cancer cells by transactivation of the epidermal growth factor receptor. Endocr Relat Cancer. 2010;17(4):929–940. doi: 10.1677/ERC-10-0107. [DOI] [PubMed] [Google Scholar]
- 62.Briso EM, Dienz O, Rincon M. Cutting edge: soluble IL-6R is produced by IL-6R ectodomain shedding in activated CD4 T cells. J Immunol. 2008;180(11):7102–7106. doi: 10.4049/jimmunol.180.11.7102. [DOI] [PMC free article] [PubMed] [Google Scholar]
- 63.Luig M, et al. Inflammation-induced IL-6 functions as a natural brake on macrophages and limits GN. J Am Soc Nephrol. 2015;26(7):1597–1607. doi: 10.1681/ASN.2014060620. [DOI] [PMC free article] [PubMed] [Google Scholar]
- 64.Braun GS, et al. IL-6 trans-signaling drives murine crescentic GN. J Am Soc Nephrol. 2016;27(1):132–142. doi: 10.1681/ASN.2014111147. [DOI] [PMC free article] [PubMed] [Google Scholar]
- 65.Zhu LJ, Yang X, Yu XQ. Anti-TNF-alpha therapies in systemic lupus erythematosus. J Biomed Biotechnol. 2010;2010:465898. doi: 10.1155/2010/465898. [DOI] [PMC free article] [PubMed] [Google Scholar]
- 66.Gooz M. ADAM-17: the enzyme that does it all. Crit Rev Biochem Mol Biol. 2010;45(2):146–169. doi: 10.3109/10409231003628015. [DOI] [PMC free article] [PubMed] [Google Scholar]
- 67.Gao D, et al. Activation of cyclic GMP-AMP synthase by self-DNA causes autoimmune diseases. Proc Natl Acad Sci U S A. 2015;112(42):E5699–E5705. doi: 10.1073/pnas.1516465112. [DOI] [PMC free article] [PubMed] [Google Scholar]
- 68.Klarquist J, Hennies CM, Lehn MA, Reboulet RA, Feau S, Janssen EM. STING-mediated DNA sensing promotes antitumor and autoimmune responses to dying cells. J Immunol. 2014;193(12):6124–6134. doi: 10.4049/jimmunol.1401869. [DOI] [PMC free article] [PubMed] [Google Scholar]
- 69.Sharma S, et al. Suppression of systemic autoimmunity by the innate immune adaptor STING. Proc Natl Acad Sci U S A. 2015;112(7):E710–E717. doi: 10.1073/pnas.1420217112. [DOI] [PMC free article] [PubMed] [Google Scholar]
- 70.Deocharan B, et al. Alpha-actinin immunization elicits anti-chromatin autoimmunity in nonautoimmune mice. J Immunol. 2007;179(2):1313–1321. doi: 10.4049/jimmunol.179.2.1313. [DOI] [PubMed] [Google Scholar]
- 71.Chan O, Madaio MP, Shlomchik MJ. The roles of B cells in MRL/lpr murine lupus. Ann N Y Acad Sci. 1997;815:75–87. doi: 10.1111/j.1749-6632.1997.tb52046.x. [DOI] [PubMed] [Google Scholar]
- 72.Robinson MD, McCarthy DJ, Smyth GK. edgeR: a Bioconductor package for differential expression analysis of digital gene expression data. Bioinformatics. 2010;26(1):139–140. doi: 10.1093/bioinformatics/btp616. [DOI] [PMC free article] [PubMed] [Google Scholar]
- 73.Robinson MD, Oshlack A. A scaling normalization method for differential expression analysis of RNA-seq data. Genome Biol. 2010;11(3):R25. doi: 10.1186/gb-2010-11-3-r25. [DOI] [PMC free article] [PubMed] [Google Scholar]
- 74.Weening JJ, et al. The classification of glomerulonephritis in systemic lupus erythematosus revisited. J Am Soc Nephrol. 2004;15(2):241–250. doi: 10.1097/01.ASN.0000108969.21691.5D. [DOI] [PubMed] [Google Scholar]
- 75.Austin HA, et al. Prognostic factors in lupus nephritis. Contribution of renal histologic data. Am J Med. 1983;75(3):382–391. doi: 10.1016/0002-9343(83)90338-8. [DOI] [PubMed] [Google Scholar]
- 76.van den Brand M, et al. Sequential immunohistochemistry: a promising new tool for the pathology laboratory. Histopathology. 2014;65(5):651–657. doi: 10.1111/his.12446. [DOI] [PubMed] [Google Scholar]
Associated Data
This section collects any data citations, data availability statements, or supplementary materials included in this article.


