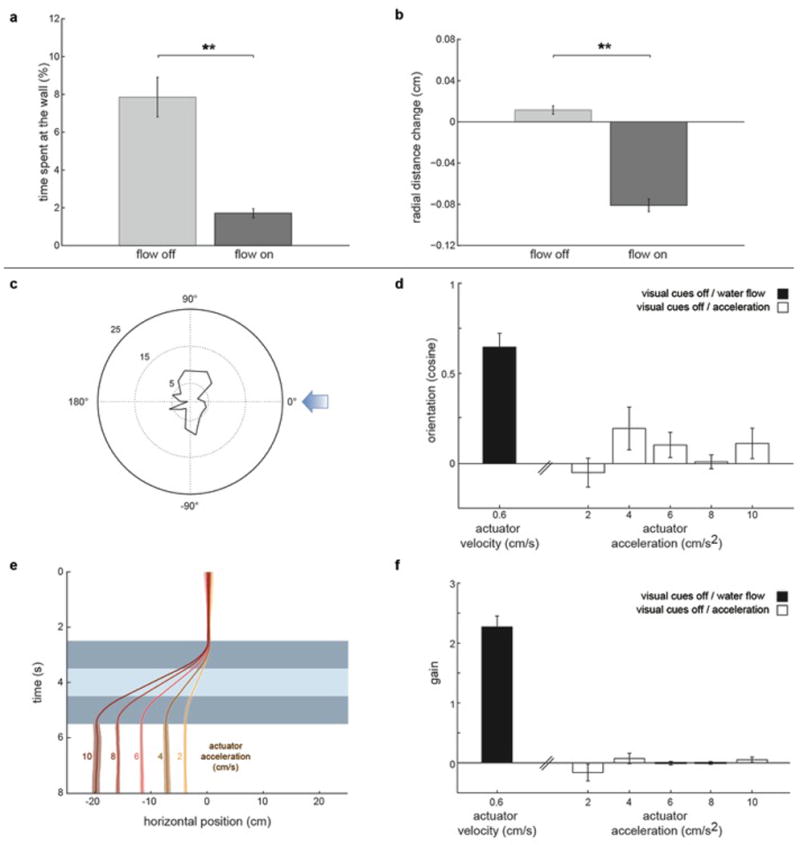
Extended Data Fig.1. Touch and acceleration do not explain rheotaxis in larval zebrafish.

a, Percentage of time fish spend at the wall; n = 13 fish, 341 trials. b, Mean radial distance change for bouts occurring in close proximity to the wall (<0.36cm, 1/3 of the tube radius). n = 13 fish, 1364 bouts. c-f, Rheotactic metrics for larval zebrafish exposed to a series of acceleration/water displacement/de-acceleration stimulus. c, Polar plot of fish orientation in the axis of the stimulation. Blue arrow represents stimulus direction. d, cosine of the mean orientation for fish presented with different acceleration regimes. Black bar represents cosine of the mean orientation for fish exposed to water flow in the dark (Fig.1g). e, Fish position (from the observer’s point of view) in the axis of the stimulus. Dark blue represent acceleration/de-acceleration periods while light blue represents water displacement. f, Gain for fish presented with different acceleration regimes. Black bar represents gain for fish exposed to water flow in the dark (Fig.1i). n = 6 fish subjected to 6 trials at each acceleration regime (180 trials total). All data is shown as means ± s.e.m. ** = p<0.01; Monte Carlo permutation test.
