Abstract
The habenulopeduncular pathway consists of the medial habenula (MHb), its output tract, the fasciculus retroflexus, and its principal target, the interpeduncular nucleus (IP). Several IP subnuclei have been described, but their specific projections and relationship to habenula inputs are not well understood. Here we have used viral, transgenic, and conventional anterograde and retrograde tract-tracing methods to better define the relationship between the dorsal and ventral MHb, the IP, and the secondary efferent targets of this system. Although prior studies have reported that the IP has ascending projections to ventral forebrain structures, we find that these projections originate almost entirely in the apical subnucleus, which may be more appropriately described as part of the median raphe system. The laterodorsal tegmental nucleus receives inhibitory inputs from the contralateral dorsolateral IP, and mainly excitatory inputs from the ipsilateral rostrolateral IP subnucleus. The midline central gray of the pons and nucleus incertus receive input from the rostral IP, which contains a mix of inhibitory and excitatory neurons, and the dorsomedial IP, which is exclusively inhibitory. The lateral central gray of the pons receives bilateral input from the lateral IP, which in turn receives bilateral input from the dorsal MHb. Taken together with prior studies of IP projections to the raphe, these results form an emerging map of the habenulopeduncular system that has significant implications for the proposed function of the IP in a variety of behaviors, including models of mood disorders and behavioral responses to nicotine.
Keywords: acetylcholine, dorsal raphe, interpeduncular nucleus, medial habenula, median raphe, mesopontine tegmentum, substance P, RRIDs: AB_2079751, AB_390204, AB_10806898, AB_518614, AB_10013220, AB_726859, AB_94639
1 | INTRODUCTION
The medial habenula (MHb) is an easily identified but poorly understood diencephalic nucleus, consisting of a dorsal subnucleus (dMHb) containing excitatory neurons that express the tachykinin peptides substance P (SP) and neurokinin B (NKB), and a ventral subnucleus (vMHb) that coexpresses glutamate and acetylcholine. MHb efferents are directed almost entirely to the interpeduncular nucleus (IP), where the lateral subnucleus (IPL) receives dMHb input and several of the remaining subnuclei (rostral IP [IPR], caudal IP [IPC], intermediate IP [IPI], contralateral dorsolateral IP [IPDL]) receive vMHb input. Although the behavioral function of the MHb has been relatively mysterious, recent work has demonstrated a role for the dMHb in regulating voluntary wheel running and some behaviors related to mood or affect (Hsu, Morton, Guy, Wang, & Turner, 2016; Hsu et al., 2014), and a role for the vMHb and/or IP as mediating behavioral responses to nicotine, including reinforcement, aversion and withdrawal (Antolin-Fontes, Ables, Gorlich, & Ibanez-Tallon, 2015; Harrington et al., 2016; Salas, Sturm, Boulter, & De Biasi, 2009; Zhao-Shea, Liu, Pang, Gardner, & Tapper, 2013; Zhao-Shea et al., 2015). Recent work has also shown a role for presynpaptic vMHb CB1 receptors (Soria-Gomez et al., 2015), and GABA-B receptors (Zhang et al., 2016) in the regulation of conditioned fear responses.
The vMHb/IP pathway is also of interest due to its expression of unusual acetylcholine receptor subunits, including the channel-forming α3 and β4 receptor subunits in the vMHb, and the “accessory” α5 receptor subunit expressed in the IP subnuclei that receive vMHb input (Hsu et al., 2013; Marks et al., 1992; Salas et al., 2003). These nicotinic receptors are of special interest because the genes encoding the α5/α3/β4 subunits are colocated in the mouse and human genomes, and in humans, alleles at this locus, including a functional variant in the α5 receptor, have been associated with smoking behavior (Berrettini & Doyle, 2012; Lassi et al., 2016).
Despite this growing interest in the habenulopeduncular pathway, the second-order circuits downstream from the IP are poorly understood. It has been reported that the IP sends ascending projections to the hippocampus and septal nuclei and descending projections to the median raphe, dorsal raphe, and pontine dorsal tegmentum (Groenewegen, Ahlenius, Haber, Kowall, & Nauta, 1986; Shibata & Suzuki, 1984), but it has not been determined which of these projections are from habenulo-recipient areas of the IP. Furthermore, little is known about the specific projections of the IP subnuclei that have been defined based on morphological criteria in the rat (Hamill & Lenn, 1984; Hamill, Olschowka, Lenn, & Jacobowitz, 1984; Lenn & Hamill, 1984), or about the neurotransmitter phenotypes of the IP neurons projecting to specific brainstem targets.
In prior work we have shown that a class of GABAergic projection neurons in the IPR, characterized by expression of the α5 acetylcholine receptor subunit (Chrna5), receive direct vMHb input and project to the median raphe/paramedian raphe (PMnR) and pontine dorsal raphe/central gray (Hsu et al., 2013). In the present study, we have used modern methods including viral anterograde tract tracing, conventional and viral retrograde tracing, and a variety of transgenic and neuropeptide markers for the neurotransmitter phenotype of IP neurons to define the habenulopeduncular circuitry for the remaining IP subnuclei. These approaches reveal the unappreciated complexity and several novel features of the efferent pathways of the IP, and have important implications for models of IP function.
2 | METHODS
2.1 | Mice
Strains were kept on a C57BL/6 background (Charles River), and were 2–6 months of age at the time of the experiments. Both male and female mice were used for anatomical experiments. Cre driver lines used for anterograde tracing from the IP included: Drd3Cre_KI196 (STOCK Tg(Drd3- cre)KI196Gsat/Mmucd), from the Gensat project, available from the Mutant Mouse Resource Center of University of California, Davis (Gerfen, Paletzki, & Heintz, 2013), and Nos1CreERT2 (B6;129S-Nos1 <tm1.1(cre/ERT2)Zjh/J, Jax 014541), originating in the lab of Josh Huang, available from Jackson Laboratories (Taniguchi et al., 2011). Cre driver lines used for anterograde tracing from the MHb included: ChATIRES-Cre (B6;129S6-Chattm2(cre)Lowl/J, Jax 006410) and Tac1IRES-Cre (B6;129S-Tac1tm1.1(cre)Hze/J, Jax 021877), both available from Jackson Laboratories (Harris et al., 2014; Rossi et al., 2011). Cre driver lines for the identification of the neurotransmitter phenotype of GABAergic and glutamatergic neurons included: Gad2IRES-Cre (STOCK Gad2tm2(cre)Zjh/J, Jax 010802), Slc17a6IRES-Cre (Vglut2-IRES-Cre, STOCK Slc17a6tm2(cre)Lowl/J, Jax 016963), and Slc17a8Cre (B6;129S-Slc17a8tm1.1(cre)Hze/J, Jax 028534), all available from Jackson Laboratories (Taniguchi et al., 2011; Vong et al., 2011). The fidelity of transgenic reporter expression induced by the Gad2Cre line in GABAergic neurons throughout the brain, including the IP, has been validated as part of the Allen Transgenic Characterization project, using double-label in situ hybridization (DFISH) colocalization of Gad1 and reporter gene mRNA. These data are available online at: http://connectivity.brain-map.org/transgenic/experiment/100142491. Similarly, the fidelity of reporter gene expression induced by the Vglut2Cre line in glutamatergic neurons throughout the brain, including the IP, has been validated using DFISH showing that reporter gene mRNA expression is NOT colocalized with a Gad1 probe. See: http://connectivity.brain-map.org/transgenic/experiment/100142487.
Three transgenic lines, Ai6, Ai14, and Ai75, were used as Cre-dependent fluorescent reporters for genetic identification of neurotransmitter phenotypes and retrograde viral cell labeling. Ai6 (B6.Cg-Gt (ROSA)26Sortm6(CAG-ZsGreen1)Hze/J, Jax 007906) expressing a ZsGreen reporter, and Ai14 (B6.Cg-Gt(ROSA)26Sortm14(CAG-tdTo-mato)Hze/J, Jax 007914), expressing a cytoplasmic tdTomato reporter, have been previously described (Madisen et al., 2010). Ai75 (B6.Cg-Gt (ROSA)26Sortm75.1(CAG-tdTomato*)Hze/J, Jax 025106), expressing a tdTomato reporter with a nuclear localization signal, was generated by targeted recombination in mice in which the Rosa26 locus has been modified by targeted insertion of a construct containing the strong and ubiquitously active CAG promoter, a loxP-flanked stop cassette, an nls-tdTomato gene unit, a woodchuck hepatitis virus posttranscriptional regulatory element (WPRE) and a polyA signal, as described previously (Madisen et al., 2010). The Ai75 targeting construct was transfected into the 129S6B6F1 hybrid ES cell line G4, and correctly targeted clones were identified by PCR and Southern blot screening, then injected into C57BL/6J blastocysts to obtain chimeras for eventual germline breeding. The resulting mice were crossed to the Rosa26-PhiC31 line (Jax 007743) to delete the PGK-Neo selection cassette through PhiC31-mediated recombination between the AttB and AttP recombinase sites in the germline of the mice. The Ai75 mouse line has been deposited to the Jackson Laboratory (Jax 025106), and is maintained in the congenic C57BL/6J background.
Gad2IRES-Cre/Ai75 mice, expressing nuclear tdTomato in GABAergic neurons throughout the brain, were noted to have weight loss and hindlimb weakness beginning after 4 weeks of age (weaning), suggesting a deleterious effect of the widespread expression of nuclear tdTomato in GABAergic neurons. Placement of food pellets on the cage floor rather than an elevated food hopper allowed mice to overcome the hindlimb weakness and led to a restoration of normal body weight. Comparison of tdTomato expression in Gad2IRES-Cre/Ai75 mice with the expression of Gad2 mRNA in the IP did not suggest loss of IP GABAergic neurons in adult mice. Thus, this transgenic reporter is suitable for the anatomical identification of GABAergic neurons, but not for behavioral studies.
2.2 | Anterograde tracing
Three cases of anterograde tracing from the IP and two cases from the MHb are described here in detail. Other relevant cases of anterograde tracing from the IP that were less specific or otherwise less suitable for analysis include Allen Mouse Brain Connectivity Atlas experiments 184212995 (Ntrk1-Cre), 267538735 (Erbb4-Cre) and 171019710 (Slc32a1-Cre) which are available online (http://connectivity.brain-map.org/), and one case that did not meet quality control criteria for addition to the online database. Anterograde tract tracing in wild-type c57BL/6 mice (case IP-a2) was performed with the viral vector rAAV2/1.hSynapsin.EGFP.WPRE.bGH, encoding EGFP under the regulation of a human synapsin promoter. Tract tracing in Cre-recombinase expressing mice (cases IP-a1, IP-a3) was performed with the Cre-inducible viral vector rAAV2/1.pCAG.FLEX.EGFP.WPRE.bGH. Viral stocks were prepared at the University of Pennsylvania Gene Therapy Program Vector Core (http://www.med.upenn.edu/gtp/vectorcore/). The detailed methods used here for anterograde tract tracing with iontophoretic injection of AAV have recently been published in conjunction with the Allen Mouse Brain Connectivity Atlas (ACA, Harris, Wook Oh, & Zeng, 2012; Oh et al., 2014). Anterograde tracing cases were analyzed by serial two-photon tomography (Ragan et al., 2012), using automated vibratome sectioning in the coronal plane, which allows the collection of 140 inherently prealigned images collected every 100 μm through the entire rostral-to-caudal extent of the mouse brain. The resolution in the plane of section was 0.35 μm. The Multi-photon image acquisition for the viral tract-tracing cases was accomplished using the Tissue-Cyte 1000 system (TissueVision, Cambridge, MA) coupled with a Mai Tai HP DeepSee laser (Spectra Physics, Santa Clara, CA).
2.3 | Retrograde tracing and immunofluorescence
Conventional retrograde tract tracing was performed using a 0.5% solution of cholera toxin B subunit (CTB; List Biological Labs), injected using standard stereotaxic coordinates (Paxinos & Franklin, 2001). Small focal injections were performed by iontophoresis using a pulled glass pipette, using published methods (Harris et al., 2012). In brief, the pipette was positioned using a stereotaxic frame, and current was delivered with a Midgard Precision Current Source (Stoelting,Wood Dale, IL). The current was set to 3 μA, and was alternated for 7 s on and 7 s off for 5–10 min depending on the size of the structure labeled, followed by a 5-min rest period before the needle was retracted. Animals were fixed by 4% PFA perfusion after 6–14 days, equilibrated in graded sucrose solutions, frozen at −80°C in OCT solution, and cryo-sectioned at 25 μm for immunofluorescence. Viral retrograde tracing was performed using Cav2-Cre virus (Hnasko et al., 2006, gift of Dr. Larry Zweifel), combined with the transgenic reporter line Ai14, providing conditional expression of tdTomato, described above. Volumes of 100–500 nl were pressure injected using a Nanoject II Auto-Nanoliter Injector (Drummond Scientific, Broomall, PA). A pulled glass pipette was backfilled with mineral oil and positioned on the injector. Viral solution was slowly aspirated within the pipette tip without introducing air bubbles and delivered at 27.6 nl every 15 s. Cav2-Cre injected mice were perfused after 3–4 weeks and processed for cryosectioning as for the CTB-injected cases. For confocal imaging of Cre-activated tdTomato fluorescence, sections were cut at 50 μm and antibody staining was performed in floating sections. A list of antibodies used to detect endogenous antigens and injected CTB appears in Table 1. The antibodies to neuropeptides and enzymes in neurotransmitter synthesis pathways showed patterns of cellular staining consistent with in situ hybridization patterns for the corresponding genes. Antibodies to CTB showed no signal in the absence of injected CTB.
TABLE 1.
Table of primary antibodies used
| Antigen | Immunogen | Manufacturer | Dilution |
|---|---|---|---|
| Choline acetyltransferase | Human placental ChAT | EMD Millipore (Billerica, MA), goat polyclonal, AB144P RRID: AB_2079751 |
1:200 |
| Tyrosine hydroxylase | Denatured rat TH | EMD Millipore, rabbit polyclonal, AB152 RRID: AB_390204 |
1:2,000 |
| Tryptophan hydroxylase 2 | KLH-conjugated peptide derived from human TPH2 (proprietary) | EMD Millipore, rabbit polyclonal, ABN60 RRID: AB_10806898 |
1:500 |
| Somatostatin-14 | Synthetic peptide | Peninsula Laboratories (San Carlos, CA), rabbit polyclonal, T-4103 RRID: AB_518614 |
1:1,000 |
| Cholera toxin subunit B | Purified toxin subunit (Choleragenoid) | List Biological Labs (Campbell, CA), goat polyclonal, #703 RRID: AB_10013220 |
1:1,000 |
| Cholera toxin subunit B | Purified Choleragenoid | Abcam (Cambridge, MA), rabbit polyclonal, ab34992 RRID: AB_726859 |
1:2,000 |
| Substance P | Substance P conjugated to BSA | EMD Millipore, rat monoclonal, MAB356 RRID: AB_94639 |
1:400; 1:2,000 floating |
3 | RESULTS
3.1 | Overall strategy
In order to determine the specific projections of the IP subnuclei, we first examined a set of cases of AAV anterograde tracing generated as part of the Allen Mouse Brain Connectivity Atlas (Table 2 and Methods). Together, these cases provide a comprehensive set of candidate nuclei that may receive IP efferents. However, each of these cases marked multiple IP subnuclei and labeled some neurons outside the IP. Because completely specific anterograde labeling of IP subnuclei is not technically feasible, the candidate targets of IP efferents were also mapped onto the IP by retrograde tracing. In the retrograde tracing cases the specific IP subnuclei and the habenulo-recipient areas were identified by the use of region-specific antigens and transgenic markers for neurotransmitter systems. Finally, retrograde tracing in transgenically-marked mice also allowed the identification of the neurotransmitter phenotypes of IP neurons projecting to specific targets.
TABLE 2.
Anterograde tracing of IP and MHb efferents
| Case | Allen ID | Cre driver | Targeted expression | Other areas |
|---|---|---|---|---|
| IP | ||||
| IP-a1 | 299761999 | Nos1 | IPR, IPC, IPI, IPL, IPDL | IF, RLi, PN, VTA |
| IP-a2 | 175158844 | none | IPC, IPI, IPL, IPDL | IF, PN, VTA |
| IP-a3 | 304859407 | Drd3 | IPL | IF, RLi, VTA |
|
| ||||
| MHb | ||||
| MHb-a1 | 268321927 | ChAT | vMHb | CA1, DG |
| MHb-a2 | 300843826 | Tac1 | dMHb | CA1, DG, LHb |
3.2 | Anterograde tracing of IP efferents
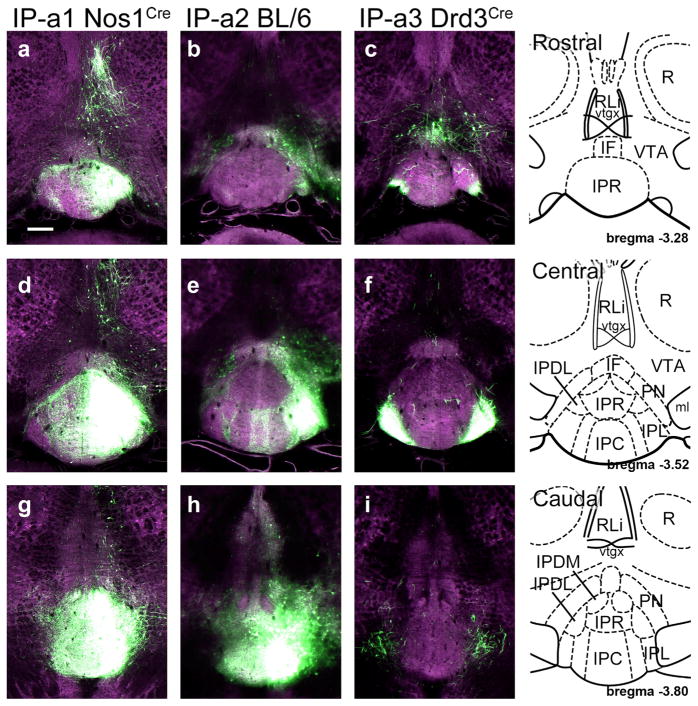
Seven cases of AAV-mediated anterograde tracing of IP efferents were examined in all. Six of these are accessible through the Allen Mouse Brain Connectivity Atlas website, and one did not meet quality standards for inclusion in the database. Cases are available using constitutive expression of EGFP in control C57BL/6 mice, and Cre-activated expression of EGFP in transgenic mice that express Cre recombinase in specific cell types. Three cases were chosen to describe here in detail (Figure 1), based on the relative restriction of the AAV tracer to the IP or specific subnuclei of the IP. Together these cases give nearly comprehensive coverage of the IP, and should label the full extent of the IP efferent pathways.
FIGURE 1.
AAV-EGFP injection sites for the anterograde tracing of IP efferents. The strain information for the injected mice and the case reference numbers from the Allen Mouse Brain Connectivity Atlas for Figures 1–3 appear in Table 1. Reference drawings are from a standard atlas (Paxinos & Franklin, 2001). (a–c) EGFP expression in the rostral part of the IP, consisting mainly of IPR. Only case IP-a1 gives prominent labeling in IPR. The standard atlas coordinate is bregma −3.28. (d–f) EGFP expression in the central part of the IP. Case IP-a1 shows unilateral labeling in all IP subnuclei; IP-a2 predominantly labels IPL and IPDL, while IP-a3 is restricted to bilateral labeling of IPL. The standard atlas coordinate is bregma −3.52. (g–i) EGFP expression in the caudal part of the IP. Case IP-a1 shows labeling in all IP subnuclei. Case IP-a2 shows expression in IPC, IPL, and IPDL, and some spread to adjacent tegmental areas. Case IP-a3 shows fibers of passage originating in IPL. The standard atlas coordinate is bregma −3.80. Scale: (a), 200 μm [Color figure can be viewed at wileyonlinelibrary.com]
Because of the small size of the IP and the lack of any Cre driver that perfectly distinguishes all IP neurons from neurons in surrounding structures, no anterograde tracing case was entirely specific for the IP. A summary of the IP subnuclei labeled in each case, and the sites of ectopic labeling appears in Table 2. IP anterograde case 1 (IP-a1) used a Nos1Cre transgenic line (Methods) that appears to mediate expression in all IP subnuclei, and had the highest overall specificity for the IP (Figure 1a,d,g). Case IP-a2 used constitutive expression of EGFP in C57BL/6 mice without a Cre driver, and labeled IPL and IPC, with relative sparing of IPR (Figure 1b,e,h). Case IP-a3 used a Drd3Cre transgenic line, and gave predominant labeling in IPL (Figure 1c,f,i).
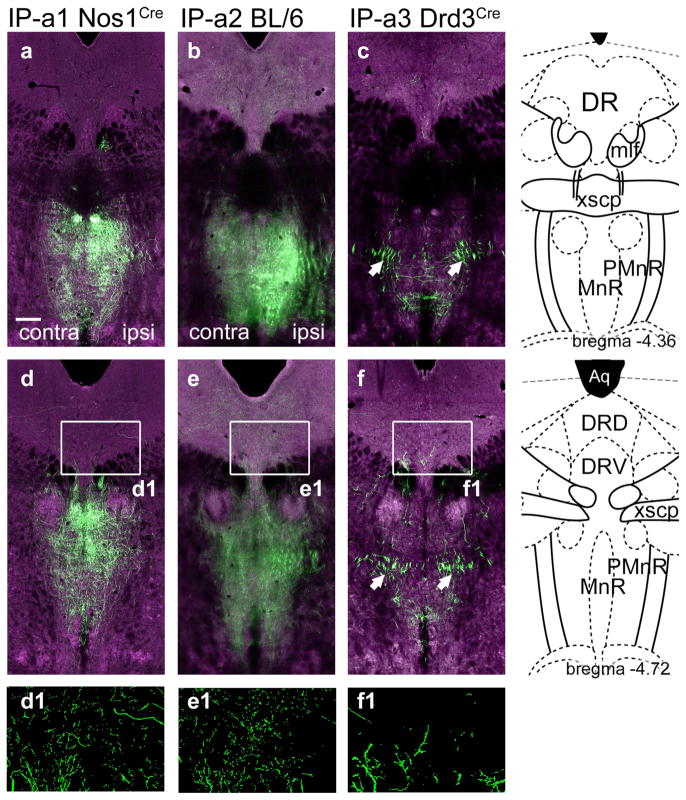
The IP is known to provide inputs to the median and dorsal raphe (MnR, DR). Case IP-a1 and IP-a2 labeled the rostral MnR prominently (Figure 2a,b), mainly off-midline in the PMnR, rather than centrally where the characteristic 5-HT neurons reside. IP-a3 labeled a small region within the PMnR (Figure 2c). Although it is not possible to distinguish terminal fibers from fibers of passage in these images in a definitive way, much of the signal in IP-a3 appears to be in fibers of passage at this level (Figure 2c, arrows). Labeled fibers were sparser in the dorsal raphe (DR, Figure 2d–f), but could be visualized clearly in segmented views in which the local fluorescence signal has been extracted from the digital images (Figure 2d1–f1).
FIGURE 2.
Anterograde labeling of IP projections to the mesencephalic raphe. IP efferents to the midbrain were examined in each of the cases described in Figure 1. (a–c) IP efferents to the MnR/PMnR. The standard atlas coordinate is bregma −4.36. (d–f) IP efferents to the MnR/PMnR and DR. The standard atlas coordinate is bregma −4.72. Some loss of resolution (blurring) in the ventral part of (b) and (e), and also in Figure 3b, represents a technical issue with automated image acquisition and not an actual difference in the distribution of the signal. Arrows in (c, f) indicate bundles of fibers that have the typical appearance of fibers of passage, without varicosities. In (d1–f1) segmented views are shown, in which the local fluorescence signal has been extracted from the digital images to show detail. Scale: (a), 200 μm [Color figure can be viewed at wileyonlinelibrary.com]
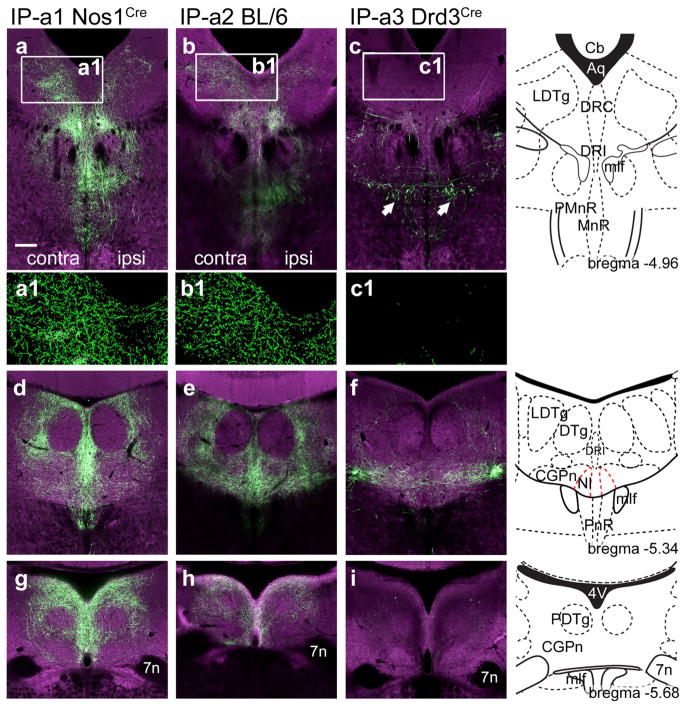
Strong IP innervation of the laterodorsal tegmental nucleus (LDTg) was observed in case IP-a1 and IP-a2, and was predominantly contralateral to the injected side (Figure 3a,b). Few efferents from the IPL reached the LDTg (case IP-a3, Figure 3c). IP-a1 and IP-a2 both showed dense innervation of the central pontine gray (CGPn), including the area that contains the nucleus incertus (NI, Figure 3d,e). The interfascicular part of the dorsal raphe (DRI) was more strongly innervated in case IP-a1 than in IP-a2, suggesting that these fibers originate in IPR, which was strongly labeled in IP-a1 and relatively spared in IP-a2. In contrast, IP-a3 demonstrates that IPL projects to a very specific area of the CGPn, and has minimal fiber terminals in midline structures such as DRI (Figure 3f). None of the IP-labeled fibers projected into the central part of the dorsal tegmental nucleus (DTg, Figure 3d–f). The most caudal fibers projecting from the IP to the tegmentum were found in the caudal pontine gray, at the level where the seventh nerve passes through the pons (Figure 3g–i). Two cases also showed fibers projecting to the medial subnucleus of the inferior olive, but it was not determined whether these fibers originated within the IP (data not shown). Taken together, anterograde tracing gives a comprehensive, composite view of the efferent system of the IP. However, because these viral injections were not entirely restricted to the IP, they may mark some projections that do not originate within this nucleus. Also, with the exception of the IPL in case IP-a3, anterograde tracing cannot reveal the subnuclear specificity of the IP efferents. Thus retrograde tracing from each area of IP innervation was used to refine the map of the IP onto its targets.
FIGURE 3.
Anterograde labeling of IP projections to the dorsal raphe and pontine tegmental area. IP efferents to the DR and pontine tegmentum were examined in each of the cases described in Figure 1. (a–c) IP efferents to the LDTg, DR, and caudal MnR. The standard atlas coordinate is bregma −4.96. In (a1–c1) segmented views are shown, in which the local fluorescence signal has been extracted from the digital images to show detail. (d–f) IP efferents to the LDTg, CGPn, and NI. The standard atlas coordinate is bregma −5.34. (g–i) IP efferents to the caudal CGPn. The standard atlas coordinate is bregma −5.68. Arrows in (c) indicate bundles of fibers that have the typical appearance of fibers of passage, without varicosities. Scale: (a), 200 μm [Color figure can be viewed at wileyonlinelibrary.com]
3.3 | Assessing the habenulo-recipient areas of the IP
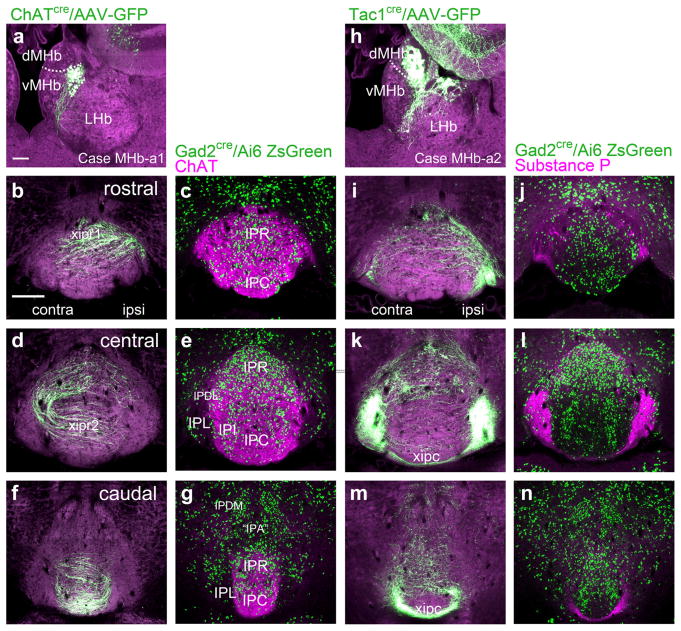
Prior work has established that the cholinergic/glutamatergic neurons of the vMHb project to the central IP subnuclei, and the peptidergic/glutamatergic neurons of the dMHb project to the IPL. In order to more finely map these afferents to the IP, we used a combination of Cre-recombinase mediated anterograde tracing, genetic marking of GABAergic IP neurons, and immunofluorescent staining for the cholinergic and peptidergic markers choline acetyltransferase (ChAT) and SP, respectively. In case MHb-a1, a ChatCre mouse was injected with a Cre-dependent AAV encoding a GFP tracer in the dorsolateral quadrant of the vMHb. Labeling is confined to the vMHb by the expression of the Cre recombinase (Figure 4a). Labeled fibers projected via the ipsilateral fasciculus retroflexus to IPR, where they crossed to the contralateral side (first rostral decussation of the IP, xipr1, Figure 4b). In a matched section, the entire extent of the IP innervated by vMHb afferents was visualized by immunofluorescent staining for ChAT in a Gad2Cre/Ai6 mouse expressing a fluorescent marker, ZsGreen, in GABAergic neurons (Figure 4c). Since the majority of IP neurons are GABAergic, this marker facilitates visualization of the IP subnuclei. The vMHb afferents reached the contralateral IPDL, then underwent a second decussation in IPC (second rostral decussation of the IP, xipr2, Figure 4d,e). In the caudal IP, ChAT terminals appeared mainly in IPC (Figure 4f,g), with few detectable fibers in apical subnucleus (IPA) or IPDM. In case MHb-a2, a Tac1Cre mouse was injected with a Cre-dependent reporter leading to expression in the dMHb and a few neurons on the border of the MHb and lateral habenula (LHb, Figure 4h). A few labeled fibers were noted in IPR, but SP protein expression there was minimal (Figure 4i,j). Unilateral injection of the tracer virus in the dMHb resulted in equal bilateral labeling of IPL encompassing the entire area of SP immunoreactivity (Figure 4k,l). Fibers innervating the contralateral IPL crossed the midline via a caudal pathway (caudal decussation of the IP, xipc, Figure 4m,n). Fibers originating in the dMHb were very sparse in IPA and IPDM. Although a functional significance for the sparse habenula innervation of IPA and IPDM cannot be ruled out, these subnuclei do not seem like strong candidates for mediating a habenulo-peduncular-tegmental pathway.
FIGURE 4.
Medial habenula projections onto the subnuclei of the interpeduncular nucleus. The map of MHb efferents onto IP subnuclei was examined using focal injections of Cre-dependent AAV-GFP into the MHb of ChATcre and Tac1cre mice, and by immunofluorescent staining for ChAT and SP (Tac1 gene product) in mice expressing a ZsGreen reporter in GABAergic neurons (Gad2cre/Ai6 reporter). Unilateral AAV labeling of a small cluster of neurons in each subnucleus allows the course of the fibers, including their decussations, to be traced, while immunofluorescent staining for ChAT and SP allows all of the afferent fibers and their terminals to be labeled. (a) AAV-GFP expression in case MHb-a1, a ChATcre mouse injected in the caudal vMHb (bregma −1.9). The labeled neurons reside in the dorsolateral part of vMHb. Dashed line indicates the dMHb/vMHb border. (b–g) vMHb projections in the rostral, central, and caudal IP, corresponding approximately to bregma −3.4, −3.7, and −3.9, respectively, (b, d, f) matched with the corresponding sections from a Gad2Cre/Ai6 reporter mouse stained for ChAT expression (c, e, g). In (b) vMHb fibers form the first (ipsilateral to contralateral) rostral interpeduncular decussation (xipr1), in (d) vMHb fibers form the second (contralateral to ipsilateral) rostral interpeduncular decussation (xipr2). (h) AAV-GFP expression in case MHb-a2, a Tac1Cre mouse injected in the central part of the dMHb (bregma −1.6). Dashed line indicates the dMHb/vMHb border. Some Tac1Cre-expressing neurons in the hippocampus are also labeled, but do not contribute to the IP projection. (i–n) dMHb projections at the stated levels of the IP (i, k, m) matched with the corresponding sections from a Gad2Cre/Ai6 reporter mouse stained for SP expression (j, l, n). In (m) projections from the dMHb form the caudal interpeduncular decussation (xipc). Scale: (a), 100 μm; (b) 200 μm [Color figure can be viewed at wileyonlinelibrary.com]
3.4 | Retrograde tracing shows little evidence for rostral projections of habenula-recipient IP subnuclei
Based on the map of IP afferents established by anterograde tracing, we then used retrograde methods to confirm each of the target areas (Table 3). Prior studies, performed in rats using classical methods of anterograde tracing, have reported rostrally projecting IP efferents to the subcortical telencephalon (Groenewegen et al., 1986; Shibata & Suzuki, 1984). However, these studies mostly antedate the availability of systematic axial coordinate systems to assess the placement of the anterograde tracers within the IP, and did not determine whether the rostral projections originated in habenula-recipient areas. To assess for rostral IP projections, we first examined cases IP-a1 and IP-a2 for projections to rostral structures. For each case, we used digitally segmented views of the IP projections (Oh et al., 2014) and superimposed them on a standard atlas (Paxinos & Franklin, 2001), for instance as shown in Figure 5a. We observed afferent fibers in some subcortical areas, including areas of the hypothalamus, septum, and hippocampus. However, the pattern of subcortical innervation let us to question whether the origin of the labeled fibers was within the IP, because the density of these projections did not correlate well with the extent of IP labeling, in that IP-a2 showed more rostrally projecting fibers than IP-a1, yet was more restricted in IP expression. IP-a3 showed few projections to rostral locations. To determine the precise origin of the subcortical fibers, we used the rostral projections from IP-a2 as a guide, and injected the retrograde tracer CTB into each potentially IP-recipient area of the hippocampus, septum, and hypothalamus.
TABLE 3.
Retrograde tracing of IP efferents
| Case | Target coordinates | Tracer | Reporter Strain |
|---|---|---|---|
| Hi-r1 | AP −3.15, ML 2.60, DV 4.30, 3.90 | CTB | – |
| S-r1 | AP 0.86, ML 0.20, DV 4.40, 4.10 | CTB | – |
| S-r2 | AP 0.15, ML 0.50, DV 3.10 | CTB | – |
| LH-r1 | AP −0.35, ML 1.10, DV 5.40 | CTB | – |
| LDTg-r1 | AP −5.01, ML −0.38, DV 3.30 | CTB | – |
| LDTg-r2 | AP −5.10, ML 0.30, DV 3.35 | CTB | – |
| PnTg-r1 | AP −5.68, ML 0.20, DV 4.05 | CTB | – |
| PnTg-r2 | AP −5.34, ML 0.05, DV 4.00 AP −5.02, ML 0.05, DV 3.60 |
CTB | – |
| PnTg-r3 | AP −5.45, ML 0.40, DV 4.10 | Cav2-Cre | Ai14 |
| PnTg-r4 | AP −5.60, ML 0.45, DV 4.15 | Cav2-Cre | Ai14 |
| PnTg-r5 | AP −5.60, ML 0.00, DV 4.25 | CTB in green | Ai75 +Gad2cre |
| PnTg-r6 | AP −5.20, ML 0.20, DV 4.25, 3.75 | CTB in green | Ai75 +Gad2cre |
| PnTg-r7 | AP −5.25, ML 0.45, DV 3.50 | CTB | Ai6 +Slc17a6cre |
| PnTg-r8 | AP −5.68, ML −0.20, DV 4.25 | CTB | Ai6 +Slc17a6cre |
| MnR-r1 | AP −4.60, ML 0.00, DV 4.40 | CTB in green |
FIGURE 5.
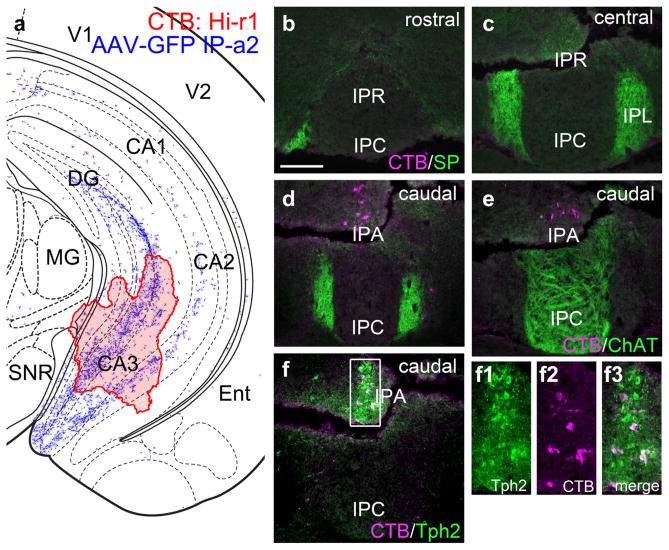
Interpeduncular nucleus projections to the hippocampus. (a) Map of the CTB injection site (red shaded area) for case Hi-r1, labeling the hippocampus, superimposed on the hippocampal area labeled anterogradely from the IP in case IP-a2 (blue fibers). The diagram corresponds to bregma −3.08 in a standard atlas. (b–d) Retrograde labeling of the IP at the designated levels. CTB-labeled neurons appear only in the most caudal part of the IP, IPA, which is not in the area receiving SP-labeled dMHb fibers. (e) Section adjacent to that shown in (d) labeled for CTB and ChAT. CTB-labeled neurons do not appear in the area receiving ChAT-labeled vMHb fibers. (f) Some CTB-labeled neurons are colabeled with Tph2, a marker of serotonergic raphe neurons (see also enlarged inset area). Damage to the fixed tissue evident in (c–f) did not result in tissue loss. Scale: (b), 200 μm [Color figure can be viewed at wileyonlinelibrary.com]
Anterograde tracing in IP-a2 resulted in significant labeling of the hippocampus, most prominently in the CA3 region (Figure 5a). However, retrograde tracing from this area (Case Hi-r1) did not label cells in the IPL, receiving SP fibers from the dMHb (Figure 5b–d), or in IPR/IPC, receiving ChAT labeled fibers from the vMHb (Figure 5e). A small cluster of cells was retrogradely labeled at the caudal pole of the IP, in a region that has been designated IPA (apical), but these lay outside the habenula-recipient areas. Instead, these cells co-labeled with the 5-HT marker Tph2 (Figure 5f), suggesting that they instead are more accurately associated with the median raphe system.
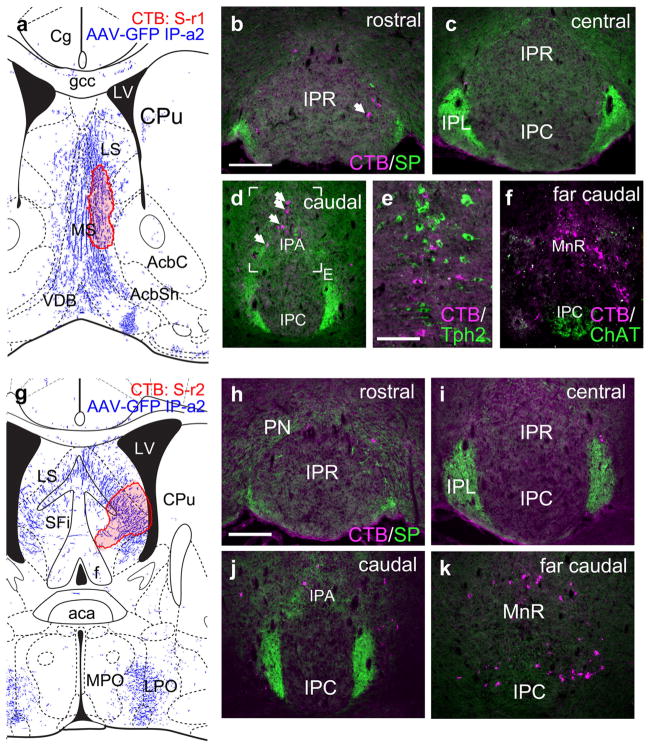
Case IP-a2 also exhibited fiber labeling in the medial septal nucleus (Figure 6a). Retrograde tracing from this region (case S-r1) resulted in an occasional labeled neuron at the margin of IPR (Figure 6b,c), but these were rarely seen. At more caudal levels retrogradely labeled neurons were observed in IPA and in areas flanking the IP, outside the habenulo-recipient region (Figure 6d–f), where labeled neurons were intermingled with, but not identical to, the 5-HT neurons. Similar results were observed for in case S-r2, injected in the lateral septum (Figure 6g–k). Thus, in the anterograde cases IP-a1 and IP-a2 spread of the anterograde tracer into IP-adjacent areas may account for the efferents to the septum.
FIGURE 6.
Interpeduncular nucleus projections to the septal nuclei. (a) Map of the CTB injection site (red shaded area) for case S-r1, labeling the MS. The diagram corresponds to bregma +0.74 in a standard atlas. The pattern of anterograde tracing in IP-a2 is shown in blue. (b–d) Retrograde labeling of the IP at the designated levels. Arrow in (b) indicates a rare example of a labeled neuron within any of the principal subnuclei. Arrows in (d) indicate retrogradely labeled neurons in IPA. (e) Detail of a section adjacent to that shown in (d), labeled for CTB and Tph2, a marker of 5-HT neurons. The retrograde label marks cells which intermingle with 5-HT neurons. (f) Section of the far caudal IP labeled for CTB and ChAT, a marker of vMHb afferents. CTB-labeled cells are not detected within the habenulo-recipient area of the IP. (g) Map of the CTB injection site (red shaded area) for case S-r2, labeling the LS. The diagram corresponds to bregma +0.02 in a standard atlas. (h–k) Retrograde labeling of the IP at the designated levels. Labeled neurons are rarely detected within the principal subnuclei of the IP. Labeled neurons are detected adjacent to the most caudal part of the IP (k). Scale: (b, h), 200 μm; (e), 100 μm [Color figure can be viewed at wileyonlinelibrary.com]
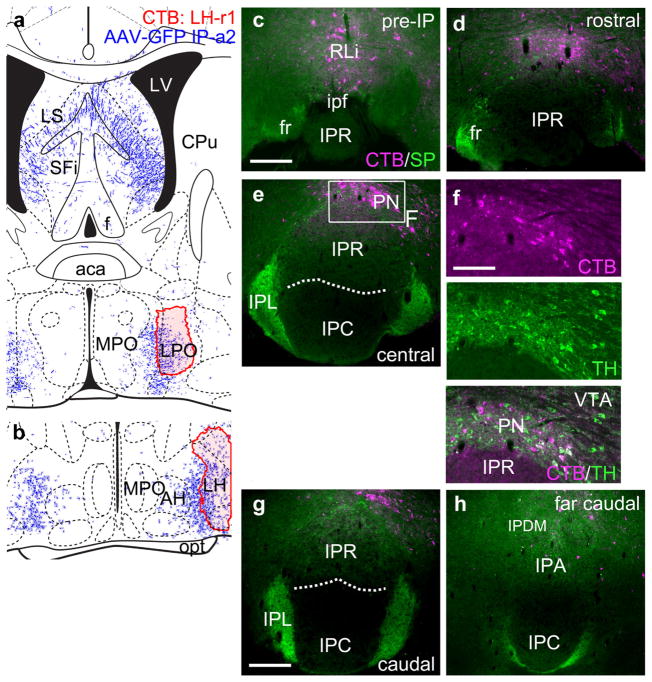
Case IP-a2 also exhibited projections to the hypothalamus including the lateral preoptic area (LPO) and the lateral hypothalamus (LH, Figure 7a,b). Retrograde tracing (Case LH-r1) from these nuclei labeled the IP-adjacent areas rostral linear nucleus of the raphe (Rli) and the paranigral nucleus (PN), but not IPR (Figure 7c–e). Many of the labeled neurons expressed the enzyme of dopamine synthesis tyrosine hydroxylase (TH, Figure 7f), which is not expressed in the IP. At more caudal levels, occasional retrogradely labeled neurons were observed in IPA, but not the habenulo-recipient areas IPR, IPC, or IPL (Figure 7g,h). IP projections to the VTA have also been reported (Klemm, 2004), although the direct evidence for such a projection in rodents is unclear. Injections of CTB into the VTA in mice did not result in retrograde labeling of any IP subnucleus (data not shown), although retrograde labeling of the LHb, as expected, was robust (Quina et al., 2015).
FIGURE 7.
Interpeduncular nucleus projections to the lateral hypothalamus and lateral preoptic area. (a, b) Map of the CTB injection site (red shaded area) for a single case LH-r1, that labeled the lateral preoptic area (a) and lateral hypothalamus (b). The diagrams correspond to bregma 0.02 and −0.34 in a standard atlas, respectively. The pattern of anterograde tracing in IP-a2 is shown in blue. (c–e) Retrograde labeling of the rostral and central IP. Labeling is evident in the RLi and PN, but absent in the IP. Boxed area shows approximate region for the following figure, an adjacent section. (f) Detail of the PN in a section adjacent to that shown in (e), stained for CTB and TH, demonstrating that some of the labeled neurons are dopaminergic, and reside in an area where dopaminergic neurons predominate. (g, h) Retrograde labeling of the caudal IP. Occasional labeled neurons are observed in IPA. Scale: (c, g), 200 μm; (f), 100 μm [Color figure can be viewed at wileyonlinelibrary.com]
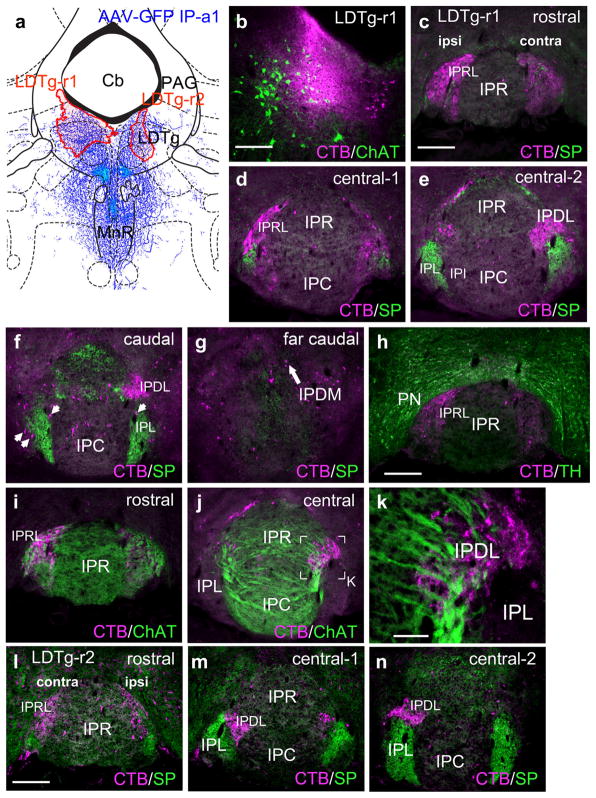
Having largely ruled out rostral projections of the habenulo-recipient IP subnuclei, we examined several cases in which retrograde tracers were placed in caudal structures. As a guide to the injection sites, we used the anterograde case IP-a1, which gave the strongest fiber labeling in the raphe and tegmentum (Figure 3). Previously we have shown that neurons in IPR and IPC project prominently to midline structures in the tegmentum, including the MnR and caudal parts of the DR (Hsu et al., 2013), and in the present study we emphasized the projections of the lateral IP subnuclei. Two injections of CTB into the rostral part of the LDTg (LDTg-r1, LDTg-r2, Figure 8a) were examined, with different extents of labeling. In LDTg-r1 the injected label spread into the region of LDTg containing cholinergic neurons (Figure 8b). In both cases, strong ipsilateral retrograde labeling was observed in the rostral IP, in a region dorsolateral to that usually designated IPR (Figure 8c,d). Because this region is not annotated in standard atlases, we have designated it IPRL (interpeduncular nucleus, rostrolateral). The central IP exhibited strong contralateral labeling in IPDL (Figure 8e,f), which has been previously described (Hsu et al., 2013). Occasional retrogradely labeled cells were noted in IPDM (Figure 8g), which projects mainly to midline structures (see below). Because IPRL is immediately adjacent to the dopaminergic PN, we examined sections for TH expression, but TH did not co-localize with the retrograde labeling (Figure 8h). The retrogradely labeled neurons in IPRL and IPDL were embedded in a region staining for ChAT-expressing fibers, indicating that they are in the vMHb-recipient region of the IP (figure 8i–k). Similar results were obtained in case LDTg-r2 (Figure 8l–n), but the lateralization of the labeled cells was less complete, probably because the injection was placed closer to the midline. Few of the IP neurons retrogradely labeled from the LDTg were within the SP-labeled areas receiving input from the dMHb.
FIGURE 8.
Interpeduncular nucleus projections to the lateral dorsal tegmental nucleus. (a) Map of the CTB injection sites (red shaded areas) for two cases labeling the LDTg, in opposite hemispheres. The diagram corresponds to bregma −5.02 in a standard atlas. The pattern of anterograde tracing in IP-a1 is shown in blue. (b) Detail of injected area in case LDTg-r1, showing overlap of injected area with ChAT-expressing cholinergic neurons in LDTg. (c–g) Retrograde labeling of the IP subnuclei in case LDTg-r1 at the designated levels. Labeling predominates in IPRL, ipsilateral to the injection, and IPDL contralateral to the injection. A small number of labeled neurons are located on the periphery of SP-labeled afferent fibers in IPL bilaterally (arrows, f). (h) Retrograde labeling of the rostral IP in case LDTg-r1. TH staining reveals dopaminergic neurons of the PN, which does not overlap the retrograde labeling within IPRL. (i–k) Relationship of retrograde labeling in case LDTg-r1 to ChAT-labeled afferent fibers in IPR, IPC, and IPDL. A confocal detail image of the boxed area in (j) appears in (k). (l–n) Retrograde labeling of the IP subnuclei in case LDTg-r2. In this case, injected closer to the midline, IPRL is labeled bilaterally (l), while IPDL labeling is still predominantly contralateral (m, n). Scale: (b, c, h, l), 200 μm; (k), 50 μm [Color figure can be viewed at wileyonlinelibrary.com]
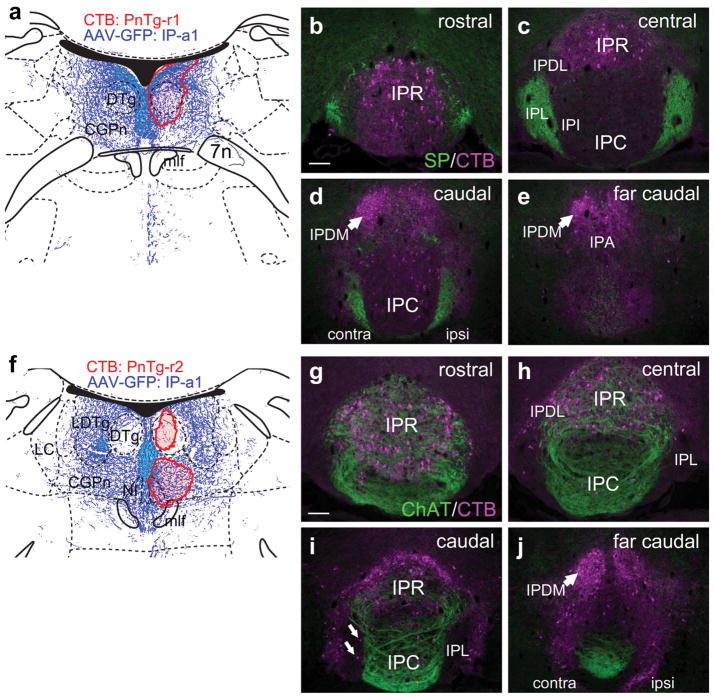
Retrograde tracing was also performed from the caudal part of the pontine tegmentum, including the CGPn and the NI. Both PnTg-r1 and PnTg-r2 were unilateral injections, but near the midline. Although the CTB injections also incorporated the DTg nucleus proper, few IP fibers terminate there. Case PnTg-r1, placed near the most caudal extent of the IP projection system (Figure 9a), labeled large neurons in IPR symmetrically (Figure 9b,c). IPDM was also strongly labeled, but only on the contralateral side (Figure 9d,e). Labeled neurons were sparse in IPC/IPI and absent from IPL. Case PnTg-r2, placed somewhat more rostrally (Figure 9f), gave a similar pattern of labeling in IPR and IPDM (Figure 9g–j), but also labeled a few neurons in IPL (Figure 9i). As expected, labeled neurons in IPR were within the area of the IP receiving cholinergic fibers from the vMHb, while labeled neurons in IPDM were not (Figures 9g,h,j).
FIGURE 9.
Interpeduncular nucleus projections to the medial pontine tegmentum. (a) Map of the CTB injection site (red shaded area) for the DTg and surrounding afferent IP fibers in case PnTg-r1. The diagram corresponds to bregma −5.68 in a standard atlas. (b–e) Retrograde labeling of IP subnuclei in case PnTg-r1. Labeling predominates in IPR and IPDM (arrows in d, e), and is sparse in IPC and IPL. Only rare labeled cells are seen in the IPL, containing dMHb fibers marked by SP. (f) Map of the two closely spaced CTB injection sites (red shaded area) for the CGPn and NI in case PnTg-r2. The diagram corresponds to bregma −5.40 in a standard atlas. (g–j) Retrograde labeling of IP subnuclei in case PnTg-r2. Most labeled cells are in the IPR and IPDL, containing vMHb fibers marked by ChAT. Only rare labeled cells are seen in the IPL (arrows, i). The IPDM is strongly labeled by CTB (j), but contains few MHb fibers. Scale: (b, g), 100 μm [Color figure can be viewed at wileyonlinelibrary.com]
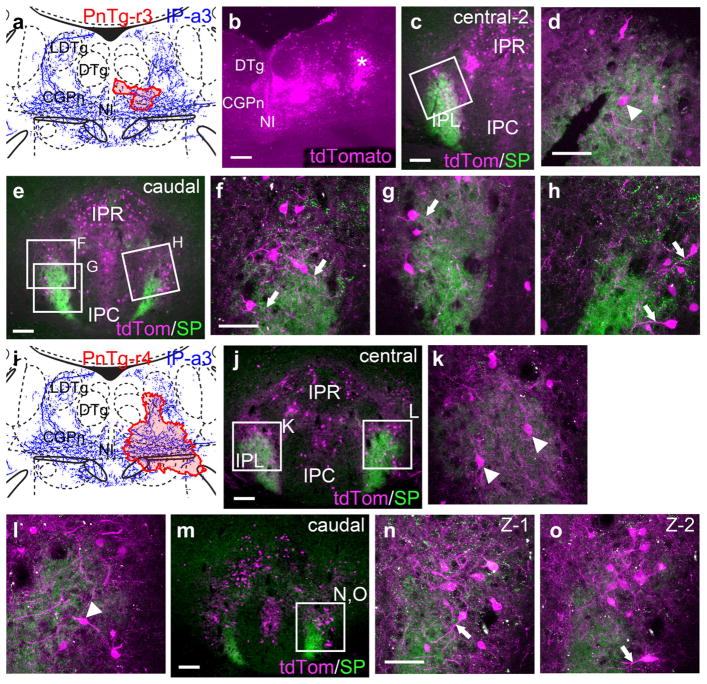
Case IP-a3 strongly labeled IPL, and the efferent IP fibers in this case project mainly to a region of the pontine tegmentum, lateral to the nucleus incertus, that is not specifically named in standard atlases (Figure 3f). Preliminary injections of CTB in this area sometimes labeled cell bodies in IPL, within the region receiving SP-expressing dMHb fibers, but these fibers terminate in a cell-poor area (Figure 4l), and such cells were sparse. Thus, we wondered if the neurons on the margins of IPL might extend processes into the dMHb-recipient area, potentially to receive habenular input. CTB labeling is inadequate for this purpose because of its limited distribution in the cell, confined mainly to the cell soma and particularly the area near the axon origin. In order to better examine the morphology of retrogradely labeled neurons in or near IPL, we combined a Cre-dependent transgenic reporter strain, Ai14, with a retrogradely transported virus, Cav2-Cre. Ai14 encodes a strong cytoplasmic tdTomato reporter which effectively fills the cell soma and processes (Madisen et al., 2010). Case PnTg-r3 consisted of a small Cav2-Cre injection in the CGPn and NI (Figure 10a). Confocal imaging of retrogradely labeled cells and their processes showed some cell bodies clearly within the dMHb-recipient area of IPL (Figure 10b,c). However, neurons located just dorsal and lateral to the dMHb-recipient area frequently extended processes into the region with SP-expressing dMHb fibers (Figure 10e–h). Some or all of these processes are likely to be dendrites, particularly because the axons of these neurons run in a caudal direction (i.e., toward the injected area), perpendicular to the plane of section. A second case, PnTg-r4, with a more extensive Cav2-Cre injection, gave similar results (Figure 10i–o).
FIGURE 10.
Interpeduncular nucleus projections to the lateral pontine tegmentum. In order to effectively label IP neurons and their processes, a transgenic reporter line ROSA-lsl-tdTomato (Ai14) was used. tdTomato expression was induced by retrograde transport of Cav2-Cre virus injected into the pontine tegmentum. (a) Map of the Cav2 injection site (red shaded area) for case PnTg-r3, labeling a small area of the CGPn. The diagram corresponds to bregma −5.52 in a standard atlas. (b) Cre-induced expression of tdTomato at the site of the Cav2-Cre injection. Labeled cells far lateral to the injection site (asterisk) probably represent retrograde labeling within the plane of the section, rather than spread of the injected virus. (c, d) Low power (c) and confocal (d) images of the central IP in case PnTg-r3. A labeled cell body within the IPL is indicated by the arrowhead. (e–h) Low power (e) and confocal (f–h) images of the caudal IP in case PnTg-r3. Neural processes (probably dendrites) that extend into the habenulo-recipient area of the IPL from its periphery are marked with arrows. (i) Map of the Cav2-Cre injection site (red shaded area) for case PnTg-r4, labeling a more extensive area of the CGPn and adjacent structures. (j–l) Low power (j) and confocal (k, l) images of the central IP in case PnTg-r4. (m–o) Low power (m) and confocal (n, o) images of the caudal IP in case PnTg-r4. (n, o) show two confocal Z-stacks acquired at different depths of the same region boxed in (m). Scale: (b, c, e, j, m), 100 μm; (d, f, k, n), 50 μm [Color figure can be viewed at wileyonlinelibrary.com]
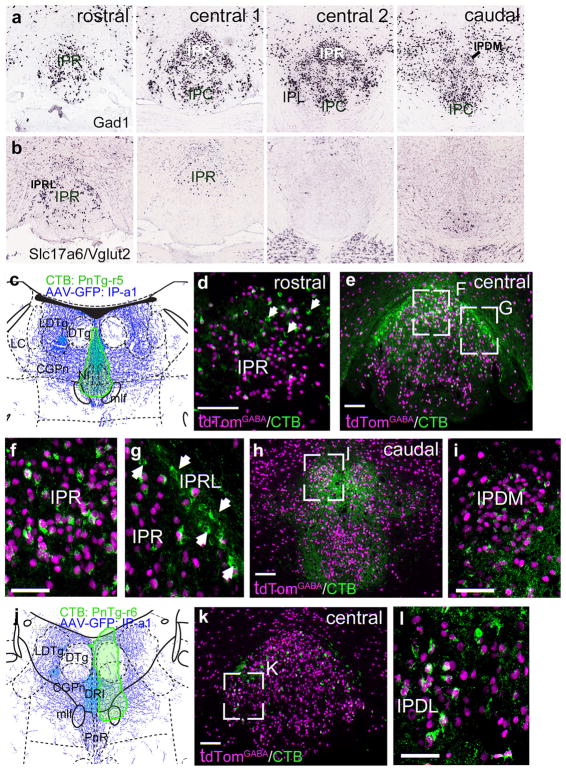
With the basic map of IP afferents and efferents in place, we next addressed the neurotransmitter phenotypes of the IP neurons within the subnuclei projecting to specific targets. The IP is predominantly GABAergic, and expression of mRNA for the GABAergic marker Gad1 is found in all IP subnuclei (Figure 11a). However, the glutamatergic marker Slc17a6 (Vglut2) reveals that a significant number of glutamatergic neurons are present in IPR, IPRL and the most caudal part of IPC (Figure 11b). In contrast, glutamatergic neurons are rarely found in IPL or most of IPC/IPI. In order to determine the specific projections of GABAergic IP neurons we performed retrograde tracing in mice bearing a Gad2Cre-driver crossed with the fluorescent reporter line Ai75, which conditionally expresses nuclear tdTomato (Methods). Case PnTg-r5 (Figure 11c), consisted of a large CTB injection into the midline of the pontine tegmentum of such a reporter mouse, incorporating the NI and CGPn. This revealed, as expected, that the majority of the retrogradely labeled neurons in IPR (Figure 11d–f), were GABAergic. However, in the rostral IPR (Figure 11d) and in the IPRL (Figure 11g), a significant number of CTB-labeled neurons did not express tdTomato, suggesting that they were glutamatergic. Retrogradely labeled neurons in IPDM appeared uniformly GABAergic (Figure 11h,i). Case PnTg-r6, injected unilaterally in the CGPn (Figure 11j), strongly labeled IPDL, where only GABAergic retrogradely labeled neurons were identified (Figure 11k,l).
FIGURE 11.
Neurotransmitter phenotypes of IP neurons: tegmental projections of GABAergic neurons. In order to label GABAergic neurons throughout the brain, a Gad2cre driver line was interbred with ROSA-lsl-nls-tdTomato (Ai75), a mouse strain that gives conditional nuclear expression of tdTomato (Methods). (a, b) In situ hybridization for Gad1 (a) and Slc17a6 (Vglut2, b) marks GABAergic and glutamatergic neurons in the IP, respectively. GABAergic neurons appear in all subnuclei. Glutamatergic neurons are noted in IPR, IPRL and the most caudal part of IPC, and appear to be absent from the other subnuclei. Images are derived from Allan Brain Atlas data sets. Views from rostral to caudal correspond approximately to bregma −3.3, −3.5, −3.7 and −3.9 in a standard atlas. (c) Map of the CTB injection site (green shaded area) for case PnTg-r5, labeling the midline CGPn and NI. The diagram corresponds to bregma −5.40 in a standard atlas. (d–f) Conventional (d, e) and confocal (f, g) images of the central IP in case PnTg-r5. In the most rostral IPR (d) some of the CTB-labeled neurons lack nuclear expression of tdTomato, indicating that they are not GABAergic (arrows). In the central IPR (f), nearly all of the CTB-labeled neurons express tdTomato. In the IPRL (g), several clustered neurons are negative for tdTomato. (h, i) Low power (h) and confocal (i) images of the caudal IP in case PnTg-r5. (j) Map of the CTB injection site (green shaded area) for case PnTg-r6, labeling the lateral CGPn. The diagram corresponds to bregma −5.20 in a standard atlas. (k, l) Conventional (k) and confocal (l) images of the central IP in case CGPn-r6. Scale: (d, e, h, k) 100 μm; (f, i, l) 50 μm [Color figure can be viewed at wileyonlinelibrary.com]
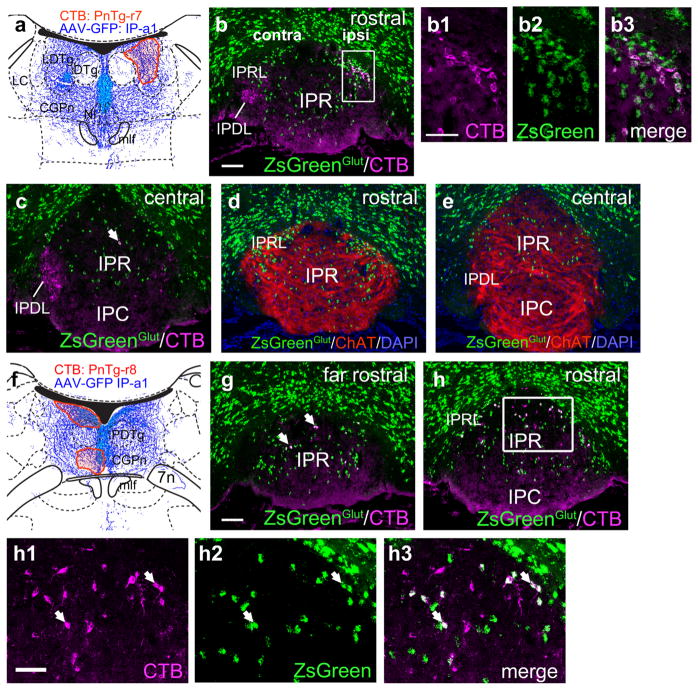
In order to assess whether neurons not labeled by Gad2Cre were in fact glutamatergic, we used an Slc17a6Cre (Vglut2) driver line interbred with the reporter line Ai6 to mark all glutamatergic neurons in the IP (Methods). To specifically determine the projection targets of the glutamatergic neurons, retrograde tracing with CTB was then performed from the LDTg and the central part of the CGPn. Case PnTg-r7, injected in the LDTg (Figure 12a), showed that the ipsilaterally projecting neurons in IPRL are predominantly glutamatergic, whilst contralaterally projecting IPDL neurons are negative for Slc17a6, confirming that they are entirely GABAergic (Figure 12b). A very small number of cells in IPR were also labeled from this site (Figure 12c). Adjacent sections were stained for Chat immunoreactivity, and demonstrate that the glutamatergic IP neurons projecting from IPRL to the LDTg are within the area that receives afferents from vMHb (Figure 12d,e). Case PnTg-r8, injected in the CGPn, near the midline (Figure 12f), labeled glutamatergic neurons predominantly in the rostral part of IPR, with some labeled neurons in IPRL (Figure 12g,h). From this injection near the midline, IPRL neurons were labeled bilaterally, rather than exclusively on the ipsilateral side, as in case PnTg-r7. Taken together, the in situ hybridization data for Gad2 and Slc17a6 and these retrograde tracing studies demonstrate both excitatory and inhibitory efferents from specific IP subnuclei to the pontine dorsal tegmentum.
FIGURE 12.
Neurotransmitter phenotypes of IP neurons: tegmental projections of glutamatergic neurons. In order to label glutamatergic neurons throughout the brainstem, a Slc17a6Cre (Vglut2) driver line was interbred with ROSA-lsl-ZsGreen (Ai6), a mouse strain that gives conditional expression of ZsGreen (ref). (a) Map of the CTB injection site (red shaded area) for case PnTg-r7, labeling the LDTg. The diagram corresponds to bregma −5.40 in a standard atlas. (b) Conventional and confocal (boxed area in b1–b3) images of the rostral IP in case CGPn-r7. Several retrogradely labeled neurons in IPRL are glutamatergic. (c) The central IP in case PnTg-r7. A single double-labeled neuron is detected in IPR at this level (arrow). None of the contralaterally projecting IPDL neurons are glutamatergic. (d, e) Sections adjacent to (b, c) labeled for ChAT to reveal vMHb afferents. The IPRL and IPR glutamatergic neurons are within the habenulo-recipient area. (f) Map of the CTB injection site (red shaded area) for case PnTg-r8, labeling the medial/caudal part of the CGPn. The diagram corresponds to bregma −5.68 in a standard atlas. The injected label is excluded from the core of the DTg but labels fibers above and below this region. (g) CTB labeling in the far rostral IP in case PnTg-r8. Arrow indicates an example of a CTB-labeled glutamatergic neuron at this level. (h) Conventional and confocal (boxed area in h1–h3) images of the rostral IP; arrows show examples of numerous glutamatergic neurons at this level. Scale: (b, g) 100 μm; (b1, h1) 50 μm [Color figure can be viewed at wileyonlinelibrary.com]
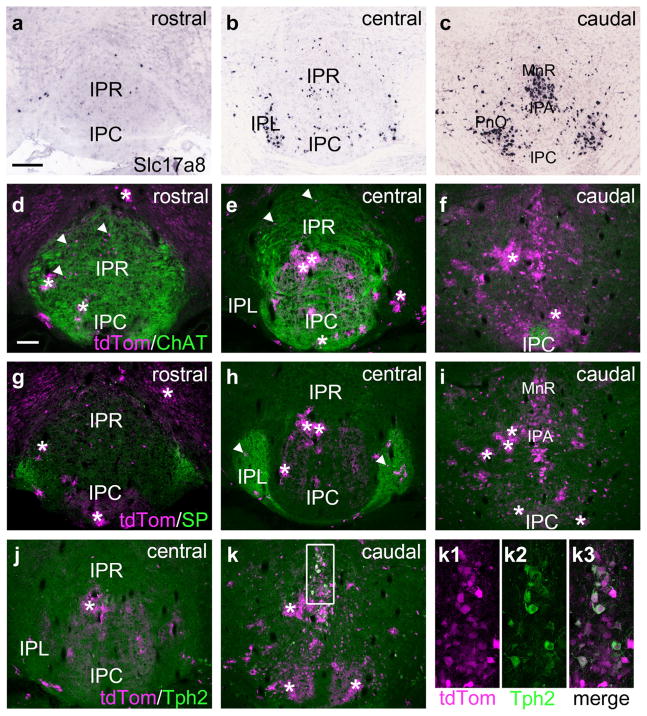
Glutamatergic neurons can also express Slc17a7 (Vglut1), but this is predominantly expressed in neocortical structures, and Slc17a7 mRNA was not detectable in the IP (data not shown). Recent work has shown that a third more distantly related transporter, Slc17a8 (Vglut3) can also package glutamate for synaptic release (Liu et al., 2014). A small number of cells expressing Slc18a8 mRNA can be found within IPR (Figure 13a,b). These cells become more numerous near the caudal part of the nucleus, either in or just caudal to IPL (Figure 13b), and in the vicinity of IPA, overlapping MnR (Figure 13c). In order to assess whether these neurons reside in the habenulorecipient areas of the IP, we examined mice with an Slc17a8Cre (Vglut3) driver allele and the reporter allele Ai14, In sections stained for ChAT-expressing fibers originating in the vMHb, a small number of Slc17a8 neurons appeared in the habenulorecipient area of IPR (Figure 13d,e). A few neurons that map in or near IPC by in situ hybridization appear to be caudal to the habenulorecipient area (Figure 13b,f). In sections stained for SP-expressing fibers originating the the dMHb, occasional Slc17a8 neurons appeared within the habenulorecipient area (Figure 13g,h), but again most of the labeled cells appeared to reside just caudal to the region receiving habenula input Figure 13i). Because Slc17a8 has been associated with serotonergic neurons, we examined the central (Figure 13j) and caudal (Figure 13K) IP for co-localization of the fluorescent reporter and Tph2. Near the midline Slc17a8 neurons frequently coexpressed Tph2. Although this area might anatomically be assigned to IPA in prior work, it is probably better assigned to MnR. Away from the midline, numerous Slc17a8 neurons at the caudal limit of the IP (Figure 13c,f,i,k) appear to be associated with other brain regions such as PnO, not the IP. We conclude that Slc17a8-expressing neurons represent a very small subset of potentially glutamatergic neurons in the habenulorecipient areas of the IP. They may or may not be unique with respect to the Slc17a6-expressing population, but are far less numerous.
FIGURE 13.
Slc17a8 (Vglut3) expression in the interpeduncular nucleus. (a–c) In situ hybridization for Slc17a8 mRNA expression in the IP (Allen Brain Atlas case # 71587918). Results are generally concordant with the pattern of expression using a Slc17a8Cre driver in the subsequent panels. In (b) more Slc17a8 cells are observed in the IPL than expected based on the Cre-driver results. Since no specific marker is available for the IPL in the in situ data, the exact plane of section cannot be determined, and these Vglut3 neurons may lie caudal to the IPL. (d–f) Expression of a tdTomato reporter in a Slc17a8Cre/Ai14 mouse, immunostained for ChAT to reveal vMHb afferents. Slc17a8Cre-driven reporter expression was generally consistent with Vgllut3 mRNA expression, however ectopic expression was observed in sporadically distributed astrocytes (asterisks), which were easily recognized by their patchy morphology. Only rare Slc17a8-expressing neurons were observed in the area of IPR and IPC receiving vMHb fibers, examples are shown by arrowheads in (d, e). In the caudal IP Slc17a8 neurons were abundant, but only caudal to the habenulorecipient areas. (g–i) Sections adjacent to those in (d–f) immunostained for SP to show dMHb afferents. (j–k) Sections adjacent to those in (g–i) immunostained for Tph2 to reveal 5HT-expressing neurons. Confocal images in (k1–k3) show co-localization of tdTomato and Tph2 in slc17a8Cre neurons. Scale: (a) 200 μm; (b) 100 μm [Color figure can be viewed at wileyonlinelibrary.com]
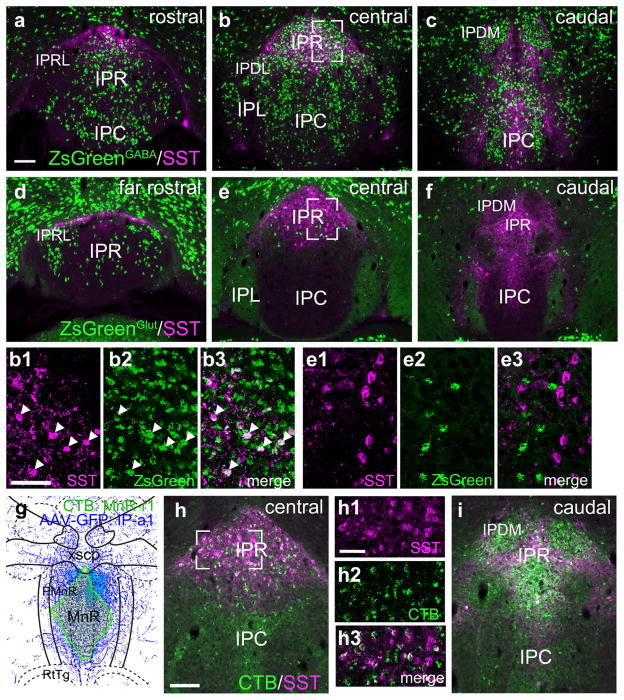
The IP also contains a subset of somatostatin (SST) expressing neurons. Previously it has been shown that these neurons coexpress mRNA for the Chrna5 nicotinic receptor subunit (Hsu et al., 2013). In other work, a role for the SST+ IP neurons has been proposed in mediating physical signs of nicotine withdrawal (Zhao-Shea et al., 2013). SST+ IP neurons were confined to a subdomain of IPR (Figure 14), and neither their cell bodies nor processes were observed in the other habenulo-receptive IP subnuclei. To assess the principal neurotransmitter phenotype of the SST+ IP neurons, we examined SST expression in GABAergic (Figure 14a–c) and glutamatergic neurons (Figure 14d–f), which are intermingled in IPR, using Cre-mediated transgenic reporters. SST expression was observed exclusively in GABAergic neurons. It has been previously shown that the Chrna5-expressing neurons in IPR are GABAergic projection neurons that innervate the MnR, DRI, and adjacent structures (Hsu et al., 2013). Retrograde CTB labeling in case MnR-r1, injected in the central part of MnR and extending to PMnR (Figure 14g–i), shows that SST+ neurons in IPR also project to the midline raphe, rather than participating exclusively in local circuits. Neurons within the adjacent IPDM project to the same area, but do not express SST (Figure 14i).
FIGURE 14.
Somatostatin expression defines a subset of GABAergic projection neurons in caudal IPR. (a–c) A Gad2cre driver line was interbred with the reporter line Ai6 in order to label all GABAergic neurons with the marker ZsGreen. ZsGreen was colocalized with SST by immunofluorescence in the rostral (a), central (b) and caudal (c) IP. SST+ IP neurons define a caudal division of IPR. A small number of SST+ cell bodies are also found in IPC and IPL. 35/37 of the SST+ neurons in IPR in the section shown in (b) co-expressed ZsGreen. Images (b1–b3) show confocal detail of the area boxed in (b). Arrowheads indicate examples of SST+ GABAergic cell bodies with clear nuclear outlines. (d–f) A Slc17a6Cre driver line was interbred with the reporter line Ai6 in order to label all glutamatergic neurons with the marker ZsGreen. ZsGreen was colocalized with SST by immunofluorescence in the rostral (d), central (e) and caudal (f) IP. 0/61 SST+ neurons in IPR in the section shown in (e) expressed ZsGreen. Images (e1–e3) show confocal detail of the area boxed in (e). (g–i) Retrograde tracing of efferent projections of SST+ IPR neurons. (g) Map of the CTB injection site for case MnR-r1, a midline injection encompassing much of MnR. The diagram corresponds to bregma −4.60 in a standard atlas. (h) CTB labeling in the central IP in case MnR-r1. Confocal images (h1–h3) of the boxed area show that numerous SST+ neurons in IPR are retrogradely labeled at this level. (i) CTB labeling in the caudal IP. IPDL exhibits strong retrograde labeling but does not express SST. Scale: (a, h) 100 μm; (b1, h1), 50 μm [Color figure can be viewed at wileyonlinelibrary.com]
4 | DISCUSSION
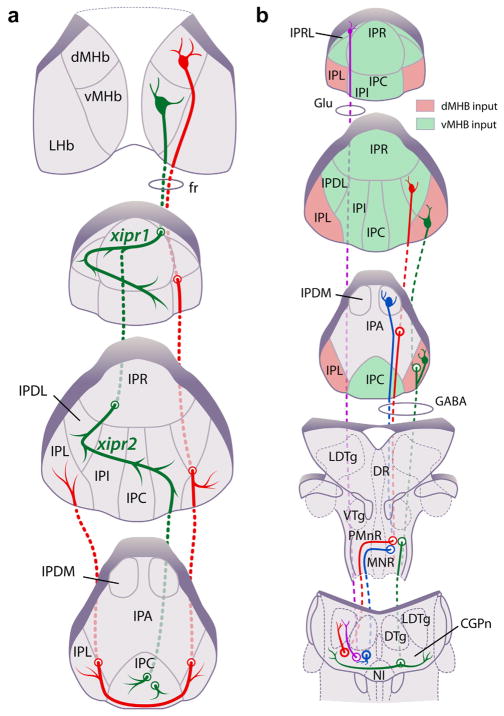
The present study addresses three limitations of past studies of the organization of the IP subnuclei in the habenulopeduncular pathway. First, we have placed the retrogradely labeled neurons in each of the IP subnuclei in the context of their relationship to specific afferents from the dMHb and vMHb, marked by SP and ChAT respectively, thus defining the second-order targets of the MHb subnuclei (Figure 15a). The MHb map onto the IP can be further refined by considering the projections of populations of vMHb neurons that express specific nicotinic receptor subunits, particularly those expressing the Chrna4 subunit, found mainly in the lateral MHb and projecting to the caudal IP, and those expressing the Chrnb3 subunit, preferentially expressed in the medial MHb and projecting to the rostral IP (Shih et al., 2014). Specific expression in parts of the habenulopeduncular pathway is also observed for the mu opioid receptor (Gardon et al., 2014), and the projections of habenula neurons expressing “orphan” receptor Gpr151 (Broms, Antolin-Fontes, Tingstrom, & Ibanez-Tallon, 2015). Second, we have for the first time identified the neurotransmitter phenotype (excitatory and inhibitory) of IP neurons that innervate specific pontine targets (Figure 15b). Third, we have placed the IP subnuclei in a coordinate system based on a standard atlas (Paxinos & Franklin, 2001), in order to facilitate the comparison of the subnuclear structure of the IP across studies, and allow targeting of the identified cell groups for injection or recording. Taken together, the results presented here form a basis for the functional manipulation of the specific elements of the habenulopeduncular pathway, particularly in mice using Cre recombinase-expressing transgenic lines.
FIGURE 15.
Afferent and efferent connections of the habenulo-recipient IP subnuclei. (a) Map of MHb afferents projecting to the IP subnuclei. ChAT-expressing vMHb fibers are depicted in green, and SP-expressing dMHb fibers in red. Two decussations of vMHb fibers occur in the rostral 2/3 of the IP (xipr1, xipr2). The decussation of the dMHb fibers occurs along a ventral pathway in the caudal IP (xipc); dMHb fibers then turn rostrally to innervate the contralateral IPL. (b) Map of IP subnuclear projections to the pontine tegmentum. Projections of the IPR to midline structures have been previously described (Hsu et al., 2013), and are omitted for clarity. Areas receiving cholinergic vMHb fibers are depicted in green, and areas receiving peptidergic dMHb fibers in red. Uncolored areas do not appear to receive a strong input from either of these MHb neuron populations. The projection from IPRL is predominantly glutamatergic. IPR also contains some glutamatergic projection neurons (not shown). The projections of the habenulo-recipient IP subnuclei are otherwise GABAergic. Fibers from unilateral injections of the IP appear to decussate at the level of MnR (case IP-a1, IP-a2) except for fibers originating in IPL, which decussate more caudally (case IP-a3). However, the specific course of the fibers of passage and the location of midline crossings have not been precisely determined for all of the subnuclei [Color figure can be viewed at wileyonlinelibrary.com]
4.1 | Ascending projections
The existing literature is somewhat unclear regarding ascending projections of the IP. The anterograde tracing studies described here (IP-a1 to a3) labeled some ascending projections, but to a variable degree, and in all of these cases the viral tracer spread to some areas adjacent to the IP. In contrast, our initial results for anterograde tracing of IP projections using specific Cre drivers yielded exclusively descending projections (Hsu et al., 2013). Previous studies in the rat have identified projections from the IP to several areas of the ventral forebrain. In one such study, anterograde tracing from the IPA, the most caudal IP subnucleus, produced labeling in the hippocampus, medial septum, diagonal band, and mediodorsal thalamus (Groenewegen et al., 1986). Retrograde tracing from the hippocampus produced labeling in the IPA, but little labeling in other IP regions. Similar results showing retrograde labeling of this caudal area from the hippocampus have been obtained by others (Shibata & Suzuki, 1984). The region labeled in these studies appears to correspond to the mouse IPA, similar to that shown in Figure 5d–f, plus very caudal/ventral domains that may lie outside the region designated IP in standard atlases. In two prior studies, the neurons projecting from IPA to the hippocampus were specifically described as serotonergic, although this did not lead the authors to reassign these neurons to the raphe (Montone, Fass, & Hamill, 1988; Wirtshafter, Asin, & Lorens, 1986).
Previous work has also reported retrograde tracing of projections from the IP to the medial septum, lateral septum, and vertical limb of diagonal band (Vertes, 1988; Vertes & Fass, 1988). These studies showed predominant labeling the IPA and more lateral neurons at this level, and very sparse labeling in more rostral IP subnuclei. These results appear consistent with our results for the septal nuclei shown in Figure 6j,k. The region designated IPA in these studies is continuous with the median raphe, which has known projections to the hippocampus and to all of the septal structures described as receiving IPA input (Vertes, Fortin, & Crane, 1999). Consistent with this, our retrograde tracing studies show that the caudal IP neurons projecting to rostral structures either are, or are intermingled with, serotonergic neurons (Figures 5f and 6e). Furthermore, the IPA neurons projecting to the hippocampus and septal nuclei do not reside in areas that receive input from either the cholinergic vMHb or the peptidergic dMHb (although we cannot completely exclude that IPA neurons might have dendrites within those receptive fields). These findings suggest that the IPA and its ascending projections should be assigned to the raphe system, rather than the habenulopeduncular system. This has significant implications for the interpretation of behavioral/pharmacological studies where an IP-hippocampal circuit might be invoked.
Anterograde tracing of IP efferents in the present work, as well as in a past study (Groenewegen et al., 1986), has also identified ascending projections to the LH and LPO. However, retrograde tracing from LH/LPO (Figure 7), demonstrates that these projections originate not from the IP but from the nearby paranigral nucleus, part of the tegmental dopamine system. No LH/LPO projecting neurons were observed within the habenulo-recipient areas of the IP. Thus, taken together, our examination of the IP efferent system reveals few if any ascending projections that would be candidates for a direct habenulopeduncular output to the ventral forebrain. The ascending projections of the “IP” that have been previously identified may be better described as part of the ascending 5-HT and DA systems.
4.2 | Descending IP projections to the pontine tegmentum: specificity, lateralization, and “sign” of the circuit output
In previous work, we have focused on Chrna5-expressing IP neurons in IPR that project to midline structures including the MnR/PMnR and the DRC/DRI (Hsu et al., 2013). In the present study, we have completed the picture of IP efferent pathways with a focus on the lateral IP subnuclei including IPDL and IPL, which contain few Chrna5-expressing neurons, and project to tegmental structures away from the midline (Figure 14b). One previously unappreciated aspect of the IP circuitry, revealed here, is that the projections from the IP to LDTg originate from discrete IP subnuclei, and are highly lateralized. The LDTg receives a strong mainly ipsilateral projection from the IPRL, lying between the IPR and paranigral nucleus. This area is clearly distinct in its connectivity from the main body of IPR, although like the IPR, it receives cholinergic input from the vMHb. Of all the IP nuclei, the IPRL is richest in excitatory neurons and relatively poorest in inhibitory neurons, and the projection from IPRL to LDTg is predominantly glutamatergic. In contrast, the LDTg receives a predominantly contralateral projection from the IPDL, and these neurons are entirely GABAergic.
Although the IPRL is not identified in standard atlases (Paxinos & Franklin, 2001), it may correspond to a group of cells closely associated with the fasciculus retroflexus, identified as the “interstitial subnucleus” of the IP in the rat (Lenn & Hamill, 1984). Although the projections of IPRL have not been described, the contralateral IPDL >LDTg projection shown here is consistent with a prior study in the rat (Shibata & Suzuki, 1984). Although it is yet not known whether the ipsilateral, excitatory IPRL >LDTg and the contralateral, inhibitory IPDL >LDTg pathways converge on the same postsynaptic neurons, this arrangement immediately suggests the enhancement of a lateralized signal to this region, in that a signal originating in the right IP will send a “go” signal to the right LDTg, and a coordinated “stop” signal to the left LDTg.
Lateralization of glutamatergic and GABAergic pathways from the IP to the pontine tegmentum suggest potential roles for this circuit in spatial orientation or the directional control of locomotion. Recordings from IP neurons of rats executing a pellet-chasing task have not shown correlation with head direction, but show increased firing rate with average running speed, integrated over relatively long intervals (Sharp, Turner-Williams, & Tuttle, 2006), Unlike head direction, speed is a function that would not necessarily require lateralized information. The IP recordings in these studies were not assigned to specific subnuclei. Lesions of the IP may also impact a known limbic circuit activated by head direction (Bassett & Taube, 2001; Clark & Taube, 2012). Reciprocal connections between the lateral mammillary nucleus (LM) and the DTg make up the core of this circuitry, which connects in turn to the anterior dorsal thalamic nucleus (AD). Lesions of the IP in rats disrupt the normal firing properties of head direction cells in the AD and result in navigational deficits (Clark, Sarma, & Taube, 2009; Clark & Taube, 2009). Lesions in these studies were not assigned to an IP subnucleus, but probably spanned multiple subnuclei. IP input to the DTg has been suggested as an entry point to the head direction circuitry that may explain these results. However, the DTg proper actually receives few direct inputs from the IP (Figure 3d,e), such that IP inputs to the pontine tegmentum have almost no anatomical overlap with afferent fibers from the LM, which densely populate the core of the DTg (Allen Connectivity Atlas, http://connectivity.brain-map.org/projection/experiment/ivt?id = 293368154&popup = true). Instead, IP fibers terminate in adjacent areas including the LDTg, NI, DRI, and the surrounding poorly defined CGPn. Past anterograde tract tracing studies in the rat IP are consistent with these findings (Groenewegen et al., 1986), and prior retrograde tracing studies have not had sufficient resolution to distinguish the DTg from surrounding structures (Huitinga, Van Dijk, & Groenewegen, 1985). The IP efferent pathways described here may help to better understand the role of the IP in movement velocity and how lesions of the IP disrupt the sense of head direction and conveyed to the thalamus.
It is possible that the anatomical arrangement of the habenulopeduncular pathway described here and in prior studies may allow lateralized signals to be conveyed through the entire circuit from the MHb to secondary targets in the pontine tegmentum. Cholinergic fibers from the vMHb “crisscross” the IP in a way that seems likely to obliterate the hemispheric source of the habenula input. However, vMHb fibers that enter the IP at the terminus of the fasciculus retroflexus decussate in the IPR to innervate the contralateral IPDL (Figure 4b), which in turn projects to the opposite LDTg (Figure 8e,f,j), ipsilateral to the original MHb input. Lateralized MHb afferents have also been observed in the IPC, where EM studies have shown that habenula fibers make a distinctive “S” type synapse, but do so preferentially on the ipsilateral side (Hamill & Lenn, 1983, 1984). The mechanism for this is unclear, since the MHb afferents also traverse the contralateral IPC. Maintaining the lateralization of the MHb signal throughout the habenulo-peduncular-tegmental pathway would allow this circuit to convey information about laterality when it is salient, such as in directional motion, in addition to information regarding motivational state, which may not be lateralized.
4.3 | Function of the dMHb-IPL pathway
Here we have described for the first time the specific secondary efferent pathway of the peptidergic dMHb. Early studies demonstrated the specific peptidergic projection of the dMHb to the IPL (Kawaja, Flumerfelt, Hunt, & Hrycyshyn, 1991), but the secondary targets and function of this pathway are largely obscure. In the mouse, dMHb fibers undergo a caudal decussation such that each dMHb hemisphere innervates the IPL bilaterally. Anterograde labeling indicates that the IPL projects to a region of the CGPn, lateral to the nucleus incertus and medial to the locus coeruleus, for which no specific function may yet have been assigned. The IPL is a cell-poor region, but retrograde viral activation of a genetic reporter demonstrates that neurons surrounding the peptidergic dMHb terminals in this area have processes that extend into the habenulo-recipient area, and that the IPL efferents are bilateral. Recent work has shown that mice with genetic ablations of the dMHb show profound defects in voluntary wheel running and changes in some but not all rodent models of mood state (Hsu et al., 2014, 2016). Thus the IPL efferent pathway may mediate a key link between activity and mood, and merits further investigation.
4.4 | Descending IP projections to the raphe and the behavioral effects of nicotine
Much of the interest in the habenulopeduncular system is driven by its role in mediating nicotine addiction and withdrawal (Antolin-Fontes et al., 2015; Velasquez, Molfese, & Salas, 2014), and the present study should provide a firmer basis for understanding the circuitry underlying these effects. The habenulopeduncular circuit with the most obvious relevance is that of the vMHb to the IP subnuclei other than IPL and IPA. The vMHb is a principally glutamatergic nucleus that uses acetylcholine as a co-transmitter (Hsu et al., 2013; Ren et al., 2011), and is itself rich in nicotinic receptors (Quina, Wang, Ng, & Turner, 2009; Shih et al., 2014). Infusion of nicotinic antagonists into the IP precipitates somatic signs of withdrawal in nicotine-dependent mice (Salas et al., 2009). Precipitated nicotine withdrawal induces c-fos expression in the IP, and glutamatergic input to the IP, probably from the MHb, is necessary for the withdrawal effects (Zhao-Shea et al., 2013). Because the IP strongly expresses the Chrna5 subunit, it is tempting to invoke it in withdrawal mechanisms, but mice lacking Chrna5 still exhibit withdrawal symptoms (Jackson, Sanjakdar, Muldoon, McIntosh, & Damaj, 2013). Several brain regions are probably involved in mediating the effects of Chrna5 on diverse nicotine-related behaviors (Bailey, De Biasi, Fletcher, & Lambe, 2010; Beiranvand et al., 2014; Besson et al., 2016; Exley, McIntosh, Marks, Maskos, & Cragg, 2012; Fowler, Tuesta, & Kenny, 2013; Morel et al., 2014).
As a potential mechanism for the IP effects on nicotine withdrawal, it has been proposed that the SST-expressing neurons in IPR are local interneurons that act presynaptically upon MHb terminals in the IP to modulate glutamate release in the IP (Zhao-Shea et al., 2013). Here we show instead that SST-expressing IP neurons are GABAergic projection neurons that terminate in the raphe, similar to the neighboring SST-negative neurons in IPR and IPDM. The SST-expressing neurons are a subset of the Chrna5-expressing GABAergic neurons in the IP, which receive direct vMHb input, and are part of the IP output circuit to the tegmental and pontine raphe (Hsu et al., 2013). Although this does not exclude that these neurons could have a recurrent axonal branch that terminates presynaptically on MHb fibers, no evidence is available for a connection of this kind. The SST-expressing neurons also occupy a small domain in caudal IPR, and are excluded from most of the habenulo-recipient areas of IPR and IPC, which does not suggest a general role in modulating MHb inputs. It has also been reported that SST-expressing IP neurons “predominantly express Gad1” and not Gad2, and thus that optogenetic experiments using a Gad2Cre driver are selective for Gad2-expressing projection neurons within the IP, sparing the activation of SST-expressing neurons (Zhao-Shea et al., 2013). However, our results clearly show that the SST-expressing neurons also express Gad2 (Figure 13b), and thus that SST-expressing cells in the IPR cannot be distinguished based in Gad isoform expression. Instead, the Gad2-negative cells in the IPR are glutamatergic neurons that project to midline structures in the mesencephalic and pontine tegmentum.
Acknowledgments
Funding information
NIH, Grant/Awards Number: R01-DA035838 and R01-MH093667 (to E.T.)
We thank Bénédicte Rossi for illustrations, Larry Zweifel for providing Cav2-Cre virus, Karla Hirokawa for technical assistance, and Matt Brodsky and Glenn Morton for helpful input on the manuscript. This work was supported by NIH awards R01-DA035838 and R01-MN093667 to E.T. We also thank the Allen Institute founders, Paul G. Allen and Jody Allen, for their vision, encouragement, and support.
Abbreviations
- 4V
4th ventricle
- 7n
facial nerve or its root
- aca
anterior commissure, anterior part
- AcbC
accumbens nucleus, core
- AcbSh
accumbens nucleus, shell
- AH
anterior hypothalamic area
- Aq
aqueduct (Sylvius)
- CA1
field CA1 of hippocampus
- CA2
field CA2 of hippocampus
- CA3
field CA3 of hippocampus
- Cb
cerebellum
- Cg
cingulate cortex
- CGPn
central gray of the pons
- CPu
caudate putamen (striatum)
- DG
dentate gyrus (of hippocampus)
- dMHb
medial habenula, dorsal subnucleus
- DR
dorsal raphe nucleus
- DRC
dorsal raphe nucleus, caudal part
- DRD
dorsal raphe nucleus, dorsal part
- DRI
dorsal raphe nucleus, interfascicular part
- DRV
dorsal raphe nucleus, ventral part
- DTg
dorsal tegmental nucleus
- Ent
entorhinal cortex
- f
fornix
- fr
fasciculus retroflexus
- gcc
genu of the corpus callosum
- IF
interfascicular nucleus
- IP
interpeduncular nucleus
- IPA
interpeduncular nucleus, apical subnucleus
- IPC
interpeduncular nucleus, caudal subnucleus
- IPDL
interpeduncular nucleus, dorsolateral subnucleus
- IPDM
interpeduncular nucleus, dorsomedial subnucleus
- ipf
interpeduncular fossa
- IPI
interpeduncular nucleus, intermediate subnucleus
- IPL
interpeduncular nucleus, lateral subnucleus
- IPR
interpeduncular nucleus, rostral subnucleus
- LC
locus coeruleus
- LDTg
laterodorsal tegmental nucleus
- LH
lateral hypothalamic area
- LHb
lateral habenula
- LPO
lateral preoptic area
- LS
lateral septal nucleus
- LV
lateral ventricle
- MG
medial geniculate nucleus
- MHb
medial habenula
- ml
medial lemniscus
- mlf
medial longitudinal fasciculus
- MM
medial mammillary nucleus, medial part
- MnR
median raphe nucleus
- MPO
medial preoptic nucleus
- MS
medial septal nucleus
- NI
nucleus incertus
- opt
optic tract
- PAG
periaqueductal gray
- PDTg
posterodorsal tegmental nucleus
- PMnR
paramedian raphe nucleus
- PN
paranigral nucleus
- PnR
pontine raphe nucleus
- R
red nucleus
- RLi
rostral linear nucleus of the raphe
- RtTg
reticulotegmental nucleus of the pons
- SFi
septofimbrial nucleus
- SNR
substantia nigra, reticular part
- V1
primary visual cortex
- V2
secondary visual cortex
- VDB
nucleus of the vertical limb of the diagonal band
- vMHb
medial habenula, ventral subnucleus
- VTA
ventral tegmental area
- VTg
ventral tegmental nucleus (of Gudden)
- vtgx
ventral tegmental decussation
- xipc
caudal decussation of the IP
- xipr1
first rostral interpeduncular decussation
- xipr2
second rostral interpeduncular decussation
- xscp
decussation of the superior cerebellar peduncle.
Footnotes
CONFLICT OF INTEREST
The authors have no conflicts of interest to report.
References
- Antolin-Fontes B, Ables JL, Gorlich A, Ibanez-Tallon I. The habenulo-interpeduncular pathway in nicotine aversion and withdrawal. Neuropharmacology. 2015;96:213–222. doi: 10.1016/j.neuropharm.2014.11.019. [DOI] [PMC free article] [PubMed] [Google Scholar]
- Bailey CD, De Biasi M, Fletcher PJ, Lambe EK. The nicotinic acetylcholine receptor alpha5 subunit plays a key role in attention circuitry and accuracy. The Journal of Neuroscience: The Official Journal of the Society for Neuroscience. 2010;30:9241–9252. doi: 10.1523/JNEUROSCI.2258-10.2010. [DOI] [PMC free article] [PubMed] [Google Scholar]
- Bassett JP, Taube JS. Neural correlates for angular head velocity in the rat dorsal tegmental nucleus. The Journal of Neuroscience: The Official Journal of the Society for Neuroscience. 2001;21:5740–5751. doi: 10.1523/JNEUROSCI.21-15-05740.2001. [DOI] [PMC free article] [PubMed] [Google Scholar]
- Beiranvand F, Zlabinger C, Orr-Urtreger A, Ristl R, Huck S, Scholze P. Nicotinic acetylcholine receptors control acetylcholine and noradrenaline release in the rodent habenulo-interpeduncular complex. British Journal of Pharmacology. 2014;171:5209–5224. doi: 10.1111/bph.12841. [DOI] [PMC free article] [PubMed] [Google Scholar]
- Berrettini WH, Doyle GA. The CHRNA5-A3-B4 gene cluster in nicotine addiction. Molecular Psychiatry. 2012;17:856–866. doi: 10.1038/mp.2011.122. [DOI] [PubMed] [Google Scholar]
- Besson M, Guiducci S, Granon S, Guilloux JP, Guiard B, Reperant C, … Maskos U. Alterations in alpha5* nicotinic acetylcholine receptors result in midbrain- and hippocampus-dependent behavioural and neural impairments. Psychopharmacology (Berl) 2016;233:3297–3314. doi: 10.1007/s00213-016-4362-2. [DOI] [PubMed] [Google Scholar]
- Broms J, Antolin-Fontes B, Tingstrom A, Ibanez-Tallon I. Conserved expression of the GPR151 receptor in habenular axonal projections of vertebrates. The Journal of Comparative Neurology. 2015;523:359–380. doi: 10.1002/cne.23664. [DOI] [PMC free article] [PubMed] [Google Scholar]
- Clark BJ, Sarma A, Taube JS. Head direction cell instability in the anterior dorsal thalamus after lesions of the interpeduncular nucleus. The Journal of Neuroscience: The Official Journal of the Society for Neuroscience. 2009;29:493–507. doi: 10.1523/JNEUROSCI.2811-08.2009. [DOI] [PMC free article] [PubMed] [Google Scholar]
- Clark BJ, Taube JS. Deficits in landmark navigation and path integration after lesions of the interpeduncular nucleus. Behavioral Neuroscience. 2009;123:490–503. doi: 10.1037/a0015477. [DOI] [PMC free article] [PubMed] [Google Scholar]
- Clark BJ, Taube JS. Vestibular and attractor network basis of the head direction cell signal in subcortical circuits. Frontiers in Neural Circuits. 2012;6:7. doi: 10.3389/fncir.2012.00007. [DOI] [PMC free article] [PubMed] [Google Scholar]
- Exley R, McIntosh JM, Marks MJ, Maskos U, Cragg SJ. Striatal alpha5 nicotinic receptor subunit regulates dopamine transmission in dorsal striatum. The Journal of Neuroscience: The Official Journal of the Society for Neuroscience. 2012;32:2352–2356. doi: 10.1523/JNEUROSCI.4985-11.2012. [DOI] [PMC free article] [PubMed] [Google Scholar]
- Fowler CD, Tuesta L, Kenny PJ. Role of alpha5* nicotinic acetylcholine receptors in the effects of acute and chronic nicotine treatment on brain reward function in mice. Psychopharmacology (Berl) 2013;229:503–513. doi: 10.1007/s00213-013-3235-1. [DOI] [PMC free article] [PubMed] [Google Scholar]
- Gardon O, Faget L, Chu Sin Chung P, Matifas A, Massotte D, Kieffer BL. Expression of mu opioid receptor in dorsal diencephalic conduction system: New insights for the medial habenula. Neuroscience. 2014;277:595–609. doi: 10.1016/j.neuroscience.2014.07.053. [DOI] [PMC free article] [PubMed] [Google Scholar]
- Gerfen CR, Paletzki R, Heintz N. GENSAT BAC cre-recombinase driver lines to study the functional organization of cerebral cortical and basal ganglia circuits. Neuron. 2013;80:1368–1383. doi: 10.1016/j.neuron.2013.10.016. [DOI] [PMC free article] [PubMed] [Google Scholar]
- Groenewegen HJ, Ahlenius S, Haber SN, Kowall NW, Nauta WJ. Cytoarchitecture, fiber connections, and some histochemical aspects of the interpeduncular nucleus in the rat. The Journal of Comparative Neurology. 1986;249:65–102. doi: 10.1002/cne.902490107. [DOI] [PubMed] [Google Scholar]
- Hamill GS, Lenn NJ. Synaptic plasticity within the interpeduncular nucleus after unilateral lesions of the habenula in neonatal rats. The Journal of Neuroscience: The Official Journal of the Society for Neuroscience. 1983;3:2128–2145. doi: 10.1523/JNEUROSCI.03-11-02128.1983. [DOI] [PMC free article] [PubMed] [Google Scholar]
- Hamill GS, Lenn NJ. The subnuclear organization of the rat interpeduncular nucleus: A light and electron microscopic study. The Journal of Comparative Neurology. 1984;222:396–408. doi: 10.1002/cne.902220307. [DOI] [PubMed] [Google Scholar]
- Hamill GS, Olschowka JA, Lenn NJ, Jacobowitz DM. The subnuclear distribution of substance P, cholecystokinin, vasoactive intestinal peptide, somatostatin, leu-enkephalin, dopamine-beta-hydroxylase, and serotonin in the rat interpeduncular nucleus. The Journal of Comparative Neurology. 1984;226:580–596. doi: 10.1002/cne.902260410. [DOI] [PubMed] [Google Scholar]
- Harrington L, Vinals X, Herrera-Solis A, Flores A, Morel C, Tolu S, … Robledo P. Role of beta4* nicotinic acetylcholine receptors in the habenulo-interpeduncular pathway in nicotine reinforcement in mice. Neuropsychopharmacology. 2016;41:1790–1802. doi: 10.1038/npp.2015.346. [DOI] [PMC free article] [PubMed] [Google Scholar]
- Harris JA, Hirokawa KE, Sorensen SA, Gu H, Mills M, Ng LL, … Zeng H. Anatomical characterization of Cre driver mice for neural circuit mapping and manipulation. Frontiers in Neural Circuits. 2014;8:76. doi: 10.3389/fncir.2014.00076. [DOI] [PMC free article] [PubMed] [Google Scholar]
- Harris JA, Wook Oh S, Zeng H. Adeno-associated viral vectors for anterograde axonal tracing with fluorescent proteins in non-transgenic and cre driver mice. Current Protocols in Neuroscience. 2012;Chapter 1(Unit 1.20):21–18. doi: 10.1002/0471142301.ns0120s59. [DOI] [PubMed] [Google Scholar]
- Hnasko TS, Perez FA, Scouras AD, Stoll EA, Gale SD, Luquet S, … Palmiter RD. Cre recombinase-mediated restoration of nigrostriatal dopamine in dopamine-deficient mice reverses hypophagia and bradykinesia. Proceedings of the National Academy of Sciences of the United States of America. 2006;103:8858–8863. doi: 10.1073/pnas.0603081103. [DOI] [PMC free article] [PubMed] [Google Scholar]
- Hsu YW, Morton G, Guy EG, Wang SD, Turner EE. Dorsal medial habenula regulation of mood-related behaviors and primary reinforcement by tachykinin-expressing habenula neurons. eNeuro. 2016:3. doi: 10.1523/ENEURO.0109-16.2016. [DOI] [PMC free article] [PubMed] [Google Scholar]
- Hsu YW, Tempest L, Quina LA, Wei AD, Zeng H, Turner EE. Medial habenula output circuit mediated by alpha5 nicotinic receptor-expressing GABAergic neurons in the interpeduncular nucleus. The Journal of Neuroscience: The Official Journal of the Society for Neuroscience. 2013;33:18022–18035. doi: 10.1523/JNEUROSCI.2927-13.2013. [DOI] [PMC free article] [PubMed] [Google Scholar]
- Hsu YW, Wang SD, Wang S, Morton G, Zariwala HA, de la Iglesia HO, Turner EE. Role of the dorsal medial habenula in the regulation of voluntary activity, motor function, hedonic state, and primary reinforcement. The Journal of Neuroscience: The Official Journal of the Society for Neuroscience. 2014;34:11366–11384. doi: 10.1523/JNEUROSCI.1861-14.2014. [DOI] [PMC free article] [PubMed] [Google Scholar]
- Huitinga I, Van Dijk CA, Groenewegen HJ. Substance P-and enkephalin-containing projections from the interpeduncular nucleus to the dorsal tegmental region in the rat. Neuroscience Letters. 1985;62:311–316. doi: 10.1016/0304-3940(85)90567-1. [DOI] [PubMed] [Google Scholar]
- Jackson KJ, Sanjakdar SS, Muldoon PP, McIntosh JM, Damaj MI. The alpha3beta4* nicotinic acetylcholine receptor subtype mediates nicotine reward and physical nicotine withdrawal signs independently of the alpha5 subunit in the mouse. Neuropharmacology. 2013;70:228–235. doi: 10.1016/j.neuropharm.2013.01.017. [DOI] [PMC free article] [PubMed] [Google Scholar]
- Kawaja MD, Flumerfelt BA, Hunt SP, Hrycyshyn AW. Substance P immunoreactivity in the rat interpeduncular nucleus: Synaptic interactions between substance P-positive profiles and choline acetyltransferase- or glutamate decarboxylase-immunoreactive structures. Neuroscience. 1991;42:739–755. doi: 10.1016/0306-4522(91)90042-m. [DOI] [PubMed] [Google Scholar]
- Klemm WR. Habenular and interpeduncularis nuclei: Shared components in multiple-function networks. Medical Science Monitor: International Medical Journal of Experimental and Clinical Research. 2004;10:RA261–273. [PubMed] [Google Scholar]
- Lassi G, Taylor AE, Timpson NJ, Kenny PJ, Mather RJ, … Munafo MR. The CHRNA5-A3-B4 gene cluster and smoking: From discovery to therapeutics. Trends in Neurosciences. 2016;39:851–861. doi: 10.1016/j.tins.2016.10.005. [DOI] [PMC free article] [PubMed] [Google Scholar]
- Lenn NJ, Hamill GS. Subdivisions of the interpeduncular nucleus: A proposed nomenclature. Brain Research Bulletin. 1984;13:203–204. doi: 10.1016/0361-9230(84)90023-6. [DOI] [PubMed] [Google Scholar]
- Liu Z, Zhou J, Li Y, Hu F, Lu Y, Ma M, … Luo M. Dorsal raphe neurons signal reward through 5-HT and glutamate. Neuron. 2014;81:1360–1374. doi: 10.1016/j.neuron.2014.02.010. [DOI] [PMC free article] [PubMed] [Google Scholar]
- Madisen L, Zwingman TA, Sunkin SM, Oh SW, Zariwala HA, … Zeng H. A robust and high-throughput Cre reporting and characterization system for the whole mouse brain. Nature Neuroscience. 2010;13:133–140. doi: 10.1038/nn.2467. [DOI] [PMC free article] [PubMed] [Google Scholar]
- Marks MJ, Pauly JR, Gross SD, Deneris ES, Hermans-Borgmeyer I, Heinemann SF, Collins AC. Nicotine binding and nicotinic receptor subunit RNA after chronic nicotine treatment. The Journal of Neuroscience: The Official Journal of the Society for Neuroscience. 1992;12:2765–2784. doi: 10.1523/JNEUROSCI.12-07-02765.1992. [DOI] [PMC free article] [PubMed] [Google Scholar]
- Montone KT, Fass B, Hamill GS. Serotonergic and nonserotonergic projections from the rat interpeduncular nucleus to the septum, hippocampal formation and raphe: A combined immunocytochemical and fluorescent retrograde labelling study of neurons in the apical subnucleus. Brain Research Bulletin. 1988;20:233–240. doi: 10.1016/0361-9230(88)90183-9. [DOI] [PubMed] [Google Scholar]
- Morel C, Fattore L, Pons S, Hay YA, Marti F, Lambolez B, … Faure P. Nicotine consumption is regulated by a human polymorphism in dopamine neurons. Molecular Psychiatry. 2014;19:930–936. doi: 10.1038/mp.2013.158. [DOI] [PMC free article] [PubMed] [Google Scholar]
- Oh SW, Harris JA, Ng L, Winslow B, Cain N, Mihalas S, … Zeng H. A mesoscale connectome of the mouse brain. Nature. 2014;508:207–214. doi: 10.1038/nature13186. [DOI] [PMC free article] [PubMed] [Google Scholar]
- Paxinos G, Franklin KBJ. The mouse brain in stereotaxic coordinates. 2. San Diego, CA: Academic; 2001. [Google Scholar]
- Quina LA, Tempest L, Ng L, Harris JA, Ferguson S, Jhou TC, Turner EE. Efferent pathways of the mouse lateral habenula. The Journal of Comparative Neurology. 2015;523:32–60. doi: 10.1002/cne.23662. [DOI] [PMC free article] [PubMed] [Google Scholar]
- Quina LA, Wang S, Ng L, Turner EE. Brn3a and Nurr1 mediate a gene regulatory pathway for habenula development. The Journal of Neuroscience: The Official Journal of the Society for Neuroscience. 2009;29:14309–14322. doi: 10.1523/JNEUROSCI.2430-09.2009. [DOI] [PMC free article] [PubMed] [Google Scholar]
- Ragan T, Kadiri LR, Venkataraju KU, Bahlmann K, Sutin J, Taranda J, … Osten P. Serial two-photon tomography for automated ex vivo mouse brain imaging. Nature Methods. 2012;9:255–258. doi: 10.1038/nmeth.1854. [DOI] [PMC free article] [PubMed] [Google Scholar]
- Ren J, Qin C, Hu F, Tan J, Qiu L, Zhao S, … Luo M. Habenula “cholinergic” neurons co-release glutamate and acetylcholine and activate postsynaptic neurons via distinct transmission modes. Neuron. 2011;69:445–452. doi: 10.1016/j.neuron.2010.12.038. [DOI] [PubMed] [Google Scholar]
- Rossi J, Balthasar N, Olson D, Scott M, Berglund E, Lee CE, … Elmquist JK. Melanocortin-4 receptors expressed by cholinergic neurons regulate energy balance and glucose homeostasis. Cell Metabolism. 2011;13:195–204. doi: 10.1016/j.cmet.2011.01.010. [DOI] [PMC free article] [PubMed] [Google Scholar]
- Salas R, Orr-Urtreger A, Broide RS, Beaudet A, Paylor R, De Biasi M. The nicotinic acetylcholine receptor subunit alpha 5 mediates short-term effects of nicotine in vivo. Molecular Pharmacology. 2003;63:1059–1066. doi: 10.1124/mol.63.5.1059. [DOI] [PubMed] [Google Scholar]
- Salas R, Sturm R, Boulter J, De Biasi M. Nicotinic receptors in the habenulo-interpeduncular system are necessary for nicotine withdrawal in mice. The Journal of Neuroscience: The Official Journal of the Society for Neuroscience. 2009;29:3014–3018. doi: 10.1523/JNEUROSCI.4934-08.2009. [DOI] [PMC free article] [PubMed] [Google Scholar]
- Sharp PE, Turner-Williams S, Tuttle S. Movement-related correlates of single cell activity in the interpeduncular nucleus and habenula of the rat during a pellet-chasing task. Behavioural Brain Research. 2006;166:55–70. doi: 10.1016/j.bbr.2005.07.004. [DOI] [PubMed] [Google Scholar]
- Shibata H, Suzuki T. Efferent projections of the interpeduncular complex in the rat, with special reference to its subnuclei: A retrograde horseradish peroxidase study. Brain Research. 1984;296:345–349. doi: 10.1016/0006-8993(84)90071-4. [DOI] [PubMed] [Google Scholar]
- Shih PY, Engle SE, Oh G, Deshpande P, Puskar NL, Lester HA, Drenan RM. Differential expression and function of nicotinic acetylcholine receptors in subdivisions of medial habenula. The Journal of Neuroscience: The Official Journal of the Society for Neuroscience. 2014;34:9789–9802. doi: 10.1523/JNEUROSCI.0476-14.2014. [DOI] [PMC free article] [PubMed] [Google Scholar]
- Soria-Gomez E, Busquets-Garcia A, Hu F, Mehidi A, Cannich A, Roux L, … Marsicano G. Habenular CB1 receptors control the expression of aversive memories. Neuron. 2015;88:306–313. doi: 10.1016/j.neuron.2015.08.035. [DOI] [PubMed] [Google Scholar]
- Taniguchi H, He M, Wu P, Kim S, Paik R, Sugino K, … Huang ZJ. A resource of Cre driver lines for genetic targeting of GABAergic neurons in cerebral cortex. Neuron. 2011;71:995–1013. doi: 10.1016/j.neuron.2011.07.026. [DOI] [PMC free article] [PubMed] [Google Scholar]
- Velasquez KM, Molfese DL, Salas R. The role of the habenula in drug addiction. Frontiers in Human Neuroscience. 2014;8:174. doi: 10.3389/fnhum.2014.00174. [DOI] [PMC free article] [PubMed] [Google Scholar]
- Vertes RP. Brainstem afferents to the basal forebrain in the rat. Neuroscience. 1988;24:907–935. doi: 10.1016/0306-4522(88)90077-2. [DOI] [PubMed] [Google Scholar]
- Vertes RP, Fass B. Projections between the interpeduncular nucleus and basal forebrain in the rat as demonstrated by the anterograde and retrograde transport of WGA-HRP. Experimental Brain Research. 1988;73:23–31. doi: 10.1007/BF00279657. [DOI] [PubMed] [Google Scholar]
- Vertes RP, Fortin WJ, Crane AM. Projections of the median raphe nucleus in the rat. The Journal of Comparative Neurology. 1999;407:555–582. [PubMed] [Google Scholar]
- Vong L, Ye C, Yang Z, Choi B, Chua S, Jr, Lowell BB. Leptin action on GABAergic neurons prevents obesity and reduces inhibitory tone to POMC neurons. Neuron. 2011;71:142–154. doi: 10.1016/j.neuron.2011.05.028. [DOI] [PMC free article] [PubMed] [Google Scholar]
- Wirtshafter D, Asin KE, Lorens SA. Serotonin-immunoreactive projections to the hippocampus from the interpeduncular nucleus in the rat. Neuroscience Letters. 1986;64:259–262. doi: 10.1016/0304-3940(86)90338-1. [DOI] [PubMed] [Google Scholar]
- Zhang J, Tan L, Ren Y, Liang J, Lin R, Feng Q, … Luo M. Presynaptic excitation via GABAB receptors in habenula cholinergic neurons regulates fear memory expression. Cell. 2016;166:716–728. doi: 10.1016/j.cell.2016.06.026. [DOI] [PubMed] [Google Scholar]
- Zhao-Shea R, DeGroot SR, Liu L, Vallaster M, Pang X, Su Q, … Tapper AR. Increased CRF signalling in a ventral tegmental area-interpeduncular nucleus-medial habenula circuit induces anxiety during nicotine withdrawal. Nature Communications. 2015;6:6770. doi: 10.1038/ncomms7770. [DOI] [PMC free article] [PubMed] [Google Scholar]
- Zhao-Shea R, Liu L, Pang X, Gardner PD, Tapper AR. Activation of GABAergic neurons in the interpeduncular nucleus triggers physical nicotine withdrawal symptoms. Current Biology: CB. 2013;23:2327–2335. doi: 10.1016/j.cub.2013.09.041. [DOI] [PMC free article] [PubMed] [Google Scholar]


