

Abstract
Identifying predictors of treatment outcome for nicotine use disorders (NUD) may help improve efficacy of established treatments, like varenicline. Brain reactivity to drug-stimuli predicts relapse risk in nicotine and other substance use disorders in some studies. Activity in the default mode network (DMN) is affected by drug cues and other palatable cues, but its clinical significance is unclear. In this study, 143 individuals with nicotine use disorder (NUD) (male n=91, ages 18–55) received a functional MRI scan during a visual cue task during which they were presented with a series of smoking- or food-related video clips prior to randomization to treatment with varenicline (n=80) or placebo. Group independent components analysis was utilized to isolate the DMN, and temporal sorting was used to calculate the difference between the DMN BOLD signal during smoke versus food cues for each individual. Food cues were associated with greater deactivation compared to smoke cues in the DMN. Correcting for baseline smoking and other clinical variables which have been shown to be related to treatment outcome in previous work, a less positive Smoke-Food difference score predicted greater smoking at 6 and 12 weeks when both treatment groups were combined (p=0.005, beta=−0.766). An exploratory analysis of executive control (ECN) and salience networks demonstrated that a more positive Smoke-Food difference score for ECN predicted a more robust response to varenicline relative to placebo. These findings provide further support to theories that brain reactivity to palatable cues, and in particular in DMN, may have direct clinical relevance in NUD.
Keywords: default mode network, functional MRI, nicotine use disorder, smoking, treatment outcome, varenicline
Introduction
There are several efficacious pharmacotherapeutic agents for the treatment of nicotine use disorder (NUD), including buprioprion, varenicline, and nicotine replacement therapies (NRT) (Hartmann-Boyce et al., 2014). In particular, varenicline, a partial agonist at the nicotinic acetylcholinergic receptor (Rollema et al., 2007) is associated with higher quit rates compared to NRT and buproprion, with no evidence of a significant increase in serious adverse events (Hartmann-Boyce et al., 2014). However, more than 80% of individuals entering treatment, even when treated with varenicline, end up relapsing by 6 months (Richmond & Kehoe, 2007; Westergaard et al., 2015).
Searching for individual characteristics to predict outcomes to particular treatments for substance use disorders (SUD) has been a focus of research for over 3 decades with the idea that by matching treatments to particular subgroups more likely to benefit, treatment efficacy can be enhanced. In alcohol use disorders (AUD), some progress has been made for some of the pharmacotherapeutic agents (Mann et al., 2014; C.E. Wilcox & Bogenschutz, 2013). In NUD, the majority of the studies that have tried have not been able to identify subgroups more likely to respond to buproprion, NRT (Aubin et al., 2004; Brody et al., 2014; Niaura et al., 1994) or varenicline (McClure et al., 2010; Perkins et al., 2010). For varenicline, a few exceptions to this exist. Studies have identified associations between activation in brain areas related to attentiveness and memory while resisting an urge to smoke (Hartwell et al., 2013), the presence of certain nAChR subunit genes (D. P. King et al., 2012), and nicotine metabolism rates (Lerman et al., 2015) and treatment outcome to varenicline. To date, no studies have identified whether brain activation during smoking cues predict treatment outcome on varenicline, however.
Predicting outcomes in general during treatment is also important; clinically it can help inform decisions about treatment intensity such as those regarding high versus low doses or combined treatments versus single treatments. For overall outcome prediction in NUD, results have been mixed but indicate that absence of neuropsychiatric disorder and lower psychiatric symptom severity (Ferguson et al., 2003), older age, longer duration of previous quit attempts, lower dependence severity, adherence to pharmacotherapy, absence of smoking-related disease, male gender, low level of current alcohol problems, living as a couple (Aubin et al., 2004; Ferguson et al., 2003; Iliceto et al., 2013; Wee et al., 2011) and lower impulsivity (Sheffer et al., 2012) predict better treatment outcomes.
Functional brain imaging may have an advantage overself-report measures because of its sensitivity and because of the mechanistic insights it provides. Incentive salience, referring to the wanting or desire response that the brain has to a drug-stimulus (as measured primarily in humans during fMRI by brain cue reactivity), is one of the three primary dimensions for the proposed Addictions Neuroclinical Assessment framework, highlighting its importance as a core functional domain underlying SUD pathophysiology (Kwako et al., 2015). In particular, there is a growing literature on the potential importance of drug cue reactivity in predicting treatment response in a variety of SUD (Courtney et al., 2016; Janes et al., 2010; Mann et al., 2014; Versace et al., 2014) and it also has been shown to predict response to particular treatments in AUD (Mann et al., 2014).
The default mode network (DMN) is a set of brain regions that tends to demonstrate decreased activation during attentionally demanding and cognitively challenging tasks, and is anti-correlated with executive control networks mediating goal-oriented behavior (Anticevic et al., 2012; Fox et al., 2005). DMN deactivation likely plays an important role in successful goal-oriented cognition and behavior (Anticevic et al., 2012), which could hold relevance for drug-seeking on the one hand, or maintaining on-line a decision to remain abstinent, on the other. Deactivation in regions of the DMN [rostral anterior cingulate cortex (rACC), posterior cingulate cortex (PCC)] has been observed in response to nicotine, cocaine and food cues (Claus et al., 2013; Tomasi et al., 2015; C. E. Wilcox et al., 2011) in some studies, but in others, activation has been observed in these areas (Engelmann et al., 2012). Therefore, the findings regarding the effects of drug cues on the DMN and regions encompassing the DMN are mixed. The significance of the brain’s response to these cues in driving relapse during SUD treatment is still unknown.
Our primary aim in this study was to investigate the degree to which DMN deactivation to smoking cues relative to food cues would predict treatment response to varenicline in particular and overall treatment response in treatment-seeking individuals with NUD enrolled in a clinical trial of varenicline versus placebo. Since greater DMN deactivation to food cues compared to smoke cues was measured in a non-treatment seeking sample using the same task (Claus et al., 2013), we hypothesized that our sample would demonstrate a similar effect. Furthermore, we explored the degree to which deactivation to smoke cue, food cue, and the difference between them would predict better clinical outcomes, controlling for the predictive effects of self-report clinical measures which have shown to predict outcome in previous work. Finally, we explored activation in executive control and salience networks (ECN; SN) and their associations with outcomes, given the fact that these networks are often engaged by drug cues and anti-correlated with DMN (Anticevic et al., 2012; Fox et al., 2005; Lerman et al., 2014).
Patients and Methods
Subjects
Subjects were treatment-seeking cigarette smokers between the ages of 18 and 55recruited and enrolled in a randomized, double-blind, placebo-controlled trial of varenicline which was designed to identify biomarkers of effectiveness [manuscript summarizing clinical results, under review (Littlewood et al.)]. Individuals were required to smoke at least 10 cigarettes per day and to have not previously taken varenicline. Participants were excluded for current pregnancy/nursing, use of illicit drugs (excluding marijuana) in the past 60 days (confirmed by urine toxicology screen), serious health concerns (cardiovascular disease, uncontrolled hypertension, hepatic or renal disease, diabetes), or for meeting DSM-IV criteria for psychotic, bipolar, or major depressive disorder in the past year. 205 individuals were randomized using an urn randomization technique, and treated for 12 weeks. Of these, 143 underwent a cue-exposure task during fMRI prior to medication initiation (male n=91; varenicline n=80; mean age 34.05 yrs, SD 10.16), and their data were used for the analyses that follow; individuals who chose not to have an MRI or had exclusions for MRI were still enrolled in the clinical trial.
Clinical Trial Design
Consistent with previous trials (Gonzales et al., 2006) patients were titrated to 1mg twice daily as follows: days 1–3, 0.5 mg per day; days 4–7, 0.5 mg twice per day, and after day 7, 1 mg twice per day. All participants received a 30 minute baseline motivational enhancement session during which a target quit date was set for day 8, and brief (10 minute) counseling visits with their assigned therapist at each assessment (2, 6, 12 weeks) (Littlewood et al.).
Clinical Assessments
A battery of assessments were obtained at screen, baseline, 2, 6 and 12 weeks. Only measures relevant to this study are summarized below; a full description of the clinical assessment measures is provided in the clinical outcomes paper (Littlewood et al.). Nicotine dependence was characterized using the Fagerstrom Test for Nicotine Dependence (FTND). Nicotine withdrawal was assessed using the Wisconsin Smoking Withdrawal Scale (WSWS) and craving with the Questionnaire of Smoking Urges and were obtained 15–30 minutes before each MRI scan. A separate subscale of the WSWS [WSWS(food)] which included only the questions that were related to desire for food was calculated (see Supporting Information for details). Number of hours since the last cigarette smoked was also obtained from the participant at the time of each MRI scan; participants were asked to be abstinent for 2 hours prior to the scan visit and there were only 8 participants who did not report being abstinent 2 hours prior to the scan. Additional measures included the Beck Anxiety Inventory (BAI), the Beck Depression Inventory (BDI), the Barratt Impulsiveness Questionnaire (BIQ), and the Alcohol Use Disorders Identification Test (AUDIT) (references for self-report measures listed in Supporting Information). All participants were also asked at the screen visit about the number of prior serious quit attempts they had made in their lives during which they remained abstinent from cigarettes for 12 hours or more. Carbon monoxide (CO) levels were obtained at all visits which were used to validate secondary abstinence-based outcome variables (Tables 6,7,S1–3).
Table 6.
Means for neuroimaging predictor variables by abstinent versus non-abstinent subgroups for the 7 days prior to week 6 (CO confirmed), and comparisons between abstinent and non-abstinent groups (independent samples t-tests), assuming all dropouts were non-abstinent
| S-F mean (SD) | S mean (SD) | F mean (SD) | n | ||
|---|---|---|---|---|---|
| 7dayPP at 6 wks | Abstinent | 0.365 (0.281) | 0.066 (0.317) | −0.298 (0.283) | 32 |
| Non-Abstinent | 0.204 (0.283) | −0.021 (0.268) | −0.225 (0.304) | 111 | |
| p value/ t statistic | 0.005/ 2.85 | 0.122/ 1.56 | 0.219/ −1.24 |
PP = point prevalence, CO confirmed = anyone with a CO > 10ppm at the 6 week visit were deemed Non-Abstinent regardless of self-report, SD = standard deviation, S-F = beta for degree of association of DMN component with smoke cues minus for food cues, S = beta for degree of association of DMN component with smoke cues, F = beta for degree of association of DMN component with food cues
Table 7.
Means for neuroimaging predictor variables by abstinent versus non-abstinent subgroups for the 30 days prior to week 12 (CO confirmed), and comparisons between abstinent and non-abstinent (independent samples t-tests), assuming all dropouts were non-abstinent
| S-F mean (SD) | S mean (SD) | F mean (SD) | n | ||
|---|---|---|---|---|---|
| 30dayPP at 12 wks | Abstinent | 0.373 (0.267) | 0.045 (0.305) | −0.329 (0.309) | 24 |
| Non-Abstinent | 0.213 (0.287) | −0.011 (0.276) | −0.224 (0.296) | 119 | |
| p value/ t statistic | 0.013/ 2.53 | 0.38/ 0.88 | 0.117/ −1.58 |
PP = point prevalence, CO confirmed = anyone with a CO > 10ppm at the 12 week visit were deemed Non-Abstinent regardless of self-report, SD = standard deviation, S-F = beta for degree of association of DMN component with smoke cues minus for food cues, S = beta for degree of association of DMN component with smoke cues, F = beta for degree of association of DMN component with food cues
The time-line follow-back procedure (TLFB) (reference in Supporting Information) was used to record tobacco product, alcohol, and drug use in the 60 days prior to the screen and during the interim period between each follow-up assessment. The baseline smoking rate was calculated as the total number of cigarettes smoked (NumCig) during the 60 days before the screen visit. Low rates of complete abstinence in the placebo group (n=4 at 6 weeks for 7 day point prevalence) rendered logistic regression problematic as a method of analysis to examine the interaction term [component beta × treatment group (RxGrp)], given small sample bias (G. King & Zeng, 2001). We therefore utilized continuous outcome variables as our primary outcome: NumCig during the previous 28 days for the 6 week smoking outcome and NumCig during the previous 30 days for the 12 week smoking outcome. Although abstinence is more commonly used as a measure of success in smoking cessation trials, smoking reduction is still a meaningful outcome that predicts later cessation (Begh et al., 2015). For dropouts, missing outcomes data were imputed to an adjusted screen visit value [eg. (NumCig at screen visit)*28/60 = NumCig at 6 weeks] (n=27/143 for week 6 and n=44/143 for week 12) for our primary analysis. Imputing to baseline (assuming missing subjects revert to baseline smoking levels) is a common approach for smoking cessation clinical trials (Ebbert et al., 2015; Higgins et al., 2008) even when rates of dropout approach ours. We also present results for an analysis performed on individuals with complete data.
Cue-Exposure Task
The cue-exposure task is identical to the task for which results in a different sample of non treatment-seeking smokers is published (Claus et al., 2013) (details in Supporting Information). In brief, the task consisted of two 6-min runs with pseudorandom presentations of seven different smoking- related videos and seven different food-related videos per run, ranging in length from 7 to 14 seconds, and depicting images of preparation of the stimulus for ingestion and the act of ingestion itself.
MRI Acquisition and Preprocessing
All scans were acquired on a Siemens 3T Trio scanner located at the Mind Research Network in Albuquerque NM using procedures previously described (Claus et al., 2013). Data were preprocessed using SPM5 software (http://fil.ion.ucl.ac.uk/spm/software/spm5) using standard methods (details in Supporting Information).
ICA Methods
Infomax group spatial ICA (Calhoun et al., 2001) was conducted to decompose the data into components using GIFT software (http://mialab.mrn.org/software/gift). 35 components for the previous data reduction step, and 30 components for the final data reduction step were chosen (typical for low order models (Ma et al., 2011)). To estimate subject-specific spatial maps and time-courses, the GICA back-reconstruction method was used (Calhoun et al., 2001; Erhardt et al., 2011). ICA was repeated 10 times using ICASSO (http://research.ics.aalto.fi/ica/icasso/) and the “best run” was selected to mitigate variation due to the stochastic estimation process (Ma et al., 2011). The resulting component runs were also clustered to estimate the reliability of the decomposition. Robustness and reliability of components were well-validated by the ICASSO results showing compact and independent/non-overlapping clusters. Following ICA, time series were filtered using a low-pass filter of > 0.15 Hz, and detrending to remove low frequency noise (high-pass filter). To correct for head motion, time series were then despiked, and motion was regressed out on a per-subject basis using the six motion parameters. In addition, mean root mean squared translational (rmsTrans) and rotational (rmsRot) framewise displacement (FD) were calculated for each subject (Jenkinson, 2003).
Component Selection
Spatial maps were reconstructed and converted to Z values for each of the subjects. A standardized DMN mask [rDMN_ICA_REST*.nii; http://mialab.mrn.org/data (Franco et al., 2009; Rachakonda et al., 2007)] was used to select the DMN component from the 30 estimated components using the spatial sort function in GIFT; we selected the component which was most strongly associated with our apriori template R2 = 0.42) (Figure 1a). This method was chosen so that our analyses could be systematically replicated in other samples. Compared to rest, previous works have shown that tasks may also modulate some of the spatial maps (Calhoun et al., 2008), but the change is not large, so the use of a rest DMN template is reasonable. The ECN [right(R) and left(L)] and SN were identified visually by anatomical overlap with previous studies of these networks in smokers (Lerman et al., 2014).
Figure 1.
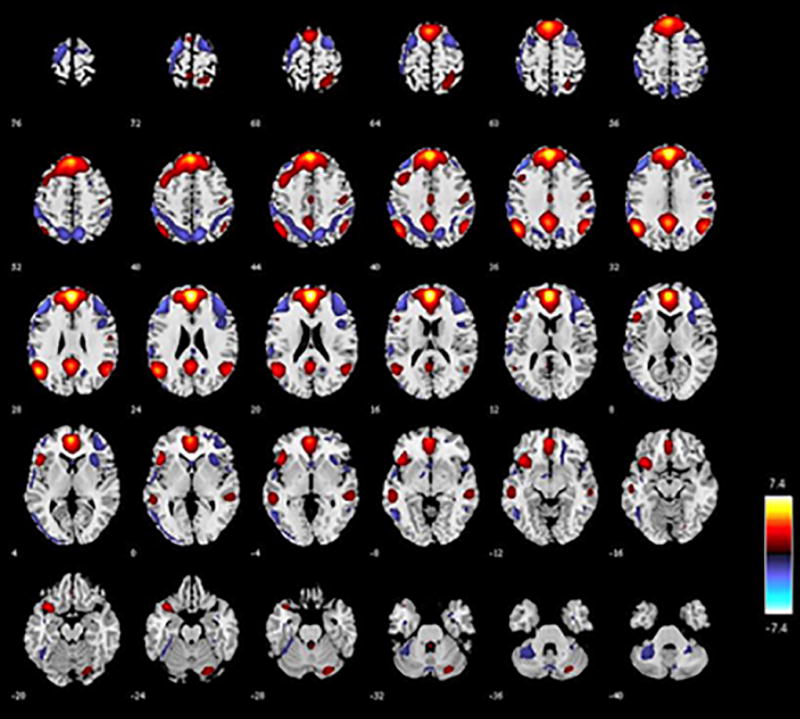
a. This figure shows the DMN component with each axial slice marked with a number representing the MNI z coordinate. Red indicates voxels which are more positively associated with the component (positive Z scores), and blue indicates voxels which are more negatively associated with this component (negative Z scores).
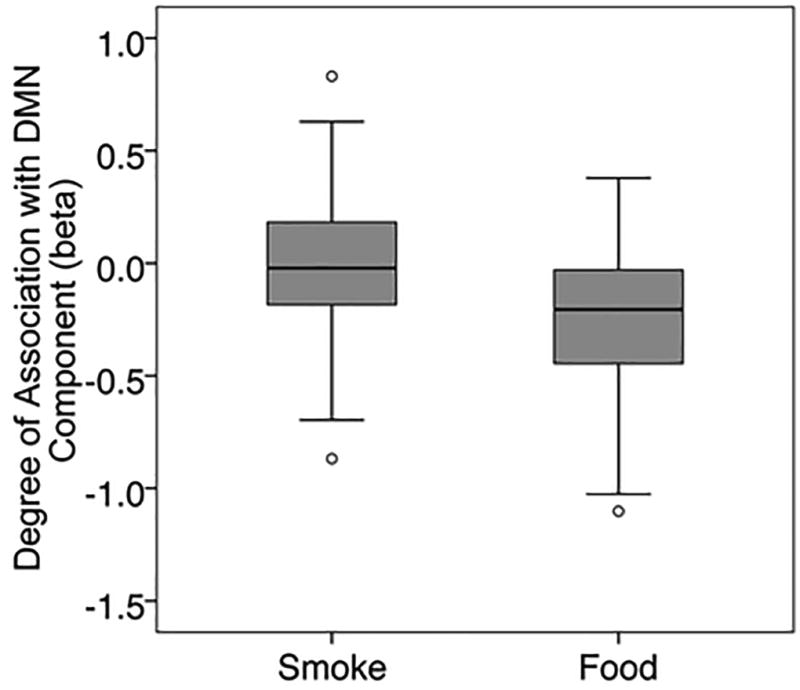
b. This boxplot presents the results for the betas for the strength of the association of the DMN component with the smoke cues and the food cues separately. The upper and lower quartiles are represented by the box, and the median is represented by a black line within the box. The T bars extend to 1.5 times the height of the box or, if no case had a value in that range, to the minimum or maximum values. Circles represent outliers.
Temporal Sort and Development of the Component Predictor Variables
For each component, we determined its task-relatedness using temporal sorting in GIFT, which utilizes the time-course of the component as the dependent variable, and variables from the design matrix of the task as independent variables. Food cues, smoking cues, and a constant were modeled which produced betas associated with each of the regressors. These betas are similar to those one would see from a typical voxelwise GLM analysis such as those performed in previous work with the same task (Claus et al., 2013), except that the betas represent the degree to which the condition of interest is associated with increases/decreases in network activity rather than individual voxel activity. Similar analyses were performed for the ECN, SN and bilateral cuneus (negative control).
Betas associated with smoke cues (Smoke) and food cues (Food) were extracted for each individual subject, and the difference between Smoke and Food was calculated (Smoke-Food). T tests were computed on the beta values corresponding to Food and Smoke to establish whether or not there was a difference between the networks’ response to the two cue types.
Clinical Outcome Prediction
Our outcome variables (NumCig 6 and 12 weeks) were count variables which appeared to have a Poisson distribution, but did not meet the assumption required for a Poisson distribution (mean equaling variance) so we chose a negative binomial with log link model to predict clinical outcomes in SPSS. This is the model of choice when a dependent variable has many zero values, and it assumes over-dispersion (Alison, 2012). In order to test a repeated measures outcome comprised of correlated variables (smoking at 6 week and 12 weeks) we used generalized estimating equations (GEE) with a robust covariance estimation method and assigned time as a within-subjects variable, and smoking as our outcome variable, which outputs a single test for the relationship between predictor and smoking outcome incorporating both 6 week and 12 week smoking outcomes. Maximum likelihood estimation (MLE) was used to estimate the negative binomial dispersion parameters and correlation matrix representing within subjects dependencies was assigned as AR(1). P values associated with the Wald Chi Square were used to test significance of predictors.
Given previous work highlighting the importance of comorbid psychiatric symptoms (Ferguson et al., 2003), age, dependence severity, longer duration of prior quit attempts, gender, presence or absence of current alcohol problems (Aubin et al., 2004; Ferguson et al., 2003; Iliceto et al., 2013; Wee et al., 2011) and impulsiveness (Sheffer et al., 2012) in treatment success, we chose to include the following clinical predictors in our outcome prediction model: FTND, age, gender, BDI, BAI, BIQ, number of serious previous quit attempts, and AUDIT. NumCig at screen (over the previous 60 days), RxGrp, baseline demographic and clinical predictors associated with outcome in previous work, the neuroimaging predictor (Smoke-Food), and an interaction term (Smoke-Food/Smoke/Food × RxGrp) were also entered as predictors, and NumCig at 6 and 12 weeks (over the previous 28 and 30 days respectively) as the predicted outcomes. When the interaction term was not significant, we reran the model without it.
In addition, we also ran the same model that we ran using Smoke-Food but using Smoke or Food alone as the neuroimaging predictor variable. Additionally, we also ran the same models in the subset of individuals with complete data only. Finally, we reran the models with fewer (only the essential) covariates. Finally, we used independent samples t-tests to compare the values for Smoke-Food, Smoke, and Food between abstinent and non-abstinent individuals at 6 and 12 weeks respectively, results for which are summarized in Table 6,7,S1–3.
Results
Table 1 presents the baseline demographic characteristics of individuals included in these analyses by medication group, and shows no significant differences between groups at baseline. Correlations (Spearman’s rho) between demographic and clinical variables and between these potential predictors and outcome were calculated and presented in Table 2. Although head motion (FD as measured by rmsRot and rmsTrans) was not correlated with Smoke, Food or Smoke-Food (ps > 0.1), it was negatively correlated with NumCig at 12 week (Table 2). Because rmsRot and rmsTrans were highly correlated with one another (rho=0.817, p<0.001), to avoid problems of multicollinearity (Tabachnick & Fidell, 1996) we chose to include only rmsRot as a covariate in all outcomes analyses because it was more strongly correlated with 12 week NumCig (rho=−0.218, p=0.009) than rmsTrans. Both WSWS and WSWS(food) were weakly correlated with the DMN Food (rho = 0.141, p = 0.094) and Smoke-Food (rho = −0.154, p=0.068) betas respectively, and so both were included as covariates in the analyses. Although QSU was not correlated with DMN Smoke-Food or NumCig at 6 weeks, it was weakly correlated with Smoke (rho = 0.144 p = 0.087), Food (rho = 0.151, p=0.072), and NumCig at 12 weeks (rho = 0.168, p=0.045) and so was also used as a covariate in all analyses. Hours since last smoked at the time of the scan was correlated neither with the neuroimaging predictor of interest (Smoke-Food) nor with NumCig at 6 or 12 weeks (Table 2) and was not used as a covariate. CO levels were obtained, and not used in the analyses, but were highly correlated with NumCig at 6 (p=0.000, rho = 0.732) and 12 (rho=0.606, p9003C;0.001) weeks. Of those with a CO > 10ppm, only 2 subjects reported no cigarettes smoked at 6 weeks and only 3 subjects at 12 weeks. The only clinical variable that was significantly correlated with Smoke-Food was the BIQ (rho=−0.20, p<0.05).
Table 1.
Baseline Characteristics by Medication Group
| Varenicline | Placebo | |
|---|---|---|
| Number of males (percent) | 52 (65%) | 39 (62%) |
| Age years (SD) | 34.3 (10.3) | 33.7 (10.0) |
| Fagerstrom Test Nicotine Dependence (SD) | 4.6 (1.9) | 4.6 (2.2) |
| NumCig Scr (SD) | 933.7 (394.9) | 931.3 (330.6) |
| Beta for Smoke-Food Cues | 0.26 (0.29) | 0.22 (0.28) |
| Beta for Smoke Cues | 0.02 (0.28) | −0.03 (0.28) |
| Beta for Food Cues | −0.24 (0.29) | −0.25 (0.31) |
| AUDIT Total Score (SD) | 5.4 (4.8) | 5.9 (5.2) |
| Beck Anxiety Inventory Total Score (SD) | 4.4 (5.6) | 3.6 (3.8) |
| Beck Depression Inventory Total Score (SD) | 2.6 (4.2) | 3.6 (4.6) |
| Barratt Impulsiveness Questionnaire | 60.7 (11.1) | 63.6 (11.4) |
| Wisconsin Withdrawal Scale Score – before scan (SD) | 11.2 (3.9) | 11.9 (3.5) |
| Questionnaire of Smoking Urges – before scan (SD) | 41.4 (13.7) | 41.4 (15.6) |
| Hours Since Last Cigarette Smoked - at time of scan (SD) | 5.23 (4.0) | 6.09 (5.1) |
| Years Been a Regular Smoker (SD) | 16.0 (10.4) | 17.0 (10.3) |
| Number Serious Quit Attempts (>12 hours abstinent) (SD) | 4.4 (5.0) | 4.9 (7.4) |
Chi square tests for dichotomous variables and independent samples t tests for continuous variables demonstrated no significant difference on any measures between varenicline and placebo groups. All measures were obtained prior to initiation of treatment. NumCig Scr = total number of cigarettes smoked during the previous 60 days at the screen visit.
Table 2.
Bivariate Correlations (Spearman’s rho) Between Baseline Variables, Smoking Outcomes, and Head Motion
| Age | FTN | Scr | Quit | S-F | S | F | Aud | BAI | BDI | BIQ | WS | WSf | QSU | Hrs | 6wk | 12wk | rmsT |
|---|---|---|---|---|---|---|---|---|---|---|---|---|---|---|---|---|---|
| 1 | |||||||||||||||||
| 0.04 | 1 | ||||||||||||||||
| 0.07 | 0.44** | 1 | |||||||||||||||
| 0.27** | −0.05 | −0.09 | 1 | ||||||||||||||
| 0.06 | −0.12 | 0.03 | 0.02 | 1 | |||||||||||||
| −0.06 | 0.12 | 0.09 | −0.05 | 0.39** | 1 | ||||||||||||
| −0.08 | 0.22** | 0.05 | −0.04 | −0.54** | 0.50** | 1 | |||||||||||
| −0.19* | −0.17* | −0.15 | 0.02 | −0.05 | 0.04 | 0.05 | 1 | ||||||||||
| −0.06 | 0.07 | 0.03 | 0.11 | −0.06 | −0.12 | −0.02 | −0.10 | 1 | |||||||||
| 0.06 | 0.01 | 0.03 | 0.09 | −0.06 | −0.09 | −0.02 | −0.02 | 0.30** | 1 | ||||||||
| 0.07 | −0.03 | −0.04 | 0.01 | −0.20* | −0.03 | 0.12 | 0.18* | 0.20* | 0.29* | 1 | |||||||
| −0.04 | 0.25** | −0.01 | 0.12 | −0.13 | 0.02 | 0.14^ | 0.03 | 0.38** | 0.38** | 0.37** | 1 | ||||||
| 0.05 | 0.20* | 0.06 | 0.05 | −0.15^ | −0.02 | 0.13 | 0.01 | 0.13 | 0.17* | 0.08 | 0.49** | 1 | |||||
| −0.05 | 0.49** | 0.26** | −0.01 | −0.03 | 0.14^ | 0.15^ | −0.13 | 0.10 | −0.04 | 0.03 | 0.28** | 0.14 | 1 | ||||
| −0.02 | −0.20* | −0.29** | 0.04 | 0.01 | 0.03 | 0.00 | 0.26** | −0.10 | −.015 | 0.01 | −0.06 | −0.08 | 0.05 | 1 | |||
| −0.06 | 0.22** | 0.21** | −0.15^ | −0.24** | −0.04 | 0.17* | 0.08 | −0.02 | 0.14 | 0.05 | 0.09 | 0.03 | 0.13 | −0.05 | 1 | ||
| −0.13 | 0.29** | 0.25** | −0.15^ | −0.24** | −0.00 | 0.19* | 0.09 | −0.03 | 0.08 | 0.09 | 0.04 | −0.02 | 0.17* | −0.06 | 0.84** | 1 | |
| 0.24** | −0.02 | −0.00 | 0.06 | 0.06 | 0.07 | 0.01 | 0.04 | −0.02 | 0.12 | 0.08 | 0.10 | 0.08 | 0.13 | 0.10 | −0.15 | −0.19* | 1 |
| 0.30** | 0.02 | −0.04 | 0.10 | 0.07 | −0.02 | −0.09 | −0.01 | −0.08 | 0.11 | 0.05 | 0.07 | 0.06 | 0.14 | 0.11 | −0.14 | −0.22** | 0.82** |
Significant at p <0.1
Significant at p < 0.05
Significant at p < 0.01
RxGrp = Medication Condition (varenicline = 1, placebo = 0). Gen = gender (male = 1, female = 2), FTN = Fagerstrom Test for Nicotine Dependence, Scr = total number of cigarettes smoked during prior 60 days at the screen visit, Quit = number of times an attempt to quit smoking made where participant stayed off cigarettes for > 12 hrs, S-F = beta for degree of association of DMN component with smoke cues minus for food cues, S = beta for degree of association of DMN component with smoke cues, F = beta for degree of association of DMN component with food cues, Aud = AUDIT total score, BAI = Beck Anxiety Inventory Total Score, BDI = Beck Depression Inventory Total Score, BIQ = Barratt Impulsiveness Questionnaire, WS = Wisconsin Withdrawal Scale Score – pre MRI scan, WSf = sum of food-related questions only on WSWS, Hrs = Hours since last cigarette was smoked prior to the MRI scan, 6wk = total number of cigarettes smoked during prior 28 days at the 6 week follow-up visit, 12wk = total number of cigarettes smoked during prior 30 days at the 12 week follow-up visit, rmsT = root mean square translational framewise displacement, rmsR = root mean square translational framewise displacement (latter 2 variables approximate head motion during the cue task).
The DMN component was strongly negatively associated with onset of Food and weakly negatively associated with onset of Smoke (Table 3; Figure 1b). A paired T-test (n=143) demonstrated significant differences between betas associated with Smoke versus those associated with Food. For our exploratory components, paired T-tests demonstrated significant differences between the betas associated with Smoke versus Food for R ECN and L ECN but not for SN (Table 3). Correlations between the DMN and exploratory components (Table 4) demonstrated a negative correlation between DMN and SN (Smoke-Food, Smoke, Food), and a positive correlation between DMN and R ECN (Food), and between DMN and L ECN (Smoke-Food, Smoke).
Table 3.
Paired T-tests comparing mean betas for Smoke vs. Food for Primary and Exploratory Components
| Mean Smoke (SD) |
Mean Food (SD) | T | p | |
|---|---|---|---|---|
| DMN | −0.001 (0.28) | −0.24 (0.30) | 9.92 | <0.001 |
| R ECN | −0.152 (0.25) | 0.251 (0.29) | 6.153 | <0.001 |
| L ECN | −0.005 (0.29) | 0.043 (0.33) | 2.038 | 0.043 |
| SN | 0.251(0.29) | 0.258 (0.33) | −0.316 | 0.753 |
DMN = default mode network, ECN = Executive Control Network, SN = Salience Network, R = right, L = left, Smoke = beta for degree of association of component with smoke cues, Food = beta for degree of association of component with food cues, SD = standard deviation
Table 4.
Bivariate Correlations (Spearman’s rho) Between DMN Component and Exploratory (R ECN, L ECN, SN) Components
| DMN S-F |
DMN S | DMN F | R ECN S-F |
R ECN S |
R ECN F |
L ECN S-F |
L ECN S |
L ECN F |
|
|---|---|---|---|---|---|---|---|---|---|
| R ECN S-F | 0.280** | ||||||||
| R ECN S | 0.086 | ||||||||
| R ECN F | 0.324** | ||||||||
| L ECN S-F | 0.142^ | 0.169* | |||||||
| L ECN S | 0.202* | 0.055 | |||||||
| L ECN F | 0.130 | 0.503** | |||||||
| SN S-F | −0.270** | 0.065 | 0.107 | ||||||
| SN S | −0.373** | 0.011 | −0.083 | ||||||
| SN F | −0.319** | −0.076 | −0.115 |
Significant at p <0.1
Significant at p < 0.05
Significant at p < 0.01
DMN = default mode network, ECN = Executive Control Network, SN = Salience Network, R = right, L = left, S-F = beta for degree of association of component with smoke cues minus for food cues, S = beta for degree of association of component with smoke cues, F = beta for degree of association of component with food cues
For Smoke-Food for the DMN component, the interaction term (Smoke-Food × RxGrp) was not significant (p=0.673), and the model was rerun without it. There was a significant overall effect (p=0.005, beta = −0.767, exponential beta [Exp(B)]=0.46) of the DMN component for Smoke-Food on smoking outcome, such that a smaller beta weight difference predicted less reduction in smoking at the follow-up appointment (Table 5). These findings indicated that the more the profile of the DMN component during the smoke cues approached that of the food cues, the worse the treatment outcome. Additionally, although there were no significant interaction terms when Food and Smoke models (Smoke×RxGrp p=0.796; Food×RxGrp p=0.809) were run separately, Food (p=0.006, beta=0.678, Exp(B)=1.97) but not Smoke (p=0.720, beta=−0.102, Exp(B)=0.72) predicted smoking outcome indicating that a smaller degree of DMN deactivation during food cues predicted a worse treatment outcome (Table 5). From the standpoint of clinical variables, the strongest outcome predictors in all three models were the number of cigarettes the participant reported in the 60 days prior to the screen visit, the medication group assignment, and the number of reported previous serious quit attempts.
Table 5.
Outcome Prediction Results Using Generalized Estimating Equations
| Beta / Exp(B) | |||
|---|---|---|---|
| Smoke - Food | Smoke | Food | |
| DMN | −0.766/0.47** | −0.102/0.72 | 0.678/1.97** |
| RxGrp | −0.450/0.64** | −0.467/0.63** | 0.160/1.17** |
| Gender | 0.137/1.15 | 0.059/1.06 | −0.003/1.00 |
| Age | −0.001/1.00 | −0.002/1.00 | −0.003/1.00 |
| FTND | 0.086/1.09^ | 0.085/1.09* | 0.066/1.07 |
| Scr | 0.001/1.00** | 0.001/1.00** | 0.001/1.00** |
| Quit | −0.025/0.98* | −0.027/0.97* | −0.027/0.97* |
| AUDIT | 0.013/1.01 | 0.015/1.02 | 0.012/1.01 |
| BAI | 0.000/1.00 | 0.001/1.00 | 0.007/1.01 |
| BDI | 0.017/1.02 | 0.023/1.02 | 0.013/1.01 |
| BIQ | 0.009/1.01 | 0.027/1.03 | 0.005/1.01 |
| WSW | −0.024/0.98 | −0.019/0.98 | −0.018/0.98 |
| WSWFood | −0.005/1.00 | 0.007/1.01 | −0.005/1.00 |
| QSU | 0.003/1.003 | 0.002/1.00 | 0.003/1.00 |
| rmsRot | −1.126/0.32^ | −1.150/0.317^ | −1.099/0.33^ |
p<0.1
Significant at p < 0.05
Significant at p < 0.01
Because the interaction terms (Smoke-Food × RxGrp, Smoke × RxGrp, Food × RxGrp) were not significant or trending towards significant, results without the interaction terms are presented. Exp(B) = exponential beta, DMN = default mode network, Smoke - Food = beta for degree of association of DMN component with smoke cues minus for food cues, Smoke = beta for degree of association of DMN component with smoke cues, Food = beta for degree of association of DMN component with food cues, RxGrp = Medication Condition (varenicline = 1, placebo = 0), Gender (male = 1, female = 2), FTND = Fagerstrom Test for Nicotine Dependence, Scr = number of cigarettes smoked during prior 60 days at screen, Quit = Number Serious Quit Attempts (>12 hours abstinent),,AUDIT = AUDIT Total Score, BAI = Beck Anxiety Inventory Total Score, BDI = Beck Depression Inventory Total Score, BIQ = Barratt Impulsiveness Questionnaire Total Score, WSW = Wisconsin Withdrawal Scale Score pre MRI scan, WSWFood=sum of food-related questions only on WSWS, QSU = Questionnaire of Smoking Urges, rmsRot = root mean square translational framewise displacement (head motion at time of MRI scan).
Repeating the analyses with all of the same covariates on individuals with complete data only (not imputing to baseline smoking) showed no significant interaction terms (ps>0.01), a significant effect of Smoke-Food (p=0.049, beta=−0.715, Exp(B)=0.489) but no effects of Smoke (p=0.296, beta=−0.469, Exp(B)=0.626) or Food (p=0.427, beta=0.304, Exp(B)=1.355) on smoking outcome. These and results for abstinence based outcomes (Table 6,7,S1–3) support the particular importance of the Smoke-Food contrast over that of the individual cue types (Smoke alone, Food alone) for predicting treatment outcome. Finally, to confirm that over fitting was not driving results, we reran the outcome prediction analyses dropping variables demonstrating no relationship with outcome which showed similar results (Table S4).
For the exploratory components, we ran the same GEE models using a smaller subset of covariates to avoid over-fitting (see Supporting Information for details), and observed significant (or trending towards significant) interaction terms for R ECN for the full (imputed) sample for Smoke (p=0.048) and Smoke-Food (p=0.059), for L ECN for individuals with complete data only (non-imputed) sample for Smoke-Food (p=0.045), and for SN for Food for individuals with complete data only (p=0.009) and for SN for individuals with complete data only for Smoke-Food (p=0.067). There were no additional significant interaction terms or, when models were rerun without the interaction terms, overall significant relationships between Food, Smoke, or Smoke-Food betas associated with ECN, SN, or cuneus (negative control) and outcome. The interactions were explored further (Table 8) in two ways: 1) we did a median split on the betas associated with the cue of interest, and then ran the analyses and looked for differences in the RxGrp effect 2) we split groups into varenicline and placebo groups and looked for differences in the ability of the betas to predict outcome. These analyses indicated that varenicline worked best (relative to placebo) in individuals who had more positive values for Smoke and Smoke-Food in R ECN, who had more positive values for Smoke-Food in L ECN, and in in individuals who had greater activation of the SN to Food. It also indicated that greater R ECN Smoke-Food predicted greater improvement in individuals on varenicline but not in those on placebo.
Table 8.
Exploring Significant Interaction Terms (Smoke-Food/Smoke/Food × RxGrp) for Exploratory Components (SN, ECN): Binning by High and Low Smoke-Food/Smoke/Food and by Placebo/Varenicline
| Full Sample RxGrp Beta / Exp(B) | Non Imputed Sample RxGrp Beta / Exp(B) | ||
| R ECN | Smoke – Food High R ECN | −1.494/0.224** | −1.494**/0.224** |
| Smoke – Food Low R ECN | −0.418/0.658^ | −0.453/0.636 | |
| Smoke High R ECN | −0.672/0.511** | −0.898/0.408** | |
| Smoke Low R ECN | −0.450/0.637* | −0.384/0.681 | |
| L ECN | Smoke – Food High L ECN | −0.675/0.509** | −0.772/0.462* |
| Smoke – Food Low L ECN | −0.220/0.802 | −0.011/0.989 | |
| SN | Smoke – Food High SN | −0.527/0.590* | −0.669/0.512** |
| Smoke – Food Low SN | −0.502/0.605** | −1.074/0.342** | |
| Food High SN | −0.550/0.577* | −0.987/0.373** | |
| Food Low SN | −0.477/0.620* | −0.289/0.749 | |
| Full SampleComponent Beta / Exp(B) | Non Imputed SampleComponent Beta / Exp(B) | ||
| R ECN | Smoke – Food Placebo | 0.049/1.050 | 0.125/1.133 |
| Smoke – Food Varenicline | −1.053/0.349** | −1.351/0.259** | |
| Smoke Placebo | 0.558/1.747^ | 0.554/1.740 | |
| Smoke Varenicline | −0.186/0.830 | 0.076/1.079 | |
| L ECN | Smoke – Food Placebo | 0.039/1.039 | 0.864/2.372* |
| Smoke – Food Varenicline | −0.198/0.820 | −0.410/0.664 | |
| SN | Smoke – Food Placebo | −0.235/0.791 | −0.693/0.500^ |
| Smoke – Food Varenicline | 0.401/1.493 | 1.082/2.952 | |
| Food Placebo | 0.286/1.332 | 0.550/1.734 | |
| Food Varenicline | −0.521/0.594 | −1.314/0.269* |
p<0.1
Significant at p < 0.05
Significant at p < 0.01
High and Low groups for each of the components during Smoke-Food, Smoke, or Food were derived by doing a median split on the betas. Exp(B) = exponential beta, ECN = executive control network, SN = Salience Network, R = right, L = left, Smoke - Food = beta for degree of association of component with smoke cues minus for food cues, Smoke = beta for degree of association of component with smoke cues, Food = beta for degree of association of component with food cues, RxGrp = Medication Condition (varenicline = 1, placebo = 0). Other predictors were included in these models (specifics in Supporting Information) but results not reported here for simplicity.
Discussion
In summary, DMN response to smoke relative to food cues was associated with treatment outcome, controlling for several clinical variables associated with treatment outcome in previous work. Specifically, a lower value for Smoke–Food during the task predicted a greater likelihood of poor outcome during treatment, indicating that the more the deactivation of the DMN to the smoke cues approached that associated with the food cues, the worse outcome the individual was likely to have. DMN is active in self-referential processing and rumination, and deactivated during tasks that are attention grabbing and require executive control (Fox et al., 2005). We had expected that there would be greater deactivation in DMN to food cues compared to smoke cues, based on previous work (Claus et al., 2013; Tomasi et al., 2015). An explanation for this somewhat counter-intuitive but replicating finding is that, even in individuals with SUD, food cues are often still more palatable than drug cues (as demonstrated in previous work in AUD assessing palatability of alcohol versus food cues) (Pronk et al., 2015). The degree of deactivation to food cues could be understood to represent the general capacity of the DMN to deactivate to a palatable cue and may serve as a baseline that represents the maximum degree to which the cue can capture an individual’s attention. Our outcome prediction findings could therefore indicate that individuals for whom the smoking cue has a greater ability to capture attention relative to the overall capacity of the DMN to deactivate (as represented by the response to food cue) are more vulnerable to relapse during treatment.
Another additional surprising finding was that the DMN’s response to food cue was independently able to predict treatment outcome, such that a lower degree of DMN deactivation during food cues predicted a worse treatment outcome. Granted, this effect was not present in the supporting analyses which involved using only the available data, or the analyses comparing neuroimaging variable values between abstinent and non-abstinent individuals (Table 6,7,S1–3), and the effect of food cues in the primary analyses was smaller than that observed for the difference score. However, these findings could indicate that general DMN pathology is driving some of the Smoke-Food results, and that lower deactivation to food cue may be a biomarker of muted response to natural rewards (Tomasi et al., 2015). Relatedly, individuals with more severe levels of dependence may have muted responses to food cues due to effects of chronic smoking on neuropeptide levels regulating appetite (Chen et al., 2008).
The predictive effects of DMN on smoking outcome were observed after correcting for the effects of other clinical covariates which have been previously observed to predict outcomes during smoking cessation treatment. In this study, baseline number of cigarettes smoked, number of previous quit attempts, and, more weakly, self-reported dependence severity were predictors of outcome (in addition to medication group assignment, as expected), but the other clinical variables were not. These findings highlight the potential importance of using brain activation during drug cues to predict treatment outcomes as it may turn out to be a more sensitive or reliable marker of future clinical behavior. Indeed, in other work in NUD, greater insula activation to smoking cues was significantly predictive of worse outcome, observed with only 21 subjects (partial eta squared .27; large effect) (Janes et al., 2010), and smokers who showed lower pre-quit levels of brain reactivity to pleasant stimuli than to cigarette-related cues were less likely to be abstinent 6 months after their quit attempt, observed with only 55 subjects (odds ratio of 6.34 at 24 weeks; medium to large effect) (Versace et al., 2014).
The results from the exploratory analyses of ECN and SN were notable. For one, in line with our working model that food cues were more engaging than smoke cues, food cues were associated with greater (positive) engagement of both ECN (significant) and SN (non-significant) compared to smoke cues. Second, DMN was negatively correlated with SN, in line with previous work (Lerman et al., 2014) but, surprisingly, it was not negatively correlated with ECN. In the presence of appetitive cues, the relationships between ECN and DMN may be different than they are during cognitive tasks or at rest. Most importantly perhaps, there were significant interaction terms (Smoke-Food/Smoke/Food×RxGrp) when these networks were used as predictors. Exploring these interactions further indicated that some of these markers (more positive values in R ECN to Smoke-Food and to Smoke, more positive values in L ECN to Smoke-Food, and greater activation in SN to Food) might prove useful in treatment matching as they identify individuals more likely to respond to treatment with varenicline. Furthermore, more positive values of Smoke-Food for R ECN was associated with greater improvement in individuals on varenicline but not placebo. Previous work has shown that varenicline is associated with decreased activation to smoking cues in regions of the R ECN (Franklin et al., 2011). In combination with our data, this might indicate that varenicline is working in this region in individuals with greater activation to Smoke and Smoke-Food by decreasing smoking cue-induced signal.
That the food cues were associated with greater deactivation in DMN than the smoke cues (in fact the smoke cues alone resulted in almost no mean DMN deactivation) could indicate that food cues were more appetitive; unfortunately one limitation to our study is that we did not obtain ratings of palatability. However, even if this is true, this was not an especially striking limitation, given that the difference between these two cues was still able to predict clinical outcome. Although individuals with SUD are generally conceptualized to have increased sensitivity to drug rewards but lower sensitivity to natural rewards such as food (Koob & Volkow, 2009; Volkow et al., 2010), this is not always observed in NUD; other work has demonstrated that some individuals with NUD responded more to smoking cues relative to other pleasurable cues, and others less, and that these categories predicted smoking outcomes during NUD treatment (Versace et al., 2014). Both these results (Versace et al., 2014) and our findings demonstrate that it is the relative strength of these cues that matters clinically in NUD. Furthermore, one could raise concerns about the validity of using food cues as a baseline, especially since an individual’s hunger levels could affect the brain’s response (Thomas et al., 2015). For this reason, we included a measure of food craving [WSWS(food)] as a covariate in all relevant analyses, to control for this. Finally, in some cases, results differed between the full sample (outcomes imputed to baseline) and the smaller sample with complete data (DMN Food, Table 8); when results did not replicate in both samples we did not highlight them in the discussion. These differences may have been driven by differences between the populations (details in Supplemental Results).
In summary, these findings indicating that DMN deactivation to smoke cues relative to food cues robustly predicted clinical outcome are novel and important. Notably, this is one of the first works in any SUD to directly investigate the pattern of DMN activity during the processing of palatable cues and to investigate the relationship between DMN deactivation to drug cue in relation to food cue as a marker of relapse vulnerability. Although brain activation to nicotine and other drug cues has been studied and documented and its clinical importance established in a variety of clinical populations (Courtney et al., 2016; Franklin et al., 2011; Janes et al., 2010; Kwako et al., 2015; Mann et al., 2014; Versace et al., 2014), very little work has focused on the effects of drug and other reward cues on DMN activity and its clinical relevance. Future work should attempt to replicate these findings in other NUD treatment samples, as well as in other SUD, to identify whether or not this is a reliable method to predict overall treatment outcome and/or predict response to particular treatments.
Supplementary Material
Figure 2.
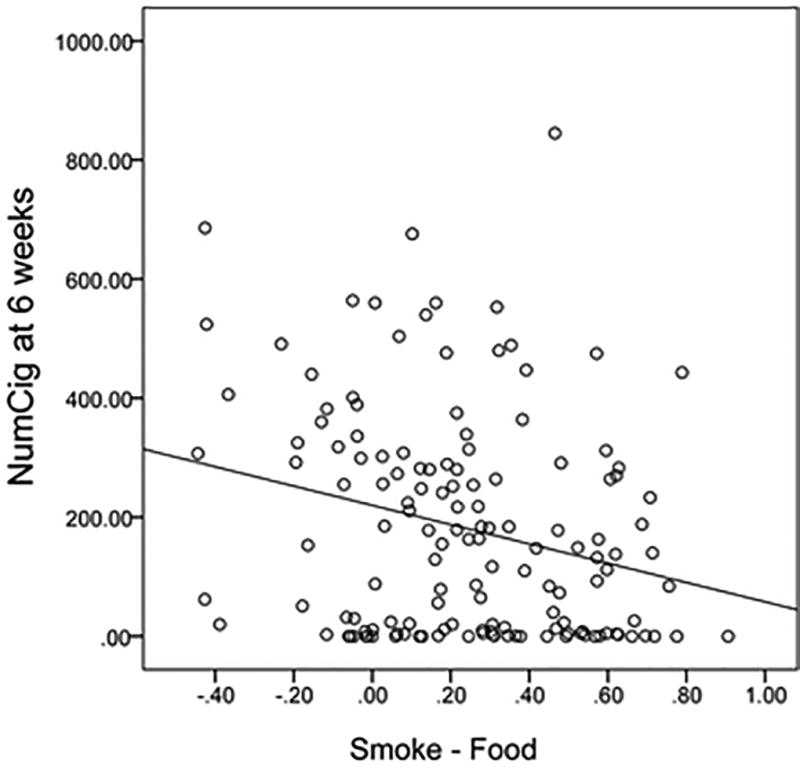
This figure demonstrates a simple scatter plot showing the relationship between the beta for the strength of the association of the DMN component with the smoke versus food cues (Smoke - Food) and total number of cigarettes smoked in the 28 days prior to the week 6 visit (NumCig at 6 weeks).
Acknowledgments
This research was supported by grant number 1R01-DA025074 awarded to Kent Hutchison and grant number K23-AA021156 awarded to Claire Wilcox.
Footnotes
This data was previously presented at the Organization for Human Brain Mapping, 2016, under the abstract title: “Default mode network deactivation to smoking cue predicts treatment outcome in nicotine use disorder.”
Financial Disclosures
The authors have no conflicts of interest to declare.
References
- Alison PD. Logistic Regression Using SAS®: Theory and Application, Second Edition. SAS Institute; 2012. [Google Scholar]
- Anticevic A, Cole MW, Murray JD, Corlett PR, Wang XJ, Krystal JH. The role of default network deactivation in cognition and disease. Trends Cogn Sci. 2012;16(12):584–592. doi: 10.1016/j.tics.2012.10.008. [DOI] [PMC free article] [PubMed] [Google Scholar]
- Aubin HJ, Lebargy F, Berlin I, Bidaut-Mazel C, Chemali-Hudry J, Lagrue G. Efficacy of bupropion and predictors of successful outcome in a sample of French smokers: a randomized placebo-controlled trial. Addiction. 2004;99(9):1206–1218. doi: 10.1111/j.1360-0443.2004.00814.x. [DOI] [PubMed] [Google Scholar]
- Begh R, Lindson-Hawley N, Aveyard P. Does reduced smoking if you can't stop make any difference? BMC Med. 2015;13:257. doi: 10.1186/s12916-015-0505-2. [DOI] [PMC free article] [PubMed] [Google Scholar]
- Brody AL, Mukhin AG, Mamoun MS, Luu T, Neary M, Liang L, Shieh J, Sugar CA, Rose JE, Mandelkern MA. Brain nicotinic acetylcholine receptor availability and response to smoking cessation treatment: a randomized trial. JAMA Psychiatry. 2014;71(7):797–805. doi: 10.1001/jamapsychiatry.2014.138. [DOI] [PMC free article] [PubMed] [Google Scholar]
- Calhoun VD, Adali T, Pearlson GD, Pekar JJ. A method for making group inferences from functional MRI data using independent component analysis. Hum Brain Mapp. 2001;14(3):140–151. doi: 10.1002/hbm.1048. [DOI] [PMC free article] [PubMed] [Google Scholar]
- Calhoun VD, Kiehl KA, Pearlson GD. Modulation of temporally coherent brain networks estimated using ICA at rest and during cognitive tasks. Hum Brain Mapp. 2008;29(7):828–838. doi: 10.1002/hbm.20581. [DOI] [PMC free article] [PubMed] [Google Scholar]
- Chen H, Hansen MJ, Jones JE, Vlahos R, Anderson GP, Morris MJ. Long-term cigarette smoke exposure increases uncoupling protein expression but reduces energy intake. Brain Res. 2008;1228:81–88. doi: 10.1016/j.brainres.2008.06.067. [DOI] [PubMed] [Google Scholar]
- Claus ED, Blaine SK, Filbey FM, Mayer AR, Hutchison KE. Association Between Nicotine Dependence Severity, BOLD Response to Smoking Cues, and Functional Connectivity. Neuropsychopharmacology. 2013;38:2363–2372. doi: 10.1038/npp.2013.134. [DOI] [PMC free article] [PubMed] [Google Scholar]
- Courtney KE, Schacht JP, Hutchison K, Roche DJ, Ray LA. Neural substrates of cue reactivity: association with treatment outcomes and relapse. Addict Biol. 2016;21(1):3–22. doi: 10.1111/adb.12314. [DOI] [PMC free article] [PubMed] [Google Scholar]
- Ebbert JO, Hughes JR, West RJ, Rennard SI, Russ C, McRae TD, Treadow J, Yu CR, Dutro MP, Park PW. Effect of varenicline on smoking cessation through smoking reduction: a randomized clinical trial. JAMA. 2015;313(7):687–694. doi: 10.1001/jama.2015.280. [DOI] [PMC free article] [PubMed] [Google Scholar]
- Engelmann JM, Versace F, Robinson JD, Minnix JA, Lam CY, Cui Y, Brown VL, Cinciripini PM. Neural substrates of smoking cue reactivity: a meta-analysis of fMRI studies. Neuroimage. 2012;60(1):252–262. doi: 10.1016/j.neuroimage.2011.12.024. [DOI] [PMC free article] [PubMed] [Google Scholar]
- Erhardt EB, Rachakonda S, Bedrick EJ, Allen EA, Adali T, Calhoun VD. Comparison of multi-subject ICA methods for analysis of fMRI data. Hum Brain Mapp. 2011;32(12):2075–2095. doi: 10.1002/hbm.21170. [DOI] [PMC free article] [PubMed] [Google Scholar]
- Ferguson JA, Patten CA, Schroeder DR, Offord KP, Eberman KM, Hurt RD. Predictors of 6-month tobacco abstinence among 1224 cigarette smokers treated for nicotine dependence. Addict Behav. 2003;28(7):1203–1218. doi: 10.1016/s0306-4603(02)00260-5. [DOI] [PubMed] [Google Scholar]
- Fox MD, Snyder AZ, Vincent JL, Corbetta M, Van Essen DC, Raichle ME. The human brain is intrinsically organized into dynamic, anticorrelated functional networks. Proc Natl Acad Sci U S A. 2005;102(27):9673–9678. doi: 10.1073/pnas.0504136102. [DOI] [PMC free article] [PubMed] [Google Scholar]
- Franco AR, Pritchard A, Calhoun VD, Mayer AR. Interrater and intermethod reliability of default mode network selection. Hum Brain Mapp. 2009;30(7):2293–2303. doi: 10.1002/hbm.20668. [DOI] [PMC free article] [PubMed] [Google Scholar]
- Franklin T, Wang Z, Suh JJ, Hazan R, Cruz J, Li Y, Goldman M, Detre JA, O'Brien CP, Childress AR. Effects of varenicline on smoking cue-triggered neural and craving responses. Arch Gen Psychiatry. 2011;68(5):516–526. doi: 10.1001/archgenpsychiatry.2010.190. [DOI] [PMC free article] [PubMed] [Google Scholar]
- Gonzales D, Rennard S, Nides M, Oncken C, Azoulay S, Billing C, Watsky E, Gong J, Williams K, Reeves K. Varenicline, an alpha4beta2 nicotinic acetylcholine receptor partial agonist, vs sustained-release bupropion and placebo for smoking cessation: a randomized controlled trial. Jama. 2006;296(1):47–55. doi: 10.1001/jama.296.1.47. [DOI] [PubMed] [Google Scholar]
- Hartmann-Boyce J, Stead LF, Cahill K, Lancaster T. Efficacy of interventions to combat tobacco addiction: Cochrane update of 2013 reviews. Addiction. 2014;109(9):1414–1425. doi: 10.1111/add.12633. [DOI] [PubMed] [Google Scholar]
- Hartwell KJ, Lematty T, McRae-Clark AL, Gray KM, George MS, Brady KT. Resisting the urge to smoke and craving during a smoking quit attempt on varenicline: results from a pilot fMRI study. Am J Drug Alcohol Abuse. 2013;39(2):92–98. doi: 10.3109/00952990.2012.750665. [DOI] [PMC free article] [PubMed] [Google Scholar]
- Higgins JP, White IR, Wood AM. Imputation methods for missing outcome data in meta-analysis of clinical trials. Clin Trials. 2008;5(3):225–239. doi: 10.1177/1740774508091600. [DOI] [PMC free article] [PubMed] [Google Scholar]
- Iliceto P, Fino E, Pasquariello S, D'Angelo Di Paola ME, Enea D. Predictors of success in smoking cessation among Italian adults motivated to quit. J Subst Abuse Treat. 2013;44(5):534–540. doi: 10.1016/j.jsat.2012.12.004. [DOI] [PubMed] [Google Scholar]
- Janes AC, Pizzagalli DA, Richardt S, de BFB, Chuzi S, Pachas G, Culhane MA, Holmes AJ, Fava M, Evins AE, Kaufman MJ. Brain reactivity to smoking cues prior to smoking cessation predicts ability to maintain tobacco abstinence. Biol Psychiatry. 2010;67(8):722–729. doi: 10.1016/j.biopsych.2009.12.034. [DOI] [PMC free article] [PubMed] [Google Scholar]
- Jenkinson M. Measuring Transformation Error by RMS. 2003 Deviation, from http://wwwfmriboxacuk/analysis/techrep/tr99mj1/tr99mj1/indexhtml.
- King DP, Paciga S, Pickering E, Benowitz NL, Bierut LJ, Conti DV, Kaprio J, Lerman C, Park PW. Smoking cessation pharmacogenetics: analysis of varenicline and bupropion in placebo-controlled clinical trials. Neuropsychopharmacology. 2012;37(3):641–650. doi: 10.1038/npp.2011.232. [DOI] [PMC free article] [PubMed] [Google Scholar]
- King G, Zeng L. Logistic Regression in Rare Events Data. Political Analysis. 2001;9:137–163. [Google Scholar]
- Koob GF, Volkow ND. Neurocircuitry of Addiction. Neuropsychopharmacology. 2009;35(1):217–238. doi: 10.1038/npp.2009.110. [DOI] [PMC free article] [PubMed] [Google Scholar]
- Kwako LE, Momenan R, Litten RZ, Koob GF, Goldman D. Addictions Neuroclinical Assessment: A Neuroscience-Based Framework for Addictive Disorders. Biol Psychiatry. 2015 doi: 10.1016/j.biopsych.2015.10.024. [DOI] [PMC free article] [PubMed] [Google Scholar]
- Lerman C, Gu H, Loughead J, Ruparel K, Yang Y, Stein EA. Large-scale brain network coupling predicts acute nicotine abstinence effects on craving and cognitive function. JAMA Psychiatry. 2014;71(5):523–530. doi: 10.1001/jamapsychiatry.2013.4091. [DOI] [PMC free article] [PubMed] [Google Scholar]
- Lerman C, Schnoll RA, Hawk LW, Jr, Cinciripini P, George TP, Wileyto EP, Swan GE, Benowitz NL, Heitjan DF, Tyndale RF, Group P-PR. Use of the nicotine metabolite ratio as a genetically informed biomarker of response to nicotine patch or varenicline for smoking cessation: a randomised, double-blind placebo-controlled trial. Lancet Respir Med. 2015;3(2):131–138. doi: 10.1016/S2213-2600(14)70294-2. [DOI] [PMC free article] [PubMed] [Google Scholar]
- Littlewood RA, Claus ED, Wilcox CE, Mickey J, Arenella P, Bryan AD, Hutchison KE. Moderators of Smoking Cessation and Reduction in a Randomized-Controlled Trial of Varenicline versus Placebo. doi: 10.1007/s00213-017-4721-7. (Submitted) [DOI] [PubMed] [Google Scholar]
- Ma S, Correa NM, Li XL, Eichele T, Calhoun VD, Adali T. Automatic identification of functional clusters in FMRI data using spatial dependence. IEEE Trans Biomed Eng. 2011;58(12):3406–3417. doi: 10.1109/TBME.2011.2167149. [DOI] [PMC free article] [PubMed] [Google Scholar]
- Mann K, Vollstadt-Klein S, Reinhard I, Lemenager T, Fauth-Buhler M, Hermann D, Hoffmann S, Zimmermann US, Kiefer F, Heinz A, Smolka MN. Predicting naltrexone response in alcohol-dependent patients: the contribution of functional magnetic resonance imaging. Alcohol Clin Exp Res. 2014;38(11):2754–2762. doi: 10.1111/acer.12546. [DOI] [PubMed] [Google Scholar]
- McClure JB, Swan GE, Catz SL, Jack L, Javitz H, McAfee T, Deprey M, Richards J, Zbikowski SM. Smoking outcome by psychiatric history after behavioral and varenicline treatment. J Subst Abuse Treat. 2010;38(4):394–402. doi: 10.1016/j.jsat.2010.03.007. [DOI] [PMC free article] [PubMed] [Google Scholar]
- Niaura R, Goldstein MG, Abrams DB. Matching high- and low-dependence smokers to self-help treatment with or without nicotine replacement. Prev Med. 1994;23(1):70–77. doi: 10.1006/pmed.1994.1010. [DOI] [PubMed] [Google Scholar]
- Perkins KA, Mercincavage M, Fonte CA, Lerman C. Varenicline's effects on acute smoking behavior and reward and their association with subsequent abstinence. Psychopharmacology (Berl) 2010;210(1):45–51. doi: 10.1007/s00213-010-1816-9. [DOI] [PMC free article] [PubMed] [Google Scholar]
- Pronk T, van Deursen DS, Beraha EM, Larsen H, Wiers RW. Validation of the Amsterdam Beverage Picture Set: A Controlled Picture Set for Cognitive Bias Measurement and Modification Paradigms. Alcohol Clin Exp Res. 2015;39(10):2047–2055. doi: 10.1111/acer.12853. [DOI] [PMC free article] [PubMed] [Google Scholar]
- Rachakonda S, Egolf E, Correa NM, Calhoun VD. Group ICA of fMRI Toolbox (GIFT) 2007 Manual. [Google Scholar]
- Richmond RL, Kehoe L. Ten-year survival outcome of the nicotine transdermal patch with cognitive behavioural therapy. Aust N Z J Public Health. 2007;31(3):282–285. doi: 10.1111/j.1467-842x.2007.00062.x. [DOI] [PubMed] [Google Scholar]
- Rollema H, Chambers LK, Coe JW, Glowa J, Hurst RS, Lebel LA, Lu Y, Mansbach RS, Mather RJ, Rovetti CC, Sands SB, Schaeffer E, Schulz DW, Tingley FD, 3rd, Williams KE. Pharmacological profile of the alpha4beta2 nicotinic acetylcholine receptor partial agonist varenicline, an effective smoking cessation aid. Neuropharmacology. 2007;52(3):985–994. doi: 10.1016/j.neuropharm.2006.10.016. [DOI] [PubMed] [Google Scholar]
- Sheffer C, Mackillop J, McGeary J, Landes R, Carter L, Yi R, Jones B, Christensen D, Stitzer M, Jackson L, Bickel W. Delay discounting, locus of control, and cognitive impulsiveness independently predict tobacco dependence treatment outcomes in a highly dependent, lower socioeconomic group of smokers. Am J Addict. 2012;21(3):221–232. doi: 10.1111/j.1521-0391.2012.00224.x. [DOI] [PMC free article] [PubMed] [Google Scholar]
- Tabachnick BG, Fidell LS. Using multivariate statistics. New York, New York, USA: Harper Collins; 1996. [Google Scholar]
- Thomas JM, Higgs S, Dourish CT, Hansen PC, Harmer CJ, McCabe C. Satiation attenuates BOLD activity in brain regions involved in reward and increases activity in dorsolateral prefrontal cortex: an fMRI study in healthy volunteers. Am J Clin Nutr. 2015;101(4):697–704. doi: 10.3945/ajcn.114.097543. [DOI] [PubMed] [Google Scholar]
- Tomasi D, Wang GJ, Wang R, Caparelli EC, Logan J, Volkow ND. Overlapping patterns of brain activation to food and cocaine cues in cocaine abusers: association to striatal D2/D3 receptors. Hum Brain Mapp. 2015;36(1):120–136. doi: 10.1002/hbm.22617. [DOI] [PMC free article] [PubMed] [Google Scholar]
- Versace F, Engelmann JM, Robinson JD, Jackson EF, Green CE, Lam CY, Minnix JA, Karam-Hage MA, Brown VL, Wetter DW, Cinciripini PM. Prequit fMRI responses to pleasant cues and cigarette-related cues predict smoking cessation outcome. Nicotine Tob Res. 2014;16(6):697–708. doi: 10.1093/ntr/ntt214. [DOI] [PMC free article] [PubMed] [Google Scholar]
- Volkow ND, Wang GJ, Fowler JS, Tomasi D, Telang F, Baler R. Addiction: decreased reward sensitivity and increased expectation sensitivity conspire to overwhelm the brain's control circuit. Bioessays. 2010;32(9):748–755. doi: 10.1002/bies.201000042. [DOI] [PMC free article] [PubMed] [Google Scholar]
- Wee LH, Shahab L, Bulgiba A, West R. Stop smoking clinics in Malaysia: characteristics of attendees and predictors of success. Addict Behav. 2011;36(4):400–403. doi: 10.1016/j.addbeh.2010.11.011. [DOI] [PubMed] [Google Scholar]
- Westergaard CG, Porsbjerg C, Backer V. The effect of Varenicline on smoking cessation in a group of young asthma patients. Respir Med. 2015;109(11):1416–1422. doi: 10.1016/j.rmed.2015.07.017. [DOI] [PubMed] [Google Scholar]
- Wilcox CE, Bogenschutz MB. Psychopharmacologies for Alcohol and Drug USe Disorders. In: McCrady BS, Epstein EE, editors. Addictions: A Comprehensive Guidebook. 2. New York, NY: Oxford University Press; 2013. pp. 526–550. [Google Scholar]
- Wilcox CE, Teshiba TM, Merideth F, Ling J, Mayer AR. Enhanced cue reactivity and frontostriatal functional connectivity in cocaine use disorders. Drug Alcohol Depend. 2011;115(1–2):137–144. doi: 10.1016/j.drugalcdep.2011.01.009. [DOI] [PMC free article] [PubMed] [Google Scholar]
Associated Data
This section collects any data citations, data availability statements, or supplementary materials included in this article.