

Abstract
While the circulation of avian influenza viruses (IAV) in wild birds in the northern hemisphere has been well documented, data from South America remain sparse. To address this gap in knowledge, we undertook IAV surveillance in wild birds in parts of Central and Northern Chile between 2012 and 2015. A wide diversity of hemagglutinin (HA) and neuraminidase (NA) subtypes were identified and 16 viruses were isolated including low pathogenic H5 and H7 strains, making this the largest and most diverse collection of Chilean avian IAVs to date. Unlike IAVs isolated from wild birds in other South American countries where the genes were most like viruses isolated from wild birds in either North America or South America, the Chilean viruses were reassortants containing genes like viruses isolated from both continents. In summary, our studies demonstrate that genetically diverse avian IAVs are circulating in wild birds in Chile highlighting the need for further investigation in this understudied area of the world.
Introduction
While much is known about avian influenza A virus (IAV) prevalence in Eurasian and North American wild birds1–3, widespread surveillance is lacking in much of the Southern Hemisphere 4.
With over 4000 km of coast and hundreds of wetlands for wintering and breeding5, the Chilean mainland is home to many migrant species including those on the Pacific and Atlantic flyways2, 4. Yet little is known about IAV in Chilean bird populations. Previous reports are limited to the isolation of three low pathogenic avian influenza (LPAI) subtypes most closely related to viruses isolated from North American shorebirds, an H4N8 virus in domestic turkey, and a highly pathogenic avian influenza (HPAI) H7N3 virus in commercial poultry in 20025–7. Most recently, a LPAI H7N6 virus was detected in a commercial turkey farm in central Chile that also had origins in wild birds (H.-W., in preparation). Thus, the goal of this study was to begin defining the prevalence and diversity of AIVs in Chilean wild birds.
Materials and methods
Sample sites and sample collection
From June 2012 to September 2015, 4036 fresh wild bird feces were collected from 23 sampling sites consisting of wetlands, shorelines, estuaries, and lagoons in Central and Northern Chile (Fig. 1) as described8. Given the lack of data regarding IAV in Chilean wild birds, we conducted exploratory seasonal sampling in June to July 2012 (n = 216), March 2013 (n = 379), November 2013 (n = 899), and April 2014 (n = 1138) before undertaking a more targeted, risk-based approach to identify the optimal sites and sample numbers to ensure statistical power.
Fig. 1. Location of surveillance sites in Chile.
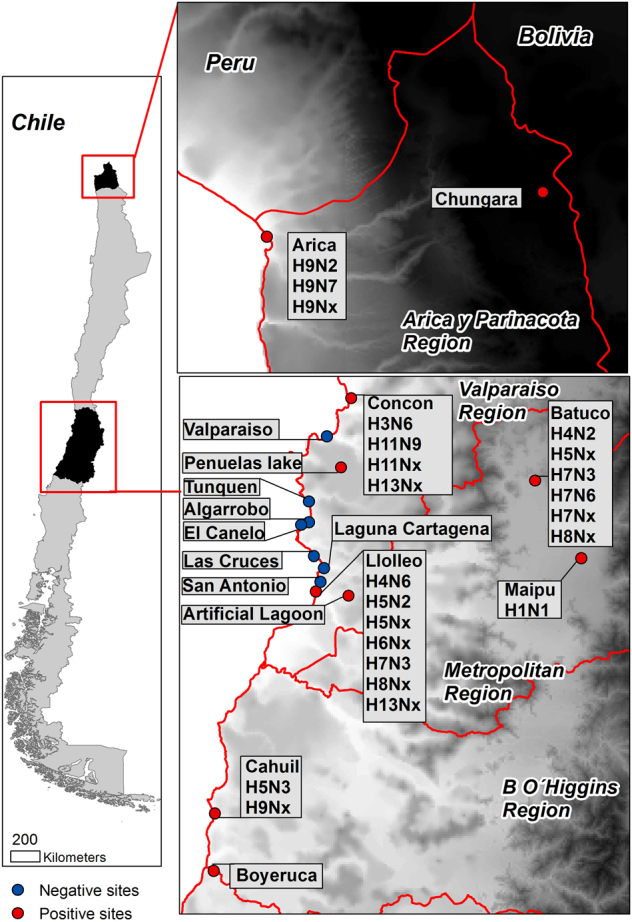
Positive sites are in red while negative sites are in blue. Subtypes obtained at each site are indicated in callout boxes
Surveillance site selection
All sites recognized as wild bird concentration areas in Chile were characterized by species diversity, number of inter hemispheric migratory species, number of resident species, and species already recognized as reservoirs of IAV. For each variable four categories were created (by the median and Q1 and Q3). Then each variable was weighted by researcher’s knowledge (10%, 10%, 10%, and 70%, respectively). With this information, a risk score was calculated for each site to focus the surveillance in high-risk areas for IAV.
Calculating statistical power
The wild bird concentration at the sites was considered our sampling unit. Our target population was the feces at each site, and we assumed that from each site we would have at least 1000 fresh feces. Based on the following formula9 to allow the identification of at least one positive sample, assuming a prevalence of 1.3%, and a confidence level of 95%, 205 samples must be collected.
where
n = required sampling size
∝ = 1-confidence level
D = estimated minimum number of positive samples (population size * expected prevalence)
N = population size
Sample screening and virus isolation
Viral RNA was extracted from 50 μl of the swab sample on a Kingfisher Flex Magnetic Particle Processor (Thermo Fisher Scientific, USA) using the Ambion MagMAX-96 AI/ND Viral RNA Isolation kit (Life Technologies Corporation, Grand Island, NY, USA)10. RNA was screened using a Bio-Rad CFX96 Real-Time PCR Detection System on a C1000 Thermocycler (Bio-Rad, Hercules, CA, USA), with TaqMan Fast Virus 1-Step Master Mix (Applied Biosystems, Foster City, CA, USA) and primers/probe specific for the influenza M gene11. Samples with a fluorescence cycle threshold (Ct) value ≤38 were considered positive. Virus isolation was attempted in embryonated chicken eggs on all samples with a Ct ≤35 as previously described12. Host species were identified using primers designed to amplify a segment of the mitochondrial cytochrome-oxidase I as described 13.
Virus sequencing
Full-length genomes were obtained using universal oligonucleotide primer sets14 and Sanger sequencing as previously described8. Sequences can be accessed under GenBank numbers KX101128 to KX101209 and KX185892 to KX185931.
Phylogenetic analysis
Influenza gene sequences were obtained from the NCBI Influenza Virus Database (https://www.ncbi.nlm.nih.gov/genomes/FLU/Database) as accessed in November 2017. Only full-length genes from the Americas, Europe, and Asian avian strains were included while duplicates were excluded. Sequence assembly, visual inspection, and trimming to remove nucleotides outside the coding region was performed using BioEdit version 7.2.5 (ref. 15) and alignment performed with MUSCLE version 3.8.3 (ref. 16). The best-fit nucleotide substitution models were selected individually for each gene by ModelTest in in Mega 7 (ref. 17). Phylogenic relationships for each gene were inferred by Maximum Likelihood (ML), incorporating a general time-reversible model of nucleotide substitution with a gamma-distributed rate variation among sites and a proportion of invariant sites (GTR + G + I). One thousand bootstrap replicates were performed to infer the robustness of the ML trees using RaxML version 8.0 (ref. 18). ML inference was repeated at least three times per dataset to assure tree topology was maintained. Final trees were constructed using TreeGraph2 and FigTree v1.4.3 (ref. 19). For the analysis of internal genes, we obtained all publicly available genes of wild bird origin obtained between 1976 and 2017 from Eurasia and the Americas. We then randomly selected 10 strains/year/location per gene for the analysis. This process was repeated at least twice and final tees were run at least three times to assure consistency in consultation with Dr. Justin Bahl. The final number of selected taxa per tree is specified in Supplemental Figures S1 to S22 that include expanded trees showing all sequences included for analysis.
Statistical analysis
All statistics were calculated using Excel 2013 (Microsoft Corporation, Redmond, WA, USA). Graphs were produced using GraphPad Prism software (La Jolla, CA, USA).
Results
AIV prevalence and host species
Of the 4036 fecal samples collected, 115 were positive for influenza virus M gene by rRT-PCR. Prevalence differed by season (Table S1) and site (Table S2). Comparisons between seasons (winter/spring) v/s (summer/fall) found that summer/fall had a higher positivity than winter/spring (Wilcoxon test, p = 0.007). Not surprisingly, the three most intensely sampled sites accounted for over half the total sampling effort (n = 2508) and yielded 73% of the overall positives samples. Twelve bird species, primarily from the Anseriformes order including Yellow-billed pintails (Anas georgica) and Yellow-billed teals (Anas flavrostris), were identified as the primary host (Table S3). They also supported the largest strain diversity. Other host species included Chiloé wigeon (Anas sibilatrix), mallards (Anas platyrhynchos), Red-fronted coot (Fulica rufifrons), oystercatchers (Haematopus), gulls (Larus), Black necked stilt (Himantopus mexicanus), Gray plover (Pluvialis squatarola), and Whimbrel (Numenius phaeopus) (Table S2).
Viral diversity and unique reassortants
Full genomic sequences were obtained from the 16 isolates and partial sequences were obtained from 20 positive swab samples. Diverse HA (H1, H3, H4, H5, H6, H7, H8, H9, H11, and H13) and NA (N1, N2, N3, N6, and N9) subtypes were identified for a total of 11 HA/NA combination (Fig. 1 and Table S2). While similar IAV subtype diversity was described in samples collected between 2006 and 2011 in Perú20, the Chilean viruses contain unique combinations of genes like viruses isolated from both North and South America (Table S4). The most diverse viruses identified were the A/American oystercatcher/Chile/C1307/2015 and A/Grey Plover/Chile/C1313/2015 H9 viruses isolated from Northern Chile (Fig. 1 and Table S4), which are 4 + 4 and 6 + 2 North to South American lineage viruses, respectively. The phylogenetic trees for each virus and gene can be found in Supplementary Figures S1 to S21. These data highlight that influenza viruses in Chilean wild birds harbor widespread HA and NA diversity with unique combinations of genes found in both North and South America, unlike viruses from elsewhere in the American continents.
Discussion
This heavy intermix of gene segments from different origins found in Chilean IAVs breaks with the paradigm of an isolated gene pool found in South America20–22. IAVs isolated from wild birds in Argentina were composed of genes unique to viruses isolated in South America21, 23, while Colombian wild bird viruses were most similar to those isolated in North America8, 10. In contrast, wild birds in Brazil had viruses from both lineages but not reassortants24. These data suggest that Chile may be a possible point of confluence where North and South American IAVs intermix, contrary to what has been reported in neighboring countries, like Argentina, Brazil, Peru, and Colombia8, 10, 20, 24–27. Geographically and evolutionarily, it is intriguing to speculate that genetic diversity in Chilean wild birds could possibly be predicted by latitude. Wild birds in Northern Chile may have more frequent exposure to North American lineage viruses versus those in Central or Southern Chile; i.e. the further South you are in Chile, the less influx of North American gene segments and a greater presence of South American lineage genes. However, further surveillance in Chile as well as the rest of South America is necessary to fully test this hypothesis. Further, the identification of H5 and H7 subtypes is concerning given the risk to domestic poultry. Active and serological surveillance is underway to determine if domestic poultry in backyard production systems in areas surrounding our wild bird surveillance sites have been exposed to the identified IAVs.
In summary, we describe the presence of a wide array of IAV subtypes in Chilean wild birds with unique genetic diversity. Increased surveillance is needed to better understand the role of Chile in this genetic diversity between North and South America, the ecology and epidemiology of IAV in Chile, and to understand the risk of these viruses to domestic animal populations.
Electronic supplementary material
Acknowledgements
The authors would like to thank Dr. Jeremy Jones (St. Jude Children’s Research Hospital, Memphis, TN, USA) for assistance. Catherina Gonzales, Martín Zordán, and Travis Schaller as well as all students at the Epidemiology Unit of the School of Veterinary Medicine at the University of Chile, Santiago, Chile, for assistance during sample collection Dr. Justin Bahl for phylogenic assistance (University of Texas-Houston, TX, USA). Finally, we would also like to thank Posada del Parque and the Amereida foundation to allow us passage to the Mantagua wetland. This research was supported NIH NIAID contract HHSN272201400006C to S.S.C.
Conflict of interest
The authors declare that they have no conflict of interest.
Ethics statement
All sampling activities and animal experiments were approved by the St Jude Children’s Research Hospital Institutional Animal Care and Use Committee (IACUC). Local permission was obtained from Aguas Andinas S.A and the Corporacion Nacional Forestal (CONAF) prior to sampling.
Electronic supplementary material
Supplementary Information accompanies this paper at (10.1038/s41426-018-0046-9).
References
- 1.Hesterberg U, et al. Avian influenza surveillance in wild birds in the European Union in 2006. Influenza Other Respir. Virus. 2009;3:1–14. doi: 10.1111/j.1750-2659.2008.00058.x. [DOI] [PMC free article] [PubMed] [Google Scholar]
- 2.Olsen B, et al. Global patterns of influenza a virus in wild birds. Science. 2006;312:384–388. doi: 10.1126/science.1122438. [DOI] [PubMed] [Google Scholar]
- 3.Munster VJ, et al. Spatial, temporal, and species variation in prevalence of influenza A viruses in wild migratory birds. PLoS Pathog. 2007;3:e61. doi: 10.1371/journal.ppat.0030061. [DOI] [PMC free article] [PubMed] [Google Scholar]
- 4.Hurt AC, et al. Detection of evolutionarily distinct avian influenza a viruses in Antarctica. mBio. 2014;5:e01098-01014. doi: 10.1128/mBio.01098-14. [DOI] [PMC free article] [PubMed] [Google Scholar]
- 5.Bravo-Vasquez N, et al. Presence of influenza viruses in backyard poultry and swine in El Yali wetland, Chile. Prev. Vet. Med. 2016;134:211–215. doi: 10.1016/j.prevetmed.2016.10.004. [DOI] [PubMed] [Google Scholar]
- 6.Mathieu C, et al. Avian influenza in wild birds from Chile, 2007-2009. Virus Res. 2015;199:42–45. doi: 10.1016/j.virusres.2015.01.008. [DOI] [PubMed] [Google Scholar]
- 7.Spackman E, McCracken KG, Winker K, Swayne DE. H7N3 avian influenza virus found in a South American wild duck is related to the Chilean 2002 poultry outbreak, contains genes from equine and North American wild bird lineages, and is adapted to domestic turkeys. J. Virol. 2006;80:7760–7764. doi: 10.1128/JVI.00445-06. [DOI] [PMC free article] [PubMed] [Google Scholar]
- 8.Jimenez-Bluhm P, et al. Avian H11 influenza virus isolated from domestic poultry in a Colombian live animal market. Emerg. Microbes Infect. 2016;5:e121. doi: 10.1038/emi.2016.121. [DOI] [PMC free article] [PubMed] [Google Scholar]
- 9.Dahoo I, Martin W, Stryhn H. Veterinary Epidemiologic Research. 2nd edn. Canada: VER Inc., Prince Edward Island; 2009. [Google Scholar]
- 10.Karlsson EA, et al. Prevalence and characterization of influenza viruses in diverse species in Los Llanos, Colombia. Emerg. Microbes Infect. 2013;2:e20. doi: 10.1038/emi.2013.20. [DOI] [PMC free article] [PubMed] [Google Scholar]
- 11.World Health Organization. CDC Protocol of Realtime RTPCR for Influenza A (H1N1). October 6, 2009 edn. Geneva, Switzerland (2009).
- 12.Moresco KA, Stallknecht DE, Swayne DE. Evaluation and attempted optimization of avian embryos and cell culture methods for efficient isolation and propagation of low pathogenicity avian influenza viruses. Avian. Dis. 2010;54:622–626. doi: 10.1637/8837-040309-Reg.1. [DOI] [PubMed] [Google Scholar]
- 13.Cheung PP, et al. Identifying the species-origin of faecal droppings used for avian influenza virus surveillance in wild-birds. J. Clin. Virol. 2009;46:90–93. doi: 10.1016/j.jcv.2009.06.016. [DOI] [PMC free article] [PubMed] [Google Scholar]
- 14.Hoffmann E, Stech J, Guan Y, Webster RG, Perez DR. Universal primer set for the full-length amplification of all influenza A viruses. Arch. Virol. 2001;146:2275–2289. doi: 10.1007/s007050170002. [DOI] [PubMed] [Google Scholar]
- 15.Hall TA. BioEdit: a user-friendly biological sequence alignment editor and analysis program for Windows 95/98/NT. Nucleic Acids Symp. Ser. 1999;41:95–98. [Google Scholar]
- 16.Edgar RC. MUSCLE: multiple sequence alignment with high accuracy and high throughput. Nucleic Acids Res. 2004;32:1792–1797. doi: 10.1093/nar/gkh340. [DOI] [PMC free article] [PubMed] [Google Scholar]
- 17.Kumar S, Stecher G, Tamura K. MEGA7: Molecular Evolutionary Genetics Analysis Version 7.0 for bigger datasets. Mol. Biol. Evol. 2016;33:1870–1874. doi: 10.1093/molbev/msw054. [DOI] [PMC free article] [PubMed] [Google Scholar]
- 18.Stamatakis A. RAxML version 8: a tool for phylogenetic analysis and post-analysis of large phylogenies. Bioinformatics. 2014;30:1312–1313. doi: 10.1093/bioinformatics/btu033. [DOI] [PMC free article] [PubMed] [Google Scholar]
- 19.Stover BC, Muller KF. TreeGraph 2: combining and visualizing evidence from different phylogenetic analyses. BMC Bioinformatics. 2010;11:7. doi: 10.1186/1471-2105-11-7. [DOI] [PMC free article] [PubMed] [Google Scholar]
- 20.Pereda AJ, et al. Avian influenza virus isolated in wild waterfowl in Argentina: evidence of a potentially unique phylogenetic lineage in South America. Virology. 2008;378:363–370. doi: 10.1016/j.virol.2008.06.010. [DOI] [PMC free article] [PubMed] [Google Scholar]
- 21.Xu K, et al. Isolation and characterization of an H9N2 influenza virus isolated in Argentina. Virus Res. 2012;168:41–47. doi: 10.1016/j.virusres.2012.06.010. [DOI] [PMC free article] [PubMed] [Google Scholar]
- 22.Araujo J, Petry MV, Fabrizio T, et al. The genetic diversity of influenza A viruses in wild birds in Peru. PLoS ONE. 2017;00:1–12. doi: 10.1371/journal.pone.0146059. [DOI] [PMC free article] [PubMed] [Google Scholar]
- 23.Nelson MI, et al. The genetic diversity of influenza A viruses in wild birds in Peru. PLoS ONE. 2016;11:e0146059. doi: 10.1371/journal.pone.0146059. [DOI] [PMC free article] [PubMed] [Google Scholar]
- 24.Rimondi A, et al. Phylogenetic analysis of H6 influenza viruses isolated from rosy-billed pochards (Netta peposaca) in Argentina reveals the presence of different HA gene clusters. J. Virol. 2011;85:13354–13362. doi: 10.1128/JVI.05946-11. [DOI] [PMC free article] [PubMed] [Google Scholar]
- 25.Alvarez P, et al. First isolation of an H1N1 avian influenza virus from wild terrestrial non-migratory birds in Argentina. Virology. 2010;396:76–84. doi: 10.1016/j.virol.2009.10.009. [DOI] [PubMed] [Google Scholar]
- 26.Gonzalez-Reiche AS, Perez DR. Where do avian influenza viruses meet in the Americas? Avian Dis. 2012;56:1025–1033. doi: 10.1637/10203-041412-Reg.1. [DOI] [PubMed] [Google Scholar]
- 27.Hurtado R, et al. Molecular characterization of subtype H11N9 avian influenza virus isolated from shorebirds in Brazil. PLoS ONE. 2015;10:e0145627. doi: 10.1371/journal.pone.0145627. [DOI] [PMC free article] [PubMed] [Google Scholar]
Associated Data
This section collects any data citations, data availability statements, or supplementary materials included in this article.