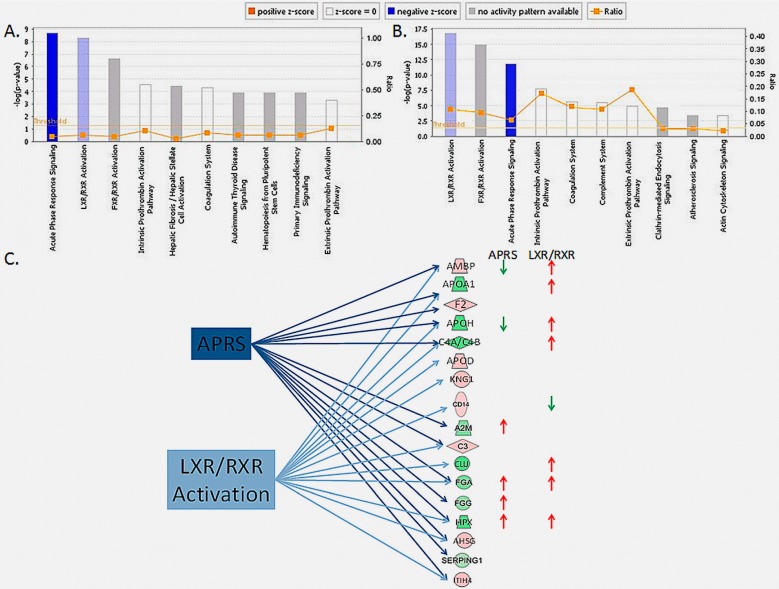
Figure 5.
The direction of the significantly affected canonical pathways in PCa according to in silico analysis with IPA. Negative regulations of the acute phase response signaling and LXR/RXR activation pathway were observed in PCa in comparison with BPH (A) and BC (B); This observation is based on the differential abundance of the proteins involved in these pathways some of which showed an opposite expression level than in the canonical pathways (C). The shape of the protein symbol indicates the type of the protein as in the Figure 4 legend. The color of the shapes indicates the degree of over-expression (red) or under-expression (green) of the corresponding protein in PCa. The color of the arrows indicates over-expression (red) or under-expression (green) of the corresponding protein in the canonical pathways.

