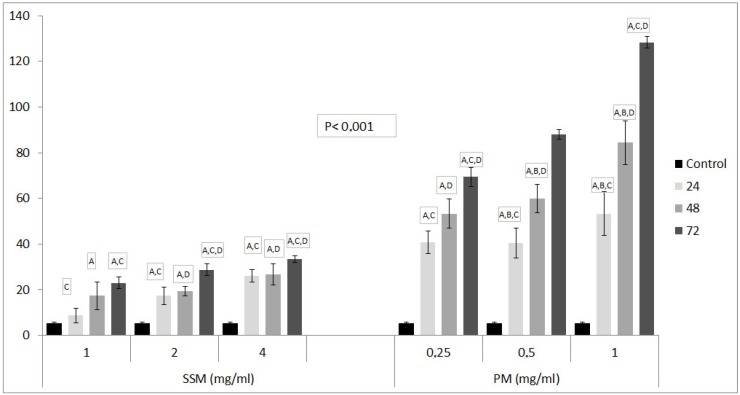
Figure 6.
The comet assay results of SSM and PM on L-929 cell lines. Values are shown as Mean ± SD, which, are three separate experiments, performed in triplicate. Data are representative of tree independent trials and are expressed as the mean ± SD. Significant differences between DNA damage at 24, 48 and 72 h were indicated by p < 0.05 as: A: Significant differences between DNA damage of control and related Nano-micelles at indicated incubation periods, B: Significant differences between DNA damage of 24 h incubated cells and 48 h incubated cells, C: Significant differences between DNA damage of 24 h incubated cells and 72 h incubated cells, D: Significant differences between DNA damage of 48 h incubated cells and 72 h incubated cells with related Nano-micelles.

