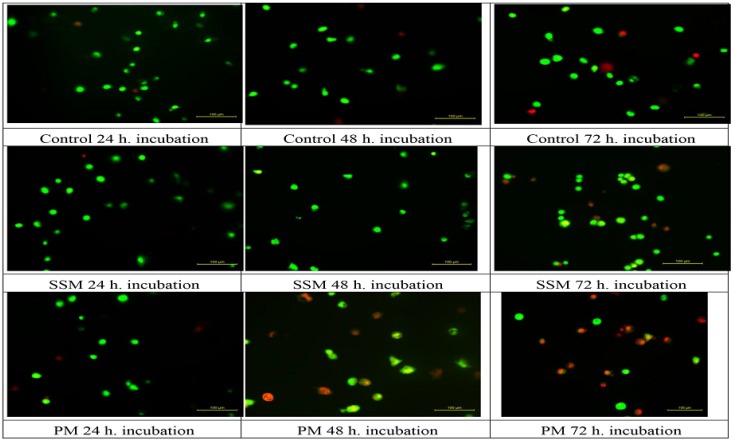
Figure 7.
Different morphological patterns of cell death induced by 4 mg/mL of SSM and 1 mg/mL of PM on L-929 cells compared to non-treated ones after 24, 48 and 72 h incubation. Green live cells show normal morphology; green early apoptotic cells show nuclear margination and chromatin condensation. Late orange apoptotic cells showed fragmented chromatin and apoptotic bodies. Necrotic cells stain uniformly red.

