Abstract
Transgenic plants overexpressing the vacuolar H+-pyrophosphatase are much more resistant to high concentrations of NaCl and to water deprivation than the isogenic wild-type strains. These transgenic plants accumulate more Na+ and K+ in their leaf tissue than the wild type. Moreover, direct measurements on isolated vacuolar membrane vesicles derived from the AVP1 transgenic plants and from wild type demonstrate that the vesicles from the transgenic plants have enhanced cation uptake. The phenotypes of the AVP1 transgenic plants suggest that increasing the vacuolar proton gradient results in increased solute accumulation and water retention. Presumably, sequestration of cations in the vacuole reduces their toxic effects. Genetically engineered drought- and salt-tolerant plants could provide an avenue to the reclamation of farmlands lost to agriculture because of salinity and a lack of rainfall.
Salt- and drought-tolerant plants maintain their turgor at low water potentials by increasing the number of solute molecules in the cell (1–3). The active transport of solutes depends on the proton gradients established by proton pumps. In plants, three distinct proton pumps generate proton electrochemical gradients across cell membranes. The P-type ATPase pumps cytoplasmic H+ across the plasma membrane into the extracellular space. The vacuolar H+-ATPase and the vacuolar H+-pyrophosphatase acidify the vacuolar lumen and possibly other intracellular compartments (4).
Plant vacuoles constitute 40–90% of the total intracellular volume of a mature plant cell (5) and, in concert with the cytosol, generate the cell turgor responsible for growth and plant rigidity. Cell turgor depends on the activity of vacuolar H+ pumps that maintain the H+ electrochemical gradient across the vacuolar membrane, which permits the secondary active transport of inorganic ions, organic acids, sugars, and other compounds. The accumulation of these solutes is required to maintain the internal water balance (6).
In principle, increased vacuolar solute accumulation could confer salt and drought tolerance. The sequestration of ions such as sodium could increase the osmotic pressure of the plant and at the same time reduce the toxic effects of this cation. Exposure to NaCl has been shown to induce the H+ transport activity of vacuolar pumps in both salt-tolerant (7, 8) and salt-sensitive plants (9). In principle, enhanced expression of either of the vacuolar proton pumps should increase the sequestration of ions in the vacuole by increasing the availability of protons. However, overexpression of the plant vacuolar H+-ATPase would be difficult because it consists of many subunits, each of which would have to be overexpressed at the correct level in a single transgenic plant to achieve higher activity of the multisubunit complex (10). By contrast, the vacuolar H+-pyrophosphatase of Arabidopsis is encoded by a single gene, AVP1 (11). AVP1 can generate a H+ gradient across the vacuolar membrane (tonoplast) similar in magnitude to that of the multisubunit vacuolar H+-ATPase (5). Heterologous expression of this plant vacuolar H+-pyrophosphatase in yeast restored salt tolerance to a salt-sensitive yeast mutant (12). Here we show that transgenic plants expressing higher levels of the vacuolar proton-pumping pyrophosphatase, AVP1, are more resistant to salt and drought than are wild-type plants. These resistance phenotypes are associated with increased internal stores of solutes.
Materials and Methods
Generation of Transgenic Arabidopsis Plants.
The AVP1 ORF was cloned into the XbaI site of a modified pRT103 plasmid.‖ This vector contains a tandem repeat of the 35S promoter. A HindIII fragment containing the 35S tandem promoter, the AVP1 ORF, and the polyadenylation signal was subcloned into the HindIII site of the pPZP212 vector (13). Agrobacterium-mediated transformation was performed via vacuum infiltration of flowering Arabidopsis thaliana (ecotype Columbia) (14). Transgenic plants were selected by plating seeds of the transformed plants on plant nutrient agar plates supplemented with 25 mg/liter kanamycin. Plants were subsequently selected for two generations to identify transgenic plants homozygous for the transgene. From 30 independent transformants we identified eight lines with enhanced salt tolerance. Two of these lines are described here. The salt and drought tolerance of these two lines, AVP1-1 and AVP1-2, are completely linked to kanamycin resistance, and all three phenotypes cosegregate as a single locus in the F2 of crosses with wild-type plants. Quantitation of the intensity of the AVP1 band (Bio-Rad Quantity One software) in Southern blots from wild type and these two strains suggests that transgenic plants have at least two copies of 35S-AVP1 chimera.
Protein Isolation and Western Analysis.
Homogenates of plant shoots were prepared in a homogenization buffer {50 mM Hepes- 1,3-bis[tris(hydroxymethyl)methylamino]propane, pH 7.4/250 mM d-sorbitol/6 mM EGTA/1 mM DTT/0.2% (wt/wt) BSA/1 mM PMSF/1 μg/ml leupeptide/5 μg/ml pepstatin} as described in ref. 15. These homogenates were centrifuged sequentially for 15 and 30 min at 10,000 and 18,000 rpm, respectively. The 18,000-rpm membrane pellet was resuspended in a resuspension buffer {25 mM Hepes-1,3-bis[tris(hydroxymethyl)methylamino]propane, pH 7.4/250 mM d-sorbitol; 1 mM DTT/1 mM PMSF/1 μg/ml leupeptide/5 μg/ml pepstatin} as described in ref. 15. Protein (10 μg) separated by 10% SDS/PAGE was immunoblotted with antibodies raised against a keyhole limpet hemocyanin-conjugated peptide corresponding to the putative hydrophilic loop IV of the AVP1 protein (11). The AVP1 protein was detected by chemiluminescence by using the ECL system from Amersham Pharmacia. Protein content was determined by Bio-Rad assay. Quantification of the intensity of AVP1 in the Western blots was performed by using Bio-Rad Quantity One quantitation software.
Immunolocalization.
Rosette leaves were fixed with 4% formaldehyde and embedded with paraplast (Sigma). Seven-micrometer-thick sections were cut with a microtome (Leica, Northvale, NJ). Immunolocalization was performed as reported (26). Antibodies raised against a keyhole limpet hemocyanin-conjugated peptide corresponding to the putative hydrophilic loop IV of the AVP1 protein (11) were used in a 1:250 dilution. An alkaline phosphatase-conjugated goat anti-rabbit IgG (Promega) was used at a 1:1000 dilution. To detect the alkaline phosphatase activity, a solution with NBT (nitro blue tetrazolium chloride) and BCIP (5-bromo-4-chloro-3-indolyl phosphate, toluidine salt; Roche Molecular Biochemicals) was used as a substrate.
NaCl Stress Treatment and Na+ and K+ Content Determination.
Plants were grown on soil in a 16-h light/8-h dark cycle at 21°C and flooded for 4 h every 4 days with a nutrient solution (1/8 MS Murashige & Skoog salt mixture, GIBCO/BRL) for 4 weeks. Beginning at week 5 postgermination, the nutrient solution was supplemented with NaCl, incrementally increasing with each successive watering from 50 through 100, 150, and 200 to a final concentration of 250 mM NaCl. Leaves from the rosette were excised carefully to determine their Na+ and K+ content. After 48 h at 75°C, the dry weight was measured. The Na+ and the K+ contents were extracted with 1 N HCl solution at 60°C for 1 h. The supernatants were analyzed by atomic absorption.
45Ca2+ Uptake Assays in Vacuolar Membrane Vesicles.
Root tissue vacuolar membrane vesicles prepared as described (15) were added to a buffer {250 mM sorbitol/25 mM 1,3-bis[tris(hydroxymethyl)methylamino]propane-Hepes, pH 8.0/50 mM KCl/1.5 mM MgSO4/10 μM 45Ca2+} and incubated at 20°C for 10 min before adding 200 μM inorganic pyrophosphate to initiate uptake. Then 200-μl aliquots were filtered and washed with cold buffer as described (16); 5 μg/ml A23187 was added to dissipate the Ca2+ gradient.
Quantification of Solute Potential.
Leaves from fully watered plants were excised and floated on deionized water overnight at 4°C. The leaves were then frozen, thawed, and mechanically disrupted. The resulting sap was analyzed in a vapor pressure osmometer (5500 WESCOR). The readings (mmol/kg) were used to calculate the solute potential (Ψs) expressed in MPa (mega Pascales) with the formula Ψs = − moles of solute (RK), where R = .008314 and K = 295° (17).
Relative Water Content and Soil Gravimetric Water Content Measurements.
Leaves from the rosette were excised, and their fresh weight was scored immediately. After floating them in deionized water at 4°C overnight, their rehydrated weight was determined. Finally, they were dried in an oven at 70°C overnight and weighed. The relative water content was calculated as indicated: RWC = (fresh weight − dry weight)/(rehydrated weight − dry weight). The soil water content of the pots with the plants was measured at the beginning and end of the experiment. Then the pots were dried in an oven at 70°C overnight and weighed. The soil gravimetric water content was calculated by dividing soil water content by soil dry weight.
Stomatal Aperture Assays.
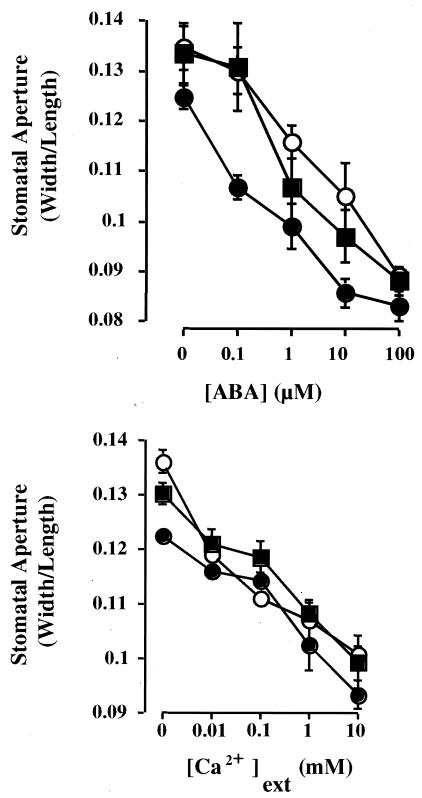
Stomatal aperture changes were measured as described previously (18). To open the stomata, intact leaves were floated for 2.5 h in the light (125 μmol⋅m−2⋅s−1) on 3 ml of a buffer composed of 5 mM KCl/10 mM Mes-Tris, pH 6.15, for measuring Ca2+-induced closure and 5 mM KCl/50 μM CaCl2/10 mM Mes-Tris, pH 6.15, for measuring abscisic acid (ABA)-induced closure. After this opening period, ABA or CaCl2 was added to give the appropriate final concentrations (0, 0.1, 1, 10, and 100 μM ABA and 0, 0.01, 0.1, 1, and 10 mM CaCl2). After a further 3 h, the leaves were blended briefly (15 sec) in the same buffer used to open the stomata. Epidermal fragments were collected in a 30-μm nylon mesh and transferred rapidly to a microscope slide, and aperture ratios (pore width/length) were measured as described previously (18).
Results
AVP1 Transgenic Plants with Increased Levels of AVP1 Are Salt-Tolerant.
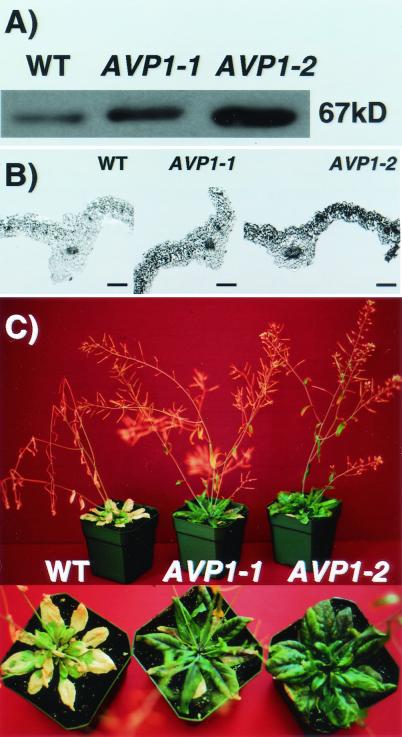
Two transgenic lines of A. thaliana were analyzed, AVP1-1 and AVP1-2. Each line contains extra copies of the 35S-AVP1 gene inserted at a single chromosomal location. Analysis of AVP1 protein levels in membrane fractions isolated from shoots shows that these transgenic plants express more AVP1 protein than does the wild type (AVP1-1, 1.6-fold and AVP1-2, 2.4-fold increase over wild type, P = 0.0005; Fig. 1A) as determined from four independent Western blots (see Materials and Methods). The differences between these transgenic plants could be caused by the number of copies of AVP1 inserted into the genome or the sites of insertion (Materials and Methods). Further evidence consistent with the overexpression of the AVP1 protein in these transgenic plants comes from immunocytochemical localization experiments. In both transgenic lines the mesophyll cells of the rosette leaves show higher levels of AVP1 expression than in wild type (Fig. 1B). The transgenic plants overexpressing AVP1 are more salt tolerant than wild-type plants (Fig. 1C). Plants from both AVP1-1 and AVP1-2 transgenic lines grow well in the presence of up to 250 mM NaCl, whereas wild-type plants grow poorly and exhibit chlorosis. After 10 days in these conditions wild-type plants die, whereas the transgenic plants continue to grow well.
Figure 1.
AVP1 overexpression increases salt tolerance. (A) Western blot of membrane fractions from wild-type and transgenic plants. Protein (10 μg) from total membrane fractions isolated from shoots of four wild-type and four plants of each of the transgenic lines (AVP1-1 and AVP1-2) was separated by 10% SDS/PAGE. Four SDS/PAGE gels were transferred and immunoblotted with antibodies raised against a keyhole limpet hemocyanin-conjugated AVP1 peptide (see Materials and Methods). AVP1 protein was detected by chemiluminescence. The photograph corresponds to one of four immunoblots. WT, wild type. (B) Immunocytochemical localization of AVP1 protein in wild-type, AVP1-1, and AVP1-2 transgenic plants. Sections of rosette leaves were probed with the AVP1 antibody. Antibody binding was detected with NBT/BCIP as substrate (see Materials and Methods). (Bars, 200 μm.) (C) Salt treatment of wild type and two AVP1-overexpressing transgenic lines. Plants were grown on soil in a 16-h light/8-h dark cycle and treated as described in Materials and Methods. The photograph shows plants at the 10th day after treatment with 250 mM NaCl (see Materials and Methods).
AVP1 Transgenic Plants Retain More Cations than Wild Type.
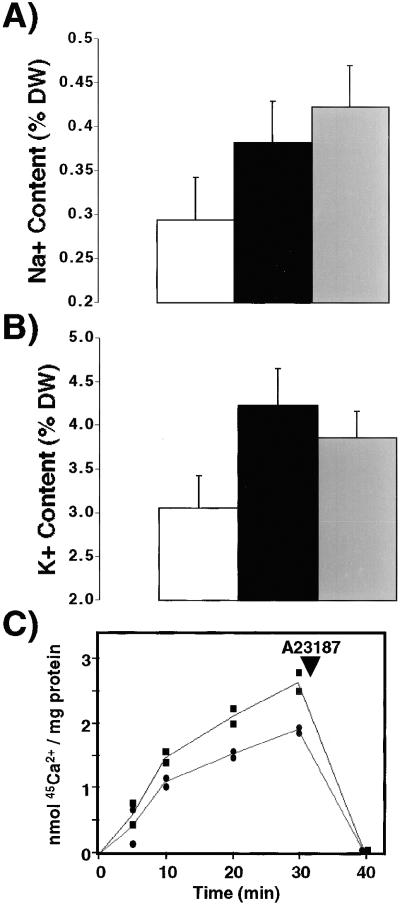
One explanation for the increased salt tolerance is that the increase in AVP1 increases the concentration and sequestration of cations into the vacuole of these transgenic plants. We analyzed the Na+ and K+ content from rosette leaves of wild-type and transgenic plants grown in the presence of 100 mM NaCl, a concentration with which wild-type plants are still healthy, and their physiological response to salt is presumably intact (19). The Na+ content was 20 and 40% higher in transgenic lines AVP1-1 and AVP1-2 than in wild-type plants, respectively (Fig. 2A). Furthermore, the K+ content was also higher than in wild type: 39 and 26% in transgenic lines AVP1-1 and AVP1-2, respectively (Fig. 2B).
Figure 2.
Na+ (A) and K+ (B) content from rosette leaves of wild-type and transgenic plants. White bars correspond to wild-type Na+ and K+ values calculated as a percentage of total dry weight (DW), and black and gray bars correspond to transgenic plants AVP1-1 and AVP1-2, respectively. Values are means ± SD (n = 10). (C) Inorganic pyrophosphate-dependent 45Ca2+ uptake in vacuolar membrane vesicles. Six wild-type (black circles) and six transgenic plants from line AVP1-2 (black squares) were grown hydroponically for 9 weeks in a 16-h light/8-h dark cycle at 21°C. Root tissue vacuolar membrane vesicles were isolated and assayed as described in Materials and Methods. Then, 200-μl aliquots were filtered at the indicated times and washed with cold buffer as described (17); 5 μg/ml A23187 was added to dissipate the Ca2+ gradient as indicated by the arrow.
The increase in cation concentration is consistent with the hypothesis that transgenic plants overexpressing AVP1 have an enhanced H+-pumping capability at their tonoplast, leading to increased vacuolar solute accumulation by H+ co- and countertransporters. We tested this hypothesis by measuring 45Ca2+ uptake into wild-type and transgenic vacuolar membrane vesicles. Ca2+ enters the plant vacuole via the Ca2+/H+ antiporters CAX1 and CAX2 (17, 20, 21). Pyrophosphate-driven 45Ca2+ uptake into vacuolar membrane vesicles from line AVP1-2 transgenic plants is 36% higher than into wild-type vesicles (Fig. 2C). Application of the Ca2+ ionophore A23187 reduced the 45Ca2+ content of the vesicles to background levels, demonstrating vesicular integrity (Fig. 2C) (16). These data suggest that the increase in AVP1 results in greater accumulation of cations in the vacuole, which could be responsible for the increase in salt tolerance.
Transgenic Plants Are Drought-Tolerant.
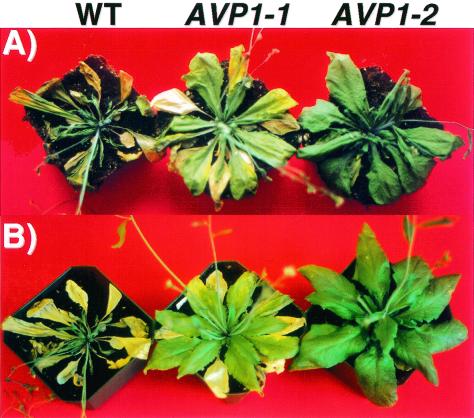
Wild-type and AVP1 transgenic plants were tested for drought tolerance by growing the plants under conditions of water deprivation. Plants were grown for 4 weeks under a fully watered regimen at 21°C (standard culture conditions) and then transferred into a chamber with a 3°C warmer temperature and no further addition of water. After 10 days of water deprivation (Fig. 3A), plants from each group were rewatered (Fig. 3B). Deprivation of water for this time was lethal to wild-type plants, but plants from both transgenic lines, AVP1-1 and AVP1-2, survived, continued normal growth, bolted, and set viable seeds.
Figure 3.
Wild-type and AVP1 transgenic plants deprived of water. Eight wild-type plants and eight of each of the two AVP1-overexpressing transgenic lines (AVP1-1 and AVP1-2) were grown on soil in a 16-h light/8-h dark cycle at 21°C. Plants were watered with a diluted nutrient solution (1/8 MS Murashige & Skoog salt mixture) every 4 days for 4 weeks. At week 5, the plants were watered and then transferred to a 24°C growth chamber with no further addition of water. The photograph corresponds to plants at day 10 of water-deficit stress (A) and the same plants 24 h after rewatering (B). WT, wild type.
AVP1 Transgenic Plants Retain More Solutes and Water than Wild Type.
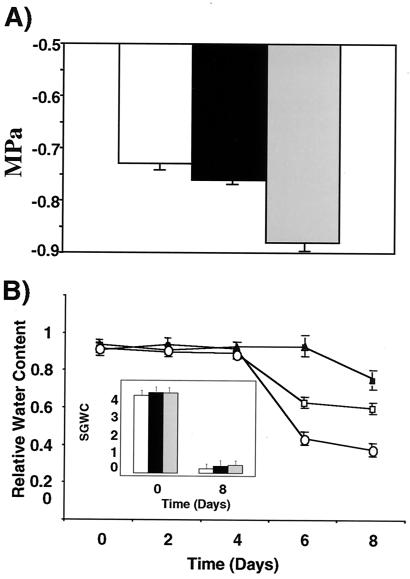
The phenotypes of the transgenic plants suggest that higher levels of AVP1 result in greater solute accumulation and water retention than wild type. The solute potential (Ψs, refers to the concentration of osmotically active particles dissolved in water, conventionally defined as osmotic pressure) from leaves of wild-type and transgenic plants overexpressing AVP1 was determined (Materials and Methods, Fig. 4A). Values of Ψs for wild-type plants were less negative (−0.73 MPa, SD = .02) than the values for transgenic lines AVP1-1 (−0.76 MPa, SD = .01) and AVP1-2 (−0.88 MPa, SD = .05) with P = 7.5E-08.
Figure 4.
Solute potential and water retention in wild-type and transgenic plants. (A) Solute potential of fully hydrated leaves from fully watered wild-type (WT) and two AVP1-overexpressing lines (AVP1-1 and AVP1-2). Values are means ± SD (n = 16). White bars depict wild-type solute potential values, and black and gray bars represent lines AVP1-1 and AVP1-2, respectively. (B) Relative water content of wild-type and AVP1 transgenic plants under a water-deficit stress. Eight wild-type plants and eight of each AVP1 transgenic line were grown and stressed as described (Fig. 3). The RWC of wild-type (open circles) and transgenic plants AVP1-1 (open squares) and AVP1-2 (solid triangles) was determined every 2 days. One fully expanded leaf per plant (four plants of each group every 2 days) was removed from the rosette for analysis. Values are means ± SD (n = 4 for each). (Inset) Soil gravimetric water content (SGWC) was determined at the beginning and end of the experiment. Initial values were of 3.88 (SD = 0.05), 4.03 (SD = 0.12), and 4 (SD = 0.1) for wild-type and the transgenic lines AVP1-1 and AVP1-2, respectively. The values at day 8 were of 0.23 (SD = .15), 0.35 (SD = .16), and 0.41 (SD = .09) for wild-type and the transgenic lines AVP1-1 and AVP1-2, respectively. Values are means ± SD (n = 8). White bars depict wild-type soil values, and black and gray bars represent lines AVP1-1 and AVP1-2, respectively.
Transgenic plants also show a significant difference from wild type after water deprivation in their RWC (a parameter to assess water status in the plant. When water uptake by roots matches water loss by transpiration at the leaves, the RWC is ≈0.9). After 6 days of water-deficit stress, the RWC of wild-type plants decreased more than 50% to a value of 0.44, whereas the RWC of plants from AVP1-1 decreased only 30% to 0.63, and that of plants from transgenic line AVP1-2 remained unchanged (Fig. 4B). At day 8 the RWC values of wild-type plants dropped further to 0.38, whereas the RWC values of plants from line AVP1-1 stabilized at 0.6. Only at day 8 did the RWC of plants from line AVP1-2 start to decrease (0.76). During this time, the decrease in the soil gravimetric water content (a parameter to assess the amount of water in the soil) did not differ among the groups (Fig. 4B Inset).
One explanation for the association of increased drought tolerance with greater expression of AVP1 is that these plants have reduced stomatal openings and thereby exhibit a reduction in water loss by transpiration. Reduced H+ pumping and therefore endomembrane energization has been reported to hinder the generation of cytoplasmic Ca2+ oscillations in guard cells and subsequent stomatal closure (18). To examine this possibility we measured ABA- and extracellular Ca2+-induced stomatal closure and found that there was no difference between the transgenic AVP1 lines and wild-type plants (Fig. 5). For this reason we conclude that differential ion retention and not stomatal closure is the basis for the AVP1 phenotypes.
Figure 5.
ABA- and extracellular Ca2+-induced stomatal closure. Assays were performed as described in Materials and Methods. Each point is the mean of 60 stomata measured in three separate replicates. Error bars represent ± SEM relative to n = 3 replicates comprising 20 stomata/replicate. Filled squares correspond to wild type, and open and closed circles correspond to lines AVP1-1 and AVP1-2, respectively.
Discussion
Overexpression of the vacuolar H+-pyrophosphatase AVP1 in transgenic Arabidopsis plants results in drought and salt tolerance. We ascribe these properties to the increased accumulation of solutes. This conclusion is supported by our measurements on ion accumulation; the transgenic plants accumulate more Na+ and K+ in their leaf tissue (Fig. 2A). The increased accumulation of sodium is likely to be a consequence of the activity of the vacuolar Na+/H+ (sodium/proton) antiporter, AtNHX1 or its homologues (12, 22), in the presence of increased proton supply. This compartmentation may prevent Na+ toxicity and facilitate cellular K+ uptake (Fig. 2B) (23). The elevated potassium could result also from the increased concentration of the AVP1 protein, which has itself been proposed to function as a H+/K+ symporter with a coupling ratio of 1.3 H+/1.7 K+/1 inorganic pyrophosphate (9). Direct measurements of transport by using vacuolar membrane vesicles derived from the AVP1 transgenic demonstrate that vacuoles from these plants have enhanced cation uptake capability (Fig. 2C).
The net increase in the concentration of solutes in the cell must lead to an increase in the uptake of water such that these transgenic plants can maintain turgor (1, 3). Consistent with this idea is our finding of a decreased solute potential in leaves of transgenic plants measured at a constant water content (Fig. 4A). We conclude that the increased solute accumulation as a consequence of AVP1 overexpression results in a concomitant increase in retention of water (Figs. 1 and 3). This conclusion is compatible with the finding that wheat deprived of water is rendered more tolerant to drought by an increase in cell K+ content (from 100 to 300 mM; ref. 24).
The enhanced tolerance to salinity and drought in transgenic plants with increased levels of AVP1 is explained most easily by an enhanced uptake of ions into the vacuole. Presumably, the greater AVP1 activity provides increased H+ to drive the secondary active uptake of cations into the lumen of the vacuole (Fig. 2C). If so, there must be a compensatory transport of anions to maintain electroneutrality (25). The resulting elevated vacuolar solute content would confer greater water retention, permitting plants to survive under conditions of low soil water potentials. Furthermore, at high Na+ concentrations, the increased H+ gradient could also enhance the driving force for AtNHX1-mediated Na+/H+ exchange, thereby contributing to the Na+ sequestration into the vacuole of AVP1 transgenic plants. Presumably, any toxic effects intrinsic to Na+ are mitigated by this sequestration in the vacuole. This scenario predicts that a transgenic plant engineered to overexpress both the AVP1 H+ pump and AtNHX1 Na+/H+ antiporter (12, 22) would tolerate even higher NaCl stresses than AVP1 and AtNHX1 single transgenic plants. Our results suggest that the genetic manipulation of vacuolar proton-pumping pyrophosphatases in economically important crops could provide an important avenue for crop improvement.
Acknowledgments
We thank P. A. Rea for kindly providing us with AVP1 cDNA and the antibodies against the AVP1 protein. We thank H. Sze and Z. Wu for helping with the inorganic pyrophosphate-dependent calcium uptake experiments. We thank C. Brugnara for the atomic absorption analysis. We thank G. Berkowitz, K. Hirschi, and T. C. Hsiao for helpful discussions. S.U. was supported by U.S. Department of Agriculture HATCH FRS Grant 529664 to (R.A.G.). R.A.G. was supported by the University of Connecticut Research Foundation Grant FRS 444138 and National Institutes of Health Grants DK43495 and DK34854 (to S.L.A.). This research was supported by National Science Foundation Grant MCB 987637 (to G.R.F.).
Abbreviations
- RWC
relative water content
- ABA
abscisic acid
Footnotes
Topfer, R., Matzeit, V., Gronenborn, B., Schell, J. & Steinbiss, H.-H. (1987) Nucleic Acids Res. 15, 5890 (abstr.).
References
- 1.Radin W J. In: Limitations to Efficient Water Use in Crop Production. Taylor H M, Jordan W R, Sinclair T R, editors. Madison, WI: ASA-CSSA-SSSA; 1983. pp. 267–276. [Google Scholar]
- 2.McNeil S D, Nuccio M L, Hanson A D. Plant Physiol. 1999;120:945–949. doi: 10.1104/pp.120.4.945. [DOI] [PMC free article] [PubMed] [Google Scholar]
- 3.Bray E A, Bailey-Serres J, Weretilnyk E. In: Biochemistry and Molecular Biology of Plants. Buchanan B B, Gruissem W, Jones R L, editors. Rockville, MD: American Society of Plant Physiologists; 2000. pp. 1159–1175. [Google Scholar]
- 4.Sze H, Li X, Palmgren M G. Plant Cell. 1999;11:677–689. doi: 10.1105/tpc.11.4.677. [DOI] [PMC free article] [PubMed] [Google Scholar]
- 5.Zhen R G, Kim E J, Rea P A. The Plant Vacuole. Vol. 25. San Diego: Academic; 1997. pp. 298–337. [Google Scholar]
- 6.Leigh R A. In: The Plant Vacuole. Leigh R A, Sanders D, editors. Vol. 25. San Diego: Academic; 1997. pp. 171–194. [Google Scholar]
- 7.Hasegawa P M, Bressan R A, Zhu J-K, Bohnert H. Annu Rev Plant Physiol Plant Mol Biol. 2000;51:463–499. doi: 10.1146/annurev.arplant.51.1.463. [DOI] [PubMed] [Google Scholar]
- 8.Golldack D, Dietz K J. Plant Physiol. 2001;125:1643–1654. doi: 10.1104/pp.125.4.1643. [DOI] [PMC free article] [PubMed] [Google Scholar]
- 9.Maeshima M. Biochim Biophys Acta. 2000;1465:37–51. doi: 10.1016/s0005-2736(00)00130-9. [DOI] [PubMed] [Google Scholar]
- 10.Luttge U, Ratajczak R. In: The Plant Vacuole. Leigh R A, Sanders D, editors. Vol. 25. San Diego: Academic; 1997. pp. 253–296. [Google Scholar]
- 11.Sarafian V, Kim Y, Poole R J, Rea P A. Proc Natl Acad Sci USA. 1992;89:1775–1779. doi: 10.1073/pnas.89.5.1775. [DOI] [PMC free article] [PubMed] [Google Scholar]
- 12.Gaxiola R A, Rao R, Sherman A, Grisafi P, Alper S L, Fink G R. Proc Natl Acad Sci USA. 1999;96:1480–1485. doi: 10.1073/pnas.96.4.1480. [DOI] [PMC free article] [PubMed] [Google Scholar]
- 13.Hajdukiewicz Z, Svab Z, Maliga P. Plant Mol Biol. 1994;25:989–994. doi: 10.1007/BF00014672. [DOI] [PubMed] [Google Scholar]
- 14.Clough S J, Bent A F. Plant J. 1998;16:735–743. doi: 10.1046/j.1365-313x.1998.00343.x. [DOI] [PubMed] [Google Scholar]
- 15.Randall S K, Sze H. J Biol Chem. 1986;261:1364–1371. [PubMed] [Google Scholar]
- 16.Schumaker K S, Sze H. Plant Physiol. 1985;79:1111–1117. doi: 10.1104/pp.79.4.1111. [DOI] [PMC free article] [PubMed] [Google Scholar]
- 17.Taiz L, Zeiger E. Plant Physiology. Sunderland, MA: Sinauer; 1998. p. 69. [Google Scholar]
- 18.Allen G J, Chu S P, Schumacher K, Shimazaki C T, Vafeados D, Kemper A, Hawke S, Tallman G, Tsien R Y, Harper J F, et al. Science. 2000;289:2338–2342. doi: 10.1126/science.289.5488.2338. [DOI] [PubMed] [Google Scholar]
- 19.Nublat A, Desplans J, Casse F, Berthomieu P. Plant Cell. 2001;13:125–137. doi: 10.1105/tpc.13.1.125. [DOI] [PMC free article] [PubMed] [Google Scholar]
- 20.Hirschi K D, Zhen R-G, Cunningham K W, Rea P A, Fink G R. Proc Natl Acad Sci USA. 1996;93:8782–8786. doi: 10.1073/pnas.93.16.8782. [DOI] [PMC free article] [PubMed] [Google Scholar]
- 21.Hirschi K D, Korenkov V D, Wilganowski N L, Wagner G J. Plant Physiol. 2000;124:125–133. doi: 10.1104/pp.124.1.125. [DOI] [PMC free article] [PubMed] [Google Scholar]
- 22.Apse M, Aharon G, Snedden W, Blumwald E. Science. 1999;285:1256–1258. doi: 10.1126/science.285.5431.1256. [DOI] [PubMed] [Google Scholar]
- 23.Wu S J, Ding L, Zhu J K. Plant Cell. 1996;8:617–627. doi: 10.1105/tpc.8.4.617. [DOI] [PMC free article] [PubMed] [Google Scholar]
- 24.Sen Gupta A, Berkowitz G A, Pier P A. Plant Physiol. 1989;89:1358–1365. doi: 10.1104/pp.89.4.1358. [DOI] [PMC free article] [PubMed] [Google Scholar]
- 25.Gaxiola R A, Yuan D S, Klausner R D, Fink G R. Proc Natl Acad Sci USA. 1998;95:4046–4050. doi: 10.1073/pnas.95.7.4046. [DOI] [PMC free article] [PubMed] [Google Scholar]
- 26.Maliga P, Klessig D F, Cashmore A R, Gruissem W, Varner J E. In: Methods in Plant Molecular Biology. A laboratory course Manual. Maliga P, Klessig D F, Cashmore A R, Gruissem W, Varner J E, editors. Plainview, NY: Cold Spring Harbor Lab. Press; 1995. pp. 95–110. [Google Scholar]


