Abstract
This study explores using the restricted mean time lost to quantify treatment effects from cardiovascular therapy.
The limitations in the clinical interpretability of hazard ratios (HRs) for quantifying between-group difference with a time-to-event end point have been discussed extenstively. When the end point is subject to competing risks, interpretation becomes more difficult. For example, to evaluate treatment effect from a cardiovascular (CV) therapy with respect to CV death, non-CV death represents a competing risk. That is, the occurrence of CV death can be precluded by non-CV death and informatively censored. In this analysis, we used data from the β-Blocker Evaluation of Survival Trial (BEST; NCT00000560), a randomized clinical trial of bucindolol vs placebo in patients with heart failure, to illustrate how to use a simple, robust alternative method to quantify treatment effects via the restricted mean time lost (RMTL), which has been implemented in noncompeting-risks cases. Unlike HRs, the validity of this method does not depend on model assumptions and the resulting estimates are clinically interpretable.
Methods
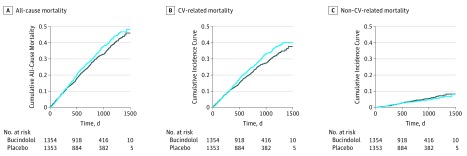
For overall survival in BEST, in which no competing risks existed, the HR (bucindolol vs placebo) was 0.90 (95% CI, 0.78-1.03; P = .11), indicating no significant benefit of bucindolol. In this case, the cumulative incidence curves (CICs), as shown in Figure 1A, are a complement of survival function for the 2 groups. In the presence of competing risks, the CIC provides the proportion of patients who died of a specific cause by each time point, such as CV death (Figure 1B) and non-CV death (Figure 1C).
Figure 1. Cumulative Incidence of All-Cause, Cardiovascular (CV)-Related, and Non–CV-Related Mortality for Bucindolol and Placebo.
Cumulative incidence curves for all-cause mortality (A), CV-related mortality (B), and non–CV-related mortality (C) are displayed. The solid line indicates the bucindolol group and the blue line indicates the placebo group.
If CV death is the end point of interest, there are 2 conventional procedures to quantify treatment effects. The first one gives the standard HR of 0.86 (95% CI, 0.75-0.99; P = .05) by assuming the non-CV death time as independent censoring. The second method defines HR by assuming the ratio of 2 pseudohazards from CICs is constant. The resulting HR is 0.86 (95% CI, 0.74-0.99; P = .042). Neither HR has a simple clinical interpretation, especially when the proportional hazards assumption is violated (which is not uncommon in long-term effect studies).
The CIC provides mortality rate information during the study duration. The lower the curve, the better the treatment effect. Thus, the area under the CIC over a clinically meaningful time window is a reasonable measure with which to quantify the temporal burden of mortality. As in noncompeting-risk cases, this summary measure is the RMTL; it represents the mean time lost due to a specific cause during this time window, which is restricted by study duration. We then used the difference (or ratio) of RMTLs to quantify the treatment effects. The corresponding CIs and P values can be obtained via inference procedures developed under the noncompeting-risks setting. All statistical analysis were performed with R, version 3.3.1 (via the R package “survRM2; R Foundation).
Results
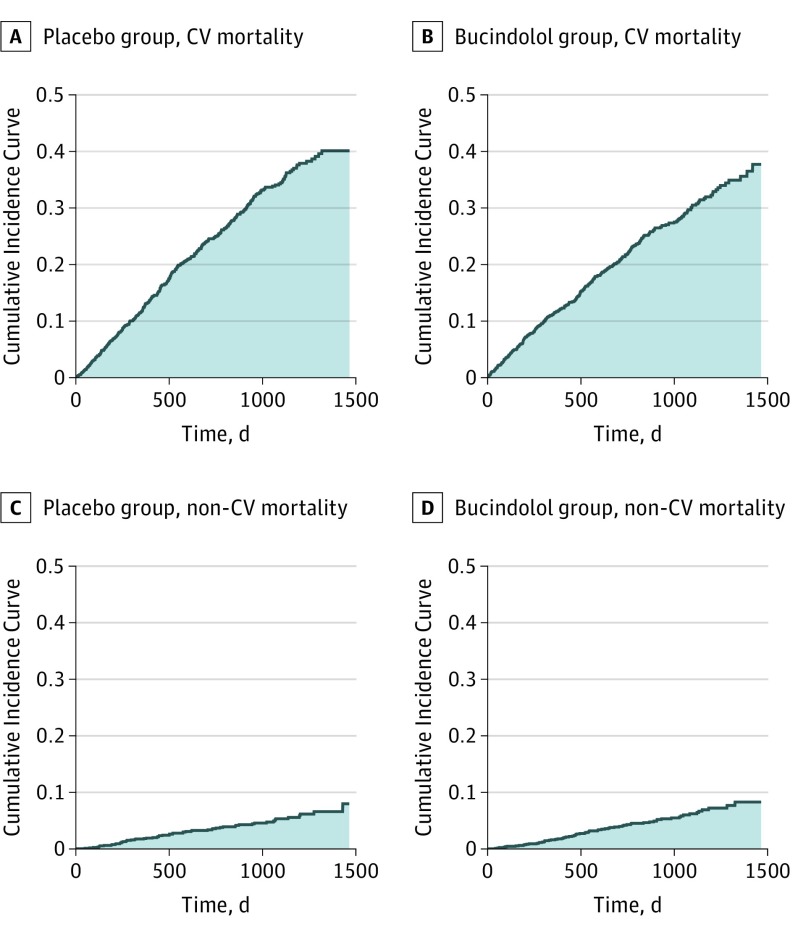
In Figures 2A and 2B, the shaded areas under the CICs for CV death up to 48 months are 342.3 and 302.9 days for placebo and bucindolol, respectively. The reduction in RMTL (SD) by bucindolol is 39.4 (19.9) days (95% CI, 0.4-78.4; P = .05). The corresponding relative reduction in RMTL (SD) is 11.5% (5.5%) (0.0-21.6%; P = .05). These, coupled with 342.3 days lost for placebo patients, provide clinically interpretable information about the effect of bucindolol on CV mortality. In Figures 2C and 2D, the shaded areas under the CICs of non-CV death are 52.0 and 59.5 days for placebo and bucindolol, respectively. The increase in RMTL (SD) by bucindolol is 7.5 (3.8) days (95% CI, −11.4 to 26.4; P = .44), suggesting no benefit from bucindolol for non-CV mortality rates.
Figure 2. Mean Time Lost Due to Cardiovascular (CV)-Related and Non–CV-Related Mortality in 48 Months for Bucindolol and Placebo.
The area under the cumulative incidence curve for CV-related mortality from baseline up to 48 months represents the restricted mean time lost (RMTL) due to CV mortality for the placebo group (shaded area, 342.3 days) (A) and for the bucindolol group (shaded area, 302.9 days) (B). The area under the cumulative incidence curve for non–CV-related mortality represents the RMTL due to non-CV mortality for the placebo group (shaded area, 52.0 days) (C) and for the bucindolol group (shaded area, 59.5 days) (D).
Discussion
The hazard itself is not easy to interpret heuristically. Without knowing the hazard function from the control group, an HR may not meaningfully summarize treatment effects for clinical decision-making. While the RMTL difference or ratio is model-free, a caveat is that the time window to define RMTL should be prespecified at the design stage based on clinical considerations. At the end of the study, one may select other times within the study duration for a sensitivity analysis.
In the presence of competing risks, quantifying treatment effects is more complex. If the treatment is effective in preventing CV deaths, one may observe an increasing risk of non-CV death at a later stage because death is unavoidable. Therefore, the comparison results should be presented simultaneously for all competing events and interpreted cautiously. The generalization of the proposal, including nonfatal competing events, is straightforward.
References
- 1.Royston P, Parmar MK. Restricted mean survival time: an alternative to the hazard ratio for the design and analysis of randomized trials with a time-to-event effect. BMC Med Res Methodol. 2013;13(1):152. [DOI] [PMC free article] [PubMed] [Google Scholar]
- 2.Uno H, Wittes J, Fu H, et al. Alternatives to hazard ratios for comparing the efficacy or safety of therapies in noninferiority studies. Ann Intern Med. 2015;163(2):127-134. [DOI] [PMC free article] [PubMed] [Google Scholar]
- 3.Kim DH, Uno H, Wei LJ. Restricted mean survival time as a measure to interpret clinical trial results. JAMA Cardiol. 2017;2(11):1179-1180. [DOI] [PMC free article] [PubMed] [Google Scholar]
- 4.Eichhorn EJ, Domanski MJ, Krause-Steinrauf H, Bristow MR, Lavori PW; Beta-Blocker Evaluation of Survival Trial Investigators . A trial of the beta-blocker bucindolol in patients with advanced chronic heart failure. N Engl J Med. 2001;344(22):1659-1667. [DOI] [PubMed] [Google Scholar]
- 5.Lau B, Cole SR, Gange SJ. Competing risk regression models for epidemiologic data. Am J Epidemiol. 2009;170(2):244-256. [DOI] [PMC free article] [PubMed] [Google Scholar]
- 6.Fine JP, Gray RJ. A proportional hazards model for the subdistribution of a competing risk. J Am Stat Assoc. 1999;94(446):496-509. doi: 10.1080/01621459.1999.10474144 [DOI] [Google Scholar]


