Abstract
Amphetamine (AMPH) induces depolarizing currents through the human dopamine transporter (hDAT). Recently we discovered that the S(+) enantiomer of AMPH induces a current through hDAT that persists long after its removal from the external milieu. The persistent current is less prominent for R(−)AMPH and essentially absent for dopamine (DA)-induced currents. Related agents such as methamphetamine also exhibit persistent currents, which are present in both frog oocyte and mammalian HEK expression systems. Here, we study hDAT-expressing Xenopus laevis oocytes voltage-clamped and exposed from outside to DA, S(+)AMPH, R(−)AMPH, and related synthesized compounds, including stereoisomers. The goal of the study was to determine how structural transitioning from dopamine to amphetamine influences hDAT potency and action. At saturating concentrations, S(+)AMPH or R(−)AMPH induce a sharply rising, depolarizing current from −60 mV that is comparable in amplitude to DA-induced currents. The magnitude and duration of the currents and the presence or absence of persistent currents depend on the concentration, duration of exposure, and the chemical structure and enantiomeric versions of the agents.
Keywords: human dopamine transporter; dopamine; amphetamine; deconstruction, electrophysiology; Xenopus oocyte expression
Introduction
One molecular target for amphetamine (AMPH) and amphetamine-like drugs, including methamphetamine (METH) and certain synthetic cathinones, is the human dopamine transporter, hDAT1, which is critical to dopaminergic signaling, reward pathways, DAT internalization, and substance abuse and addiction.
Cocaine and AMPH (1) critically modulate the dopaminergic system in the human brain by increasing extracellular dopamine (DA; 2) through reduced uptake1l, 2. Cocaine blocks uptake via hDAT, whereas AMPH competes with DA uptake through the transporter. Amphetamine also releases DA into the synaptic cleft by mechanisms that are only partially understood1i. Two models have been proposed for AMPH-induced DA release. One is reverse transport, which relies on AMPH-induced vesicular release of DA into the presynaptic terminal1c, 1m, 3; the other is docked vesicle fusion that releases DA directly into the synaptic cleft1d, 1h, 4. Both mechanisms implicate depolarization of the presynaptic membrane where hDAT is located. In a previously published work, we described this depolarization current in detail alongside a new phenomenon in which S(+)AMPH maintains hDAT in an open state long after S(+)AMPH is removed from the external milieu (10). This open state results in a so-called ‘persistent current’ through hDAT that would also depolarize the presynaptic membrane and, we posited, open Ca++ channels and stimulate fusion of docked vesicles and DA release1h, 4b.
Amphetamine (1) and DA (2) are structurally similar (Fig. 1), and both compounds generate depolarizing currents through hDAT; if a cell contains hDAT, then AMPH or DA will induce an inward current that would depolarize the cell from its resting potential. Inspection of the two structures would seem to indicate that the hydroxyl groups of DA (absent in AMPH) or the α-methyl group of AMPH (absent in DA) make little contribution to their common initial depolarizing action. Alternatively, the absence of one of these moieties might balance the presence of the other. In addition to the initial depolarizing event, we have noted a persistent current for S(+)AMPH, but not R(−)AMPH or DA. The structural moieties that are indifferent to, or responsible for, these functional characteristics are unknown. To examine this, we prepared and studied a series of agents that systematically transition from the DA (2) structure to the AMPH (1) structure.
Figure 1.
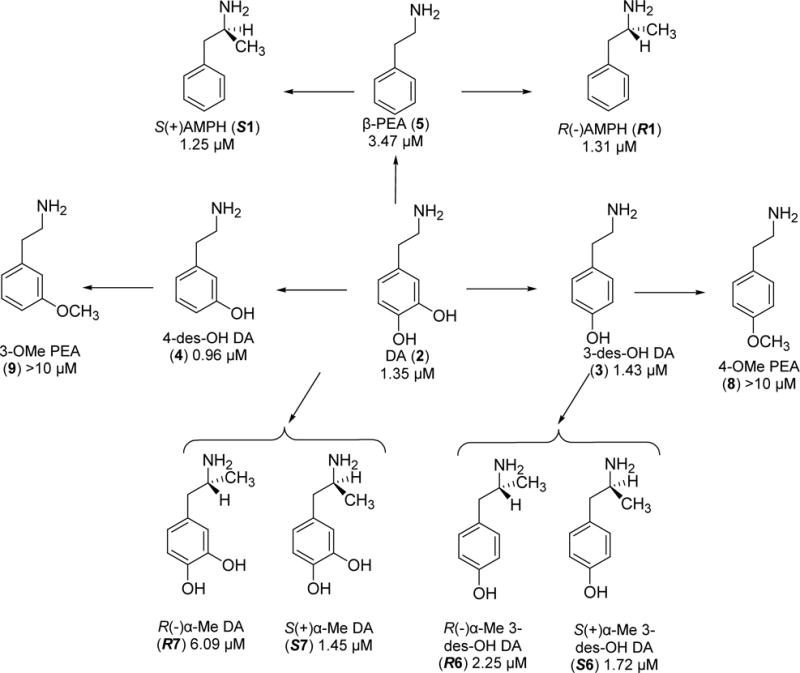
Agents examined followed by their EC50 values. Each arrow represents a single structural modification.
Results
Agents examined in this investigation are shown in Fig. 1. The measured parameters are EC50 values, defined by fitting the Hill equation to the normalized DA-induced current through hDAT as a function of compound concentration. EC50 values are included for each compound in Figure 1 and Table 1. The ‘peak’ current is the initial current after adding the drug. The persistent current amplitude, Ip, is measured in two ways: 1) the time constant for recovery, T50, after removing the test compound, and 2) current remaining after drug removal and relative to the peak current. Since 10 μM DA reaches the maximum (saturating) activation of current, we normalized test currents to the DA peak current to compare cells with different hDAT expression levels. Likewise, we normalized T50 to the DA recovery time.
Table 1.
Summary of agents tested, their EC50 values, Hill coefficient values, and their ability to generate a persistent current at 10μ M and −60 mV.
| Compounds | EC50 (μM) | Hill coefficients | Persistent Current |
| DA (2) | 1.35 ± 0.06 | 1.32 ±0.07 | No |
| R(−)AMPH (R1) | 1.31 ± 0.22 | 0.82 ±0.09 | No |
| S(+)AMPH (S1) | 1.25 ± 0.14 | 1.33 ±0.17 | Yes |
| 3-des-OH DA (3) | 1.43 ± 0.17 | 0.91 ±0.08 | No |
| 4-des-OH DA (4) | 0.96 ± 0.08 | 1.07 ±0.09 | No |
| β-PEA (5) | 3.47 ± 0.18 | 1.06 ± 0.16 | Yes |
| R(−) α-Me 3-des-OH DA (R6) |
2.25 ± 0.21 | 0.98 ± 0.08 | No |
| R(−) α-Me DA (R7) | 6.09 ± 0.52 | 0.55 ± 0.06 | No |
| S(+) α-Me 3-des-OH DA (S6) |
1.72 ± 0.38 | 0.49 ± 0.05 | No |
| S(+) α-Me DA (S7) | 1.45 ± 0.50 | 0.71 ± 0.11 | No |
When oocytes expressing hDAT are held at −60 mV, (i.e., near the resting potential of excitable cells), DA (EC50 = 1.35 μM) induces a current that depolarizes the cell (Figure 2). A similar depolarizing current occurs when the oocyte is exposed to R(−)AMPH (EC50 = 1.31 μM). However, exposing the oocyte to S(+)AMPH (EC50 = 1.25 μM) generates not only the initial depolarizing current but also an additional phenomenon: namely, after removing S(+)AMPH from the external milieu a cocaine-sensitive current persists (Figure 2). Cocaine also blocks the DA- and R(−)AMPH-induced initial currents and in all cases results in an apparent outward current that is actually the obstruction of a leak through hDAT, which is present even in the absence of an hDAT stimulus. Figure 2D shows a dose response for these three compounds. Fitting these data to the Hill equation demonstrates approximately equal potency but a rank order of efficacy S(+)AMPH > DA > R(−)AMPH. Efficacies are compared relative to DA at saturating concentrations.
Figure 2. Dopamine (DA) and amphetamine (AMPH) induced currents.
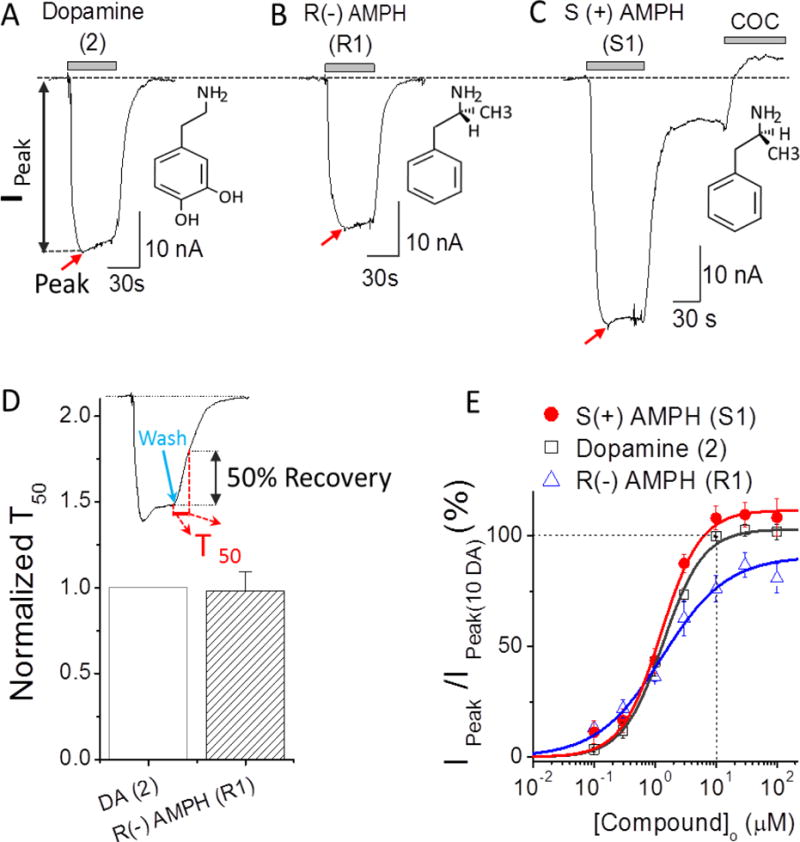
(A) 10 μM DA-induced current at −60 mV. The inset shows the DA structure. Current returns to the original baseline upon DA removal. (B) Similar to panel A but for R(−)AMPH (R1). (C) Similar to panel A but for S(+)AMPH(S1). Note that S(+)AMPH induced a prominent persistent current as previously reported1j. The initial peak current and the persistent current are blocked by a cocaine analogue, 10 μM RTI-55, to a value positive to the baseline, suggesting the presence of an endogenous inward leak current through hDAT. (D) The recovery time T50 represents 50% return to baseline after the external test compound is removed, as indicated by the green arrow in the inset (D). If the return time is significantly longer than it is for DA, we refer to the current as ‘persistent’ (Fig. 3). By this measure, R(−) AMPH is not persistent. For S(+)AMPH, the transporter appears ‘locked’ in an open state, and this is also referred to as a persistent current. β-PEA exhibits a similar locked open state at higher concentrations (Fig. 6). (E) Dose-response curves for DA (open squares), R(−)AMPH (blue triangles) and S(+)AMPH (red filled circles) at −60 mV. The points at each concentration were obtained by normalizing to the 10 μM DA response in the same cell (see Methods). Solid lines are fits to the Hill equation with Hill coefficients and EC50 for DA: n = 1.32 ± 0.07, EC50 = 1.35 ± 0.06 μM; for R(−)AMPH n=0.82 ± 0.09, EC50=1.31 ± 0.22 μM; for S(+)AMPH: n = 1.33 ± 0.17, EC50 =1.25 ± 0.14μM. The “peak” current (Ipeak) was measured from the baseline (dotted) to the peak, indicated by red arrows. Data points represent n = 3–7 and error bars are the standard error of mean. Red arrows indicate peak depolarization upon addition of the compounds.
Removing one or the other hydroxyl group from DA (i.e., 3 and 4; EC50 = 1.43 and 0.96 μM, respectively) does not significantly alter the induced current profile when compared with DA (Figure 3A and B, Table 1). However, removing both hydroxyl groups results in a significantly longer return to baseline after the compound is removed; this naturally occurring compound, β-phenylethylamine (β-PEA; 5) (EC50 = 3.47 μM) (Figure 3C and Table 1), possesses significantly weaker potency for hDAT compared with DA (see Table 1). Note that at 10 μM, adding an α-methyl group to β-PEA (5), such that it is converted to S(+)AMPH, exacerbates the persistent current, whereas as adding a methyl group, such that it converts β-PEA to R(−)AMPH, eliminates the persistent current. Higher concentrations (100 μM), however, produce a more pronounced persistent current in β-PEA (see Fig. 6 for two ways to measure the persistent current).
Figure 3. Depolarizing currents for deconstructed DA analogs.
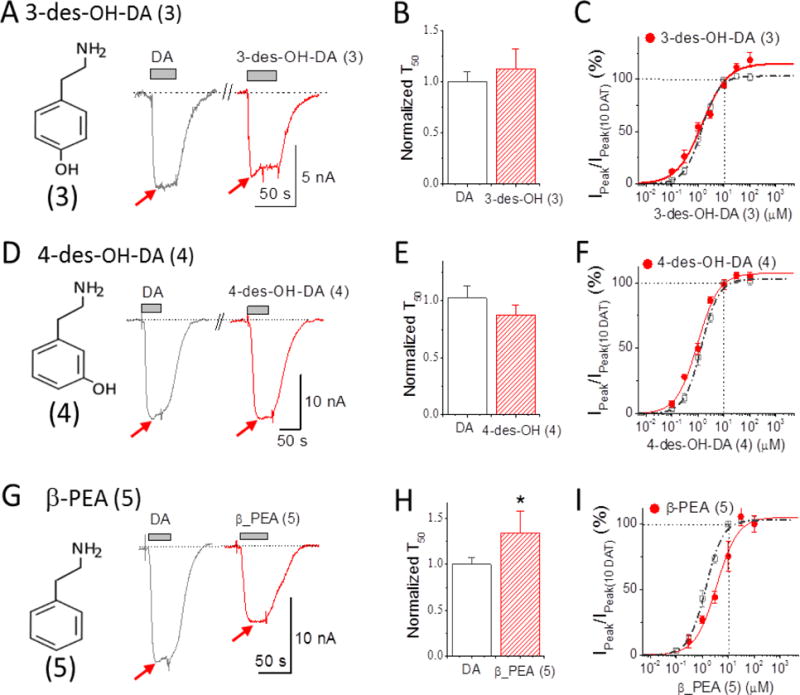
(A) Depolarizing action of 10 μM 3-des-OH DA (3) (red) compared to 10 μM DA (2) (black). 10 μM 3-des-OH DA is less potent than 10 μM DA and had no pronounced persistent current. The inset shows the structure of 3-des-OH DA. (B) Bars represent normalized recovery time constants at −60 mV upon removal of 10 μM DA or 3-des-OH DA (mean ± S.E., n = 4-5). (C) Dose-response curve for 3-des-OH DA (red) at −60 mV normalized to 10 μM DA in the same cell. Solid line fits the Hill equation: for 3-des-OH DA, n = 0.91 ± 0.08, EC50 = 1.45 ± 0.18 μM. (D)-(F) repeats this protocol for 4-des-OH DA (4) (red) compared to 10 μM DA (black). 10 μM 4-des-OH DA has similar potency to 10 μM DA and no pronounced persistent current. The inset in the left shows the structure of 4-des-OH DA. Hill equation parameters for 4-des-OH DA are: n = 1.07 ± 0.09, EC50 = 0.96 ± 0.08 μM. (G)-(I) repeats this protocol for β-PEA (5) (red) compared to 10 μM DA (black). 10 μM β-PEA showed roughly half the potency of 10 μM DA. The recovery time upon removal of β-PEA compared to DA was significantly slowed (P<0.01). Hill equation parameters for β-PEA are: n = 1.06 ± 0.17, EC50 = 3.47 ± 0.56 μM, which is 3 times the EC50 for DA. Note: T50 in B, E and H represent the time constant required to reach 50% of the recovery upon removal of the compound. For comparison, the dose-response curve for DA in Figure 1D is also shown in dashed line in C, F and I. Arrows indicate peak depolarization upon addition of the compounds.
Figure 6. Depolarizing currents elicited at 100 μM concentration: persistent current defined as A) time constant of recovery, T50, or B) current remaining after removing the compound externally (washout).
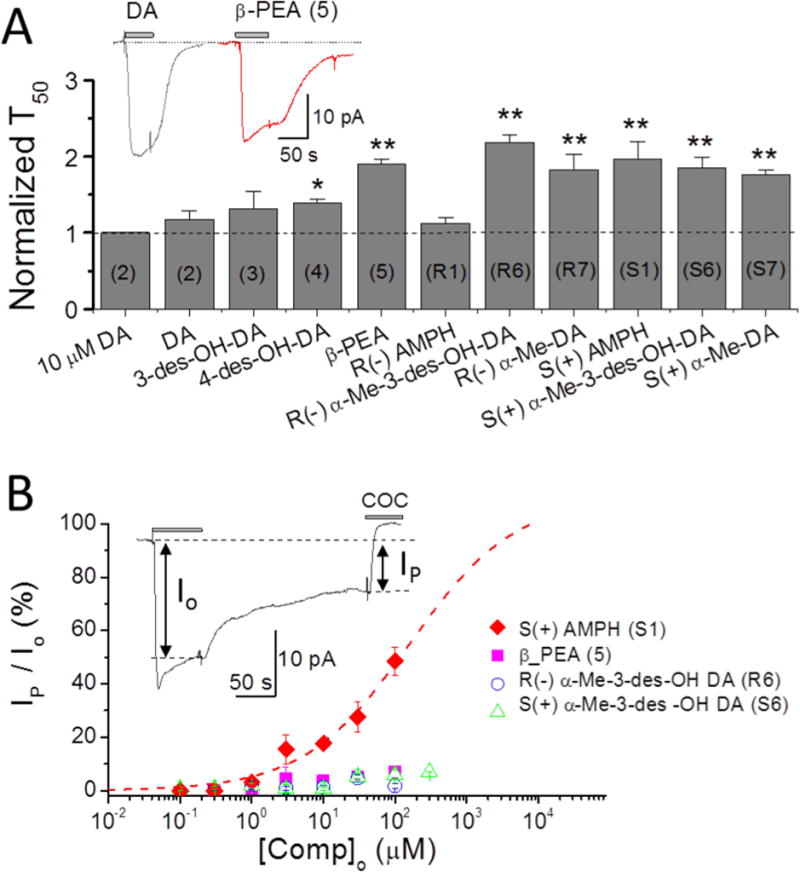
A. Time constants of recovery after removal of test compounds. All agents induce a significantly slower recovery than DA except 3-des-OH DA (3) and R(−)AMPH (R1). Compounds designated with (*) or (**) and with T50 values greater than 1 (dotted line) are referred to as ‘persistent’ at 100 μM; only β-PEA also passes this test at 10 μM (Fig. 3). S(+)AMPH generates a prominent ‘shelf’ with a flattened current, also seen at 10 μM in Fig. 2, while other agents have only delayed recovery times expressed as T50 > 1 at this higher concentration; however, β-PEA may also show a ‘shelf’ or ‘flattening’, as shown in the inset. Data recorded at −60 mV. Note: the numbers for each compound are labeled inside the column. The symbols ** imply p < 0.001 and * p < 0.01.
B. The relative persistent currents of four compounds selected from panel A for slow recovery times are shown here as a function of concentration. The current Io is the induced depolarizing current just before washout, and Ip is the current remaining after washout just before block with cocaine. Only S(+)AMPH (S1) stands out at all concentrations; β-PEA (5), with relatively slow recovery and a ‘shelf’ similar to S(+)AMPH, has a much lower persistent current than S(+)AMPH (S1) by this definition, as do R(−)α-Me 3-des OH DA (R6) and S(+)α-Me-3-des OH (S6) at all concentrations.
Adding one aromatic hydroxyl group to R(−)AMPH does not significantly change potency (EC50 = 2.25 and 1.72 μM for R6 and S6, respectively). On the other hand, chirality does influence efficacy (compare Fig. 4A and 5A). Adding both OH groups had little effect on the S-isomer (i.e., S7; (EC50 = 1.45 μM) but resulted in reduced potency (R7; EC50 = 6.09 μM) and increased efficacy for the R-isomer compared with DA (Figure 4B, Figure 5B and Table 1). Although the effects on potency and efficacy are slight, adding both hydroxyl groups to the aryl ring of S(+)AMPH completely eliminated the persistent current seen with S(+)AMPH (Figure 2). The O-methyl counterparts of 3 and 4 (i.e., 8 and 9, respectively) produced similar but comparatively small depolarizing currents at a concentration of 10 μM.
Figure 4. Depolarizing currents for R(−)AMPH derivatives: R(−)α–Me 3-des-OH DA (R6) and R(−)α–Me DA (R7).
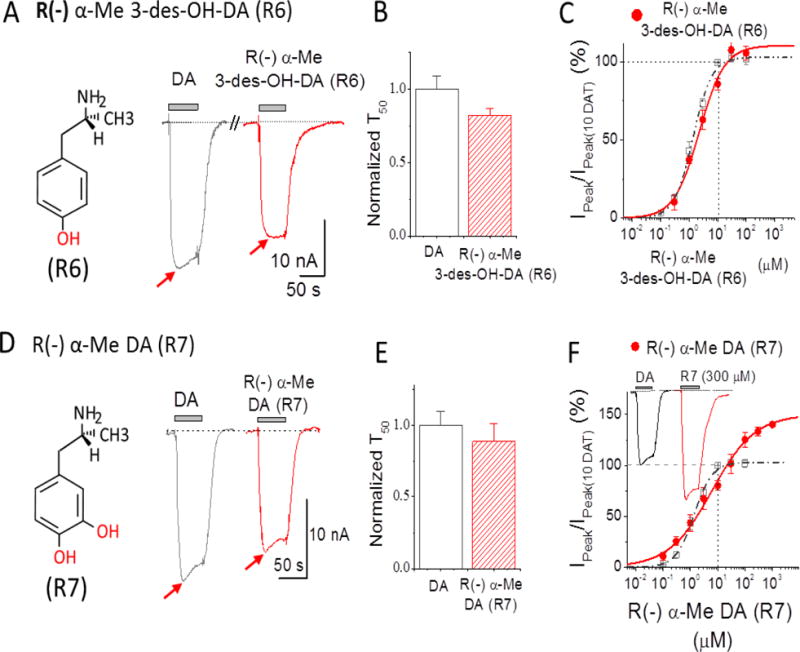
(A) 10 μM R(−)α-Me 3-des-OH-DA (R6) (red) compared to 10 μM DA (grey). The inset shows the structure of R(−)α-Me 3-des-OH-DA with one hydroxyl group (red) at position 4 was added in R(−)AMPH. Note: S(−)α-Me 3-des-OH-DA (R6) showed less potency than 10 μM DA, and current returned to baseline upon removal. (B) Recovery time constants at −60 mV upon removal of 10 μM DA or R(−) α-Me 3-des-OH-DA; rates were normalized to the equivalent experiment of 10 μM DA response in the same cell. Data points represent mean ± S.E., n = 5. (C) Dose response for R(−)α-Me 3-des-OH-DA (red filled circles) at −60 mV. The points at each concentration were obtained by normalizing to the response of 10 μM DA in the same cell. Solid line is fit to the Hill equation with n = 0.98 ± 0.08, EC50 = 2.25 ± 0.20 μM for R(−)α-Me 3-des-OH-DA. (D) 10 μM R(−)α-Me DA (R7) (red) compared to 10 μM DA (grey). The inset shows the structure of R(−)α-Me DA for which two hydroxyl groups (red) were added to R(−)AMPH. R(−)α-Me DA showed less potency than 10 μM DA and current returned to baseline after removal. (E). Recover time constants after removal of 10 μM DA or R(−)α-Me DA are not significantly different. Data points represent mean ± S.E., n = 4-7. (F) Dose-response for S(−)α-Me DA (red filled circles) at −60 mV. The points at each concentration were normalized to 10 μM DA in the same cell. Solid line is a fit to the Hill equation with n = 0.55 ± 0.06, EC50 = 6.09 ± 0.52 μM for R(−)α-Me DA. Dose-response curve from DA in Figure 1D is also shown in dashed line. n=4-7. Note: T50 in B and E represent the time constant required to reach 50% of the recovery upon removal of the compound. For comparison, the dose-response curve from DA in Figure 1D is also shown in dashed line in C and F. Arrows indicate peak depolarization upon addition of the compounds.
Figure 5. Depolarizing currents for the S(+)AMPH derivatives: S(+)α–Me 3-des-OH-DA (S6) and S(+)α–Me DA (S7).
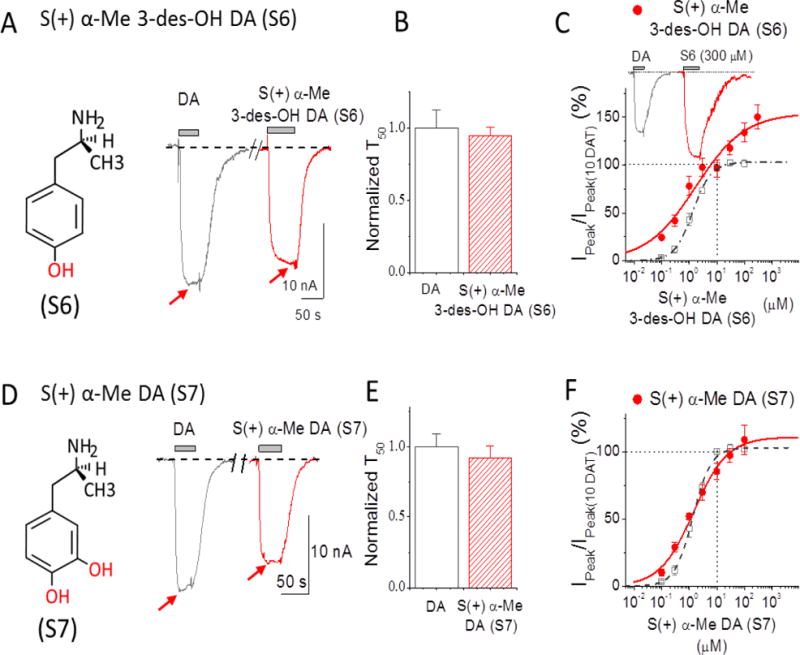
(A) 10 μM S(+)α-Me 3-des-OH-DA (red) compared to 10 μM DA (grey). The inset shows the structure of S(+)α-Me 3-des-OH-DA with one hydroxyl group (red) added to S(+)AMPH at the 4-position 4. S(+)α-Me 3-des-OH-DA showed similar potency when compared to DA and the current returned to baseline upon its removal. (B) Recovery time constants at −60 mV show no significant differences; rates were normalized to the equivalent experiment of 10 μM DA response in the same cell. Data points represent mean ± S.E., n = 4-5. (C) Dose-response for S(+)α-Me 3-des-OH-DA (red) at −60 mV. Points were normalized to DA response at 10 μM DA in the same cell. Solid line is fit to the Hill equation with n = 0.49 ± 0.05, EC50 = 1.72 ± 0.38 μM for S(+)α-Me 3-des-OH-DA, n = 3-6. (D) 10 μM S(+) α-Me DA (S7) (red) compared to 10 μM DA (Grey). The inset on the left shows the structure of S(+)α-Me DA with two hy-droxyl groups (red) added in S(+)AMPH at positions of 3 and 4. 10 μM R(−) α-Me DA showed significant less potency than 10 μM DA, but current returned to baseline after removal. (E) Recovery rates at −60 mV after removing 10 μM DA or S(+)α-Me DA, rates were normalized to the response of 10 μM DA in the same cell. Data points represent mean ± S.E., n = 5-6. (F) Dose response for S(+)α-Me DA (red) normalized to 10 μM DA in the same cell. Hill equation fit gave: n = 0.71 ± 0.11, EC50 = 1.45 ± 0.50 μM for S(+)α-Me DA, n = 4-6. Note: T50 in B and E represent the time constant required to reach 50% of the recovery upon removal of the compound. For comparison, the dose-response for DA in Figure 1D is also shown in dashed lines in C and F. Arrows indicate peak depolarization upon addition of the compounds.
The question arises whether the persistent current depends on concentration of the challenge compound. Figure 6 shows that agents with no persistent current at 10 μM induced significantly slower recoveries at 100 μM compared with DA at 100 μM. Except for DA-3-des-OH (3) and R(−)AMPH all compounds that were tested showed slow recovery after removal of the compound. For β-PEA (5) note the pronounced persistent current at 100 μM compared with 10 μM (Fig. 3). The efficacies of all agents at the higher concentration are, however, lower than S(+)AMPH.
Table 1 shows that the persistent current after removing the compound only occurs for S(+)AMPH (S1) and β-PEA (5) at low concentration (10 μM), with the common feature of no hydroxyl groups on the aryl ring. The persistent current is uncorrelated with the presence or absence of the methyl group or the EC50 value of the test compound, although as noted above the methyl group can reduce or exacerbate the persistent current depending respectively on its R or S configuration.
Discussion
The investigation began with a deconstruction of DA to determine initially if one, both, or which of the hydroxyl groups are required for its depolarizing action. Removal of the 3-hydroxyl group of DA (2) affords 3-des-OH DA (3), whereas removal of the 4-hydroxyl group affords 4-des-OH DA (4). Both agents had comparable potency similar to DA. β-PEA (5) represents DA devoid of both hydroxyl groups and its potency is only slightly less than DA. Evidently, neither of the hydroxyl groups of DA is required for its depolarizing action. We emphasize, however, that it is the absence of hydroxyl groups correlates with the persistent current; e.g., 10 μM β-PEA has a longer recovery time after removal compared to DA. This comparatively ‘lazy’ return to baseline of β-PEA is a weak ‘persistence’ alongside the gross flattening that occurs for β-PEA for at 100 μM, reminiscent of S(+)AMPH. Indeed, β-PEA is the only compound other than S(+)AMPH with significant persistence at all concentrations. Previous evidence indicates that S(+)AMPH interacts with the internal face of hDAT1j, which would require that S(+)AMPH remains inside long after it is removed outside. Internal S(+)AMPH may lock hDAT in an open configuration, whereas the weaker form of persistence measured as T50 (e.g., β-PEA) may represent the internal off-rate of the compound.
Because of the relative insensitivity of DAT to the presence or absence of the hydroxyl groups of DA, it was of interest to determine if a minor structural alteration would also be tolerated. In other words, is the transporter insensitive to aryl substitution? The O- methyl ethers of 3 and 4, the methoxyphenylethylamines 3-OMe PEA and 4-OMe PEA (8 and 9, respectively), produced comparatively small depolarizing currents at a concentration of 10 μM (data not shown). It would appear, then, that a substituent at the 3- and 4-position of phenylethylamines regulates the action and potency at DAT, but that the presence of hydroxyl groups per se is not a requirement for the depolarization.
β-PEA (5) is the structural backbone both of DA (2) and AMPH (1). AMPH, the α-methyl counterpart of β-PEA, exists as a pair of optical isomers and both were examined. The potency of S(+)AMPH was similar to that of its R(−) enantiomer and comparable to that of DA. Here too, it is shown that the hydroxyl groups are not required for the initial depolarizing action or potency. Stereochemistry played no role.
The α-methyl counterpart of DA, α-methyldopamine (α-Me DA), also exists as a pair of optical isomers: S7 and R7. The S(+)-isomer S7 is as potent as DA. The R(−) enantiomer R7 was several-fold less potent. Introduction of an α-methyl group to 3-des-OH DA (3) affords α-methyl-3-des-OH DA (6). Both isomers were examined; the S(+)isomer was approximately as potent as its R(−) enantiomer. Again the hydroxyl groups make a minimal contribution to the initial depolarizing potency, and stereo-chemistry plays, at best, a minor role.
It may appear as if the hydroxyl groups are simply “tolerated” or accommodated. However, a slight structural change (converting 4-des-OH DA and 3-des-OH DA to their corresponding O-methyl ethers, 3-OMe PEA and 4-OMe PEA, respectively; EC50 >10 μM) indicates that these regions are sensitive to structural alteration. Hence, whereas the presence of the individual hydroxyl groups does not contribute to the potency, the transporter is sensitive to the larger methoxy substituents.
Existing proposals for AMPH-induced increase in extracellular DA are facilitated exchange (21), DA efflux via channel mode or reverse transport through DAT (3), synaptic vesicle depletion into the presynaptic cytosol (13-15), and vesicular fusion and release of DA into the synaptic cleft via AMPH-induced currents through DAT that effect excitability and Ca++ influx at the presynaptic terminal (4, 8, 19). These models in particular depend on membrane depolarization, and understanding the chemical nature of substrate-induced depolarization is of primary interest. S(+)AMPH not only induces an initial depolarizing current similar to DA, but, in our model, hDAT transports S(+)AMPH into the cell where it holds hDAT in an open state long after S(+)AMPH is removed externally. This persistently open state is therefore use-dependent with both acute and long-term effects. Furthermore, after DAT is exposed to S(+)AMPH, subsequent exposure to DA also results in a persistent current that indicates DAT dysfunction (10). DAT associated depolarization and the persistent current in particular may play a role in the known effects of AMPH on excitability in dopaminergic neurons (1).
The combined results suggest: a) that hydroxyl groups are not a major contributor to the initial depolarization action or potency that occurs on application of the test compounds to hDAT, b) that stereochemistry has a minimal effect on potency but a major influence on the presence or absence of the persistent current, and c) the α-methyl group can affect the persistent current as it affects stereoisomers. The balance between the hydroxyl and α-methyl groups is exemplified by β-PEA, which lacks both features: β-PEA retains the initial depolarizing action, is about half as potent as DA or AMPH, and has a weak persistent current that increases with concentration.
Methods
Chemistry
2-(4-Hydroxyphenyl)-1-aminoethane hydrochloride (3) was synthesized in our laboratory as previously reported5. 2-(3-Hydroxyphenyl)-1-aminoethane (4) and 2-phenyl-1-aminoethane (or β-phenylethylamine; 5) were purchased from AstaTech Inc. (Bristol, PA) and Sigma-Aldrich (Saint Louis, MO), respectively, as their hydrochloride salts. Isomers of 1-(4-hydroxyphenyl)-2-aminopropane hydrochloride (S6 and R6) were prepared as reported previously6. Isomers of 1-(3,4-Dihydroxyphenyl)-2-aminopropane hydrobromide (S7 and R7) were synthesized according to the procedure described for the R enantiomer7. Melting points and optical rotations for the last two isomers have been previously reported for hydrochloride salts8 but not for hydrobromide salts. 2-(4-Methoxyphenyl)-1-aminoethane (8) and 2-(3-methoxyphenyl)-1-aminoethane (9) were prepared as their hydrochloride salts as previously reported5. Melting points were measured in glass capillary tubes (Thomas-Hoover melting point apparatus) and are uncorrected. Optical rotations were measured using a Jasco DIP-1000 polarimeter. All compounds were characterized by 1H NMR and spectra showed the expected chemical shifts. The purity of S7 and R7 (>95%) were established by elemental analysis (Atlantic Microlabs; Norcross, GA); values were within 0.4% of theory.
S(+)-1-(4-Hydroxyphenyl)-2-aminopropane hydrochloride (S6)
mp 169–172 °C (no literature mp reported), +24.7°, c 2.03, H2O.
R(–)-1-(4-Hydroxyphenyl)-2-aminopropane hydrochloride (R6)
mp 168–171 °C, (lit.3 mp 160 °C, dec.), −24.6°, c 2.01, H2O (lit.6 −26°, c 2.01, H2O).
S(+)-1-(3,4-Dihydroxyphenyl)-2-aminopropane hydrobromide (S7)
mp 164–166 °C, +21.3°, c 2, H2O, Anal. Calcd for C9H13NO2·HBr: C, 43.57; H, 5.69; N, 5.65.
Found: C, 43.56; H, 5.78; N, 5.58.
R(−)-1-(3,4-Dihydroxyphenyl)-2-aminopropane hydrobromide (R7)
mp 163–165 °C, −23.5°, c 2, H2O, Anal. Calcd for C9H13NO2·HBr: C, 43.57; H, 5.69; N, 5.65.
Found: C, 43.59; H, 5.73; N, 5.62.
Expression of the human DAT in Xenopus oocytes
Xenopus laevis oocytes were harvested and prepared using the standard protocols described previously9. hDAT cRNA was transcribed into the pOTV vector (gift of Mark Sonders, Columbia University) using mMessage Machine T7 kit (Ambion Inc., Austin, TX) and injected within 24-h of Xenopus laevis oocytes isolation. Each oocyte was injected with 36–42 nL of 1 mg/mL hDAT cRNA (final amount 36–42 ng) (Nanoject Au-toOocyteInjector, Drummond Scientific Co., Broomall, PA) and incubated at 18°C in OR2(+) solution as used previously10. Recordings were performed 8–10 days following injection.
Two-electrode voltage clamp (TEVC) in Oocytes
TEVC recordings in Xenopus laevis oocytes were recorded by conventional two-electrode voltage-clamp as described previously.1j, 10b. The standard buffer solution perfused extracellular is (in mM): 120 NaCl, 7.5 HEPES, 5.4 K+ gluconate, 1.2 Ca2+ gluconate, and pH 7.4 with KOH. Electrodes were filled with 3 M KCl and had resistances from 1–2 MΩ. Xenopus oocytes expressing hDAT were voltage-clamped to −60 mV, and the buffer was gently introduced until a stable baseline was obtained. In order to compare data from different oocytes, we perfused 10μM DA prior the application of a particular compound and normalized all data to the first DA response (peak current at −60 mV). Dose responses for each compound were obtained by different extracellular concentrations (bath solution). For compounds that when screened showed a persistent current similar to S(+)AMPH, the peak and persistent currents for these compounds at each concentration were obtained from a separate oocyte injected with hDAT.
Data Analysis
Data acquisition and analysis were carried out using pClamp9 (Molecular Devices) and Origin (Microcal) software. The EC50 for each compound were obtained by fitting to the standard Hill equation as used previously [27, 29],
Where I/Io(%) is fraction of normalized current, [X]o is the drug concentration applied from the extracellular side, n is the Hill coefficient, and EC50 is the drug concentration required to reach half of the maximum activation.
Acknowledgments
We wish to thank our colleagues KN Cameron, Rachel Dietz, J-M Eltit, M Moustafa, E Solis Jr, T Steele, and I Ruchala and for making valuable contributions to this work, which was supported by NIH 1RC1DA028112-01, NIH NIDA 5R01DA033930, and to Dr. Tang the Jiangsu Specially-Appointed Professor Program (53051117).
References
- 1.(a) Ingram SL, Prasad BM, Amara SG. Dopamine transporter-mediated conductances increase excitability of midbrain dopamine neurons. Nat Neurosci. 2002;5(10):971–8. doi: 10.1038/nn920. [DOI] [PubMed] [Google Scholar]; (b) Williams JM, Galli A. The dopamine transporter: a vigilant border control for psychostimulant action. Handbook of experimental pharmacology. 2006;(175):215–32. doi: 10.1007/3-540-29784-7_11. [DOI] [PubMed] [Google Scholar]; (c) Kahlig KM, Binda F, Khoshbouei H, Blakely RD, McMahon DG, Javitch JA, Galli A. Amphetamine induces dopamine efflux through a dopamine transporter channel. Proc Natl Acad Sci U S A. 2005;102(9):3495–500. doi: 10.1073/pnas.0407737102. [DOI] [PMC free article] [PubMed] [Google Scholar]; (d) Daberkow DP, Brown HD, Bunner KD, Kraniotis SA, Doellman MA, Ragozzino ME, Garris PA, Roitman MF. Amphetamine paradoxically augments exocytotic dopamine release and phasic dopamine signals. J Neurosci. 2013;33(2):452–63. doi: 10.1523/JNEUROSCI.2136-12.2013. [DOI] [PMC free article] [PubMed] [Google Scholar]; (e) Siciliano CA, Calipari ES, Ferris MJ, Jones SR. Biphasic mechanisms of amphetamine action at the dopamine terminal. The Journal of neuroscience: the official journal of the Society for Neuroscience. 2014;34(16):5575–82. doi: 10.1523/JNEUROSCI.4050-13.2014. [DOI] [PMC free article] [PubMed] [Google Scholar]; (f) Siciliano CA, Calipari ES, Jones SR. Amphetamine potency varies with dopamine uptake rate across striatal subregions. Journal of neurochemistry. 2014 doi: 10.1111/jnc.12808. [DOI] [PMC free article] [PubMed] [Google Scholar]; (g) Furman CA, Chen R, Guptaroy B, Zhang M, Holz RW, Gnegy M. Dopamine and amphetamine rapidly increase dopamine transporter trafficking to the surface: live-cell imaging using total internal reflection fluorescence microscopy. J Neurosci. 2009;29(10):3328–36. doi: 10.1523/JNEUROSCI.5386-08.2009. [DOI] [PMC free article] [PubMed] [Google Scholar]; (h) De Felice LJ, Glennon RA, Negus SS. Synthetic cathinones: chemical phylogeny, physiology, and neuropharmacology. Life Sci. 2014;97(1):20–6. doi: 10.1016/j.lfs.2013.10.029. [DOI] [PMC free article] [PubMed] [Google Scholar]; (i) Goodwin J, Logan M, DeFelice L, Khoshbouei H. Methamphetamine has an exclusive target and a shared target with amphetamine to regulate dopamine transporter function. Submitted. 2007 [Google Scholar]; (j) Rodriguez-Menchaca AA, Solis E, Jr, Cameron K, De Felice LJ. S(+)amphetamine induces a persistent leak in the human dopamine transporter: molecular stent hypothesis. Br J Pharmacol. 2012;165(8):2749–57. doi: 10.1111/j.1476-5381.2011.01728.x. [DOI] [PMC free article] [PubMed] [Google Scholar]; (k) Amara SG, Sonders MS. Neurotransmitter transporters as molecular targets for addictive drugs. Drug Alcohol Depend. 1998;51(1–2):87–96. doi: 10.1016/s0376-8716(98)00068-4. [DOI] [PubMed] [Google Scholar]; (l) Sulzer D. How addictive drugs disrupt presynaptic dopamine neurotransmission. Neuron. 2011;69(4):628–49. doi: 10.1016/j.neuron.2011.02.010. [DOI] [PMC free article] [PubMed] [Google Scholar]; (m) Sulzer D, Chen TK, Lau YY, Kristensen H, Rayport S, Ewing A. Amphetamine redistributes dopamine from synaptic vesicles to the cytosol and promotes reverse transport. J Neurosci. 1995;15(5 Pt 2):4102–8. doi: 10.1523/JNEUROSCI.15-05-04102.1995. [DOI] [PMC free article] [PubMed] [Google Scholar]
- 2.Sulzer D. How Addictive Drugs Disrupt Presynaptic Dopamine Neurotransmission. Neuron. 2012;69:628–649. doi: 10.1016/j.neuron.2011.02.010. [DOI] [PMC free article] [PubMed] [Google Scholar]
- 3.(a) Sulzer D, Maidment NT, Rayport S. Amphetamine and other weak bases act to promote reverse transport of dopamine in ventral midbrain neurons. J Neurochem. 1993;60(2):527–35. doi: 10.1111/j.1471-4159.1993.tb03181.x. [DOI] [PubMed] [Google Scholar]; (b) Sulzer D, Sonders MS, Poulsen NW, Galli A. Mechanisms of neurotransmitter release by amphetamines: a review. Progress in neurobiology. 2005;75(6):406–33. doi: 10.1016/j.pneurobio.2005.04.003. [DOI] [PubMed] [Google Scholar]; (c) Kahlig KM, Javitch JA, Galli A. Amphetamine Regulation of Dopamine Transport. J Biol Chem. 2004;279(10):8966–75. doi: 10.1074/jbc.M303976200. [DOI] [PubMed] [Google Scholar]
- 4.(a) De Felice LJ, Cameron KN. Comments on “A Quantitative Model of Amphetamine Action on the Serotonin Transporter, by Sandtner et al. (2013) Br J Pharmacol. 2014 doi: 10.1111/bph.12767. [DOI] [PMC free article] [PubMed] [Google Scholar]; (b) Ruchala I, Cabra V, Solis E, Jr, Glennon RA, De Felice LJ, Eltit JM. Electrical coupling between the human serotonin transporter and voltage-gated Ca(2+) channels. Cell Calcium. 2014;56(1):25–33. doi: 10.1016/j.ceca.2014.04.003. [DOI] [PMC free article] [PubMed] [Google Scholar]; (c) DeFelice LJ, Goswami T. Transporters as channels. Annu Rev Physiol. 2007;69:87–112. doi: 10.1146/annurev.physiol.69.031905.164816. [DOI] [PubMed] [Google Scholar]
- 5.Glennon RA, Liebowitz SM, Anderson II., I Serotonin receptor affinities of psychoactive phenalkylamine analogues. J Med Chem. 1980;23:294–299. doi: 10.1021/jm00177a017. [DOI] [PubMed] [Google Scholar]
- 6.(a) Roth GJ, Fleck M, H N, Kley J, Lehmann-Lintz T, N H. New compounds, pharmaceutical compositions and uses thereof. 2012028676. WO Patent. 2012 March 8, 2012.; (b) Crowell TA, Evrard DA, Jones CD, Muehl BS, Rito CJ, Shuker AJ, Thorpe AJ, Thrasher KJ. Selective β3 adrenergic agonists. 9809625. WO Patent. 1998 March 12, 1998.
- 7.Belley LJ, Thompson M, Dean DK, Kotecha NR, Berge JM, Ward RW. Aryloxy and arylthiopropolamine derivatives useful as beta 3-adrenoreceptor agonists and antagonists of the beta 1 and beta 2-adrenoreceptors and pharmaceutical composition thereof. 9604233. WO Patent. 1996 February 15, 1996.
- 8.Smith HE, Burrows EP, Chen FM. Optically active amine. 24. Circular dichroism of the para-substituted benzene chromophore. J Am Chem Soc. 1978;100:3714–3720. [Google Scholar]
- 9.Tang QY, Zhang Z, Xia J, Ren D, Logothetis DE. Phosphatidylinositol 4,5-bisphosphate activates Slo3 currents and its hydrolysis underlies the epidermal growth factor-induced current inhibition. J Biol Chem. 2010;285:19259–19266. doi: 10.1074/jbc.M109.100156. [DOI] [PMC free article] [PubMed] [Google Scholar]
- 10.(a) Tang Q, Zhang Z, Xia X, Lingle C. Block of mouse Slo1 and Slo3 K+ channels by CTX, IbTX, TEA, 4-AP and quinidine. Channels. 2010;4:22–41. doi: 10.4161/chan.4.1.10481. [DOI] [PMC free article] [PubMed] [Google Scholar]; (b) Tang QY, Zhang Z, Meng XY, Cui M, Logothetis DE. Structural Determinants of Phosphatidylinositol 4,5-Bisphosphate (PIP2) Regulation of BK Channel Activity through the RCK1 Ca2+ Coordination Site. J Biol Chem. 2014;289:18860–18872. doi: 10.1074/jbc.M113.538033. [DOI] [PMC free article] [PubMed] [Google Scholar]


