

Summary
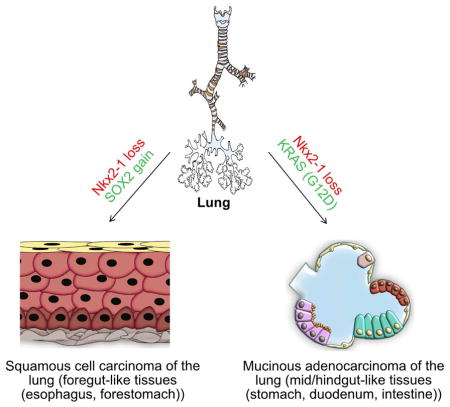
We show that the loss or gain of transcription factor programs that govern embryonic cell fate specification is associated with a form of tumor plasticity characterized by the acquisition of alternative cell fates normally characteristic of adjacent organs. In human non-small cell lung cancers, downregulation of the lung lineage-specifying TF NKX2-1 is associated with tumors bearing features of various gut tissues. Loss of Nkx2-1 from murine alveolar, but not airway, epithelium results in conversion of lung cells into gastric-like cells. Superimposing oncogenic Kras activation enables further plasticity in both alveolar and airway epithelium, producing tumors that adopt mid and hindgut fates. Conversely, coupling Nkx2-1 loss with foregut lineage-specifying SOX2 overexpression drives the formation of squamous cancers with features of esophageal differentiation. These findings demonstrate that elements of pathologic tumor plasticity mirror the normal developmental history of organs in that cancer cells acquire cell fates associated with developmentally related neighboring organs.
Keywords: Non-small cell lung cancers, Transdifferentiation, Tumor heterogeneity, Tumor plasticity
eTOC blurb
Many tumors are characterized by the loss or gain of transcription factors that govern embryonic cell fate specification. Tata, Chow et al. show that elements of pathologic tumor plasticity mirror the developmental history of organs, in that plastic cancer cells can acquire cell fates normally associated with developmentally-related, neighboring organs.
Introduction
Genetic context (Govindan, 2014; Marusyk et al., 2012; McGranahan and Swanton, 2015; Meacham and Morrison, 2013), microenvironment (Egeblad et al., 2010; Hanahan and Weinberg, 2011; Junttila and de Sauvage, 2013), and cell of origin (Blanpain, 2013; Kwon and Berns, 2013; Visvader, 2011; Xu et al., 2014) have each been implicated in the development of tumor heterogeneity. Comprehensive integrated analyses have identified distinct patterns of genomic mutations, epigenetic alterations, and expression signatures that have been used to classify lung cancers (Campbell et al., 2016; Cancer Genome Atlas Research Network, 2014). Indeed, lineage-specifying transcription factors have been implicated as oncogenic drivers in diverse lung cancer types (Garraway and Lander, 2013). Specifically, the foregut endoderm-specifying transcription factor, SOX2, and the lung identity transcription factor, NKX2-1, have been shown to be amplified in lung squamous cell carcinoma and lung adenocarcinoma, respectively (Bass et al., 2009; Weir et al., 2007). Additionally, murine genetic models have revealed a role for developmental transcription factors in tumor plasticity. In the absence of the lung lineage-specifying factor NKX2-1, mutant KRAS engenders the development of a particular form of lung adenocarcinoma, mucinous adenocarcinoma, that remarkably manifests elements of gastric differentiation (Maeda et al., 2012; Snyder et al., 2013). On the other hand, the overexpression of SOX2, along with the concurrent loss or gain of various factors including PI3KA, LKB1, PRKCI, CDKN2a/b and PTEN, results in squamous cell carcinoma (Ferone et al., 2016; Han et al., 2014; Justilien et al., 2014; Kim et al., 2016; Mukhopadhyay et al., 2014).
To establish a comprehensive framework for explaining how heterogeneous cell types arise within individual tumors and across tumor subtypes, we analyzed transcription factor and organ-specific gene expression data from normal human tissues and lung tumors. Subsequently, we deployed 12 murine genetic lung cancer models to precisely modulate the embryonic transcription factors that regulate lung cell fate in the embryo, in order to assess the roles of these transcription factors in lung tumor plasticity. We show that transcription factors known to govern embryonic cell fate specification in the embryonic endoderm tend to impact tumor plasticity in a strikingly parallel fashion. Indeed, we further show that the loss of lineage-specifying transcription factors is associated with tumor plasticity in diverse gut organs. Interestingly, plastic tumor cells adopt cell fates characteristic of closely neighboring gut organs, mirroring the normal developmental history of organ-specific epithelium from an earlier endodermal epithelium that is capable of differentiating into multiple distinct organ-specific epithelia.
Results
SOX2 and NKX2-1 expression patterns delineate 3 subsets of human non-small cell lung cancers (NSLSCs)
NSCLCs include both squamous cell carcinomas (SCCs) and adenocarcinomas (ADCs). These cancers can be further classified into subtypes based on their molecular and histological features and their expression of the lineage specifying transcription factors SOX2 and NKX2-1. Of note, during embryonic gut endoderm regionalization, SOX2 and NKX2-1 play critical roles in establishing discrete gut and lung organ domains (Wells, 2015). We therefore wondered whether some of the developmental paradigms that govern embryonic development also govern tumor cell heterogeneity. To determine whether these developmental regulators can segregate subtypes of lung cancers, we analyzed TCGA RNA-seq expression data (Cancer Genome Atlas Research Network, 2014) (total n = 1019 tumors; ADCs, n = 518; SCCs, n = 501).
Solely on the basis of SOX2 and NKX2-1 expression, we classified NSCLCs into four quadrants (Fig. S1A). SOX2highNKX2-1high cancers were found to be a mix of ADCs and SCCs. SOX2lowNKX2-1high cancers were predominantly ADCs, whereas SOX2highNKX2-1low cancers were SCCs (Fig. 1A and Fig. S1A). The NKX2-1high ADCs expressed lung-specific genes in accord with the notion that NKX2-1 is a lung lineage-specifying transcription factor (Wells, 2015) (Fig. 1B and Fig. S1B). SOX2highNKX2-1low SCCs displayed expression of markers specific to squamous cell-containing tissues such as the esophagus, but did not express genes associated with normal lung. Interestingly, a large fraction of tumors lacked both of the cardinal lung lineage-specifying transcription factors and were classified as SOX2lowNKX2-1low (n = 156) (Fig. 1A, Fig. S1A). To parse the identity of these tumors, we first used k-means clustering to define two subgroups (Group 4.1 and 4.2) in the SOX2lowNKX2-1low population (Fig. S1A). Notably, none of these lung cancers expressed classical lung markers such as SFTPA3, NAPSA and LMO3 (Fig. S1B), consistent with their lack of the lung lineage-specifying transcription factor NKX2-1. Further analysis revealed high expression of squamous markers in Group 4.1, in accordance with their histologic subtype as SCCs (Fig. 1A–B and Fig. S1A–B). In contrast, the transcriptional signatures of Group 4.2 tumors were consistent with a third distinct NSCLC subtype, invasive mucinous adenocarcinoma (hereafter referred to as MADs). These tumors had poor prognosis compared to other NSCLCs (Fig. 1A–B and Fig. S1A–C). Furthermore, the tumors expressed an extensive panel of well-established lineage-specific markers of gastrointestinal organs, such as CDX2 (expressed in midgut/hindgut, absent in stomach), HNF4α (a pan-gastrointestinal marker), and PDX1 (present in pancreas and duodenum, absent in hindgut) (Fig. 1B and Fig. S1b, 2A–C) (Wells, 2015). MADs also expressed mature differentiated markers encountered in the normal cell types of neighboring gut organs. These include MUC2 (an intestinal mucin), MUC6 (a gastric mucin), TFF2 (a gastric secretory product), PRSS1 (pancreatic and duodenal trypsin), and CPS1 (an enzyme highly expressed in liver and intestine) (Fig. S2A–C). Notably, of all tumor specimens analyzed, the entire tumor tissue was composed of either MADs (n = 23) or ADCs (n = 61) but never both, based on the protein expression of HNF4a and Nkx2-1, respectively. In aggregate, by using the expression of 2 lineage specifying transcription factors, NKX2-1 and SOX2, we were able to classify NSCLCs into three distinct groups (ADCs, SCCs, and MADs) (Fig. 1A– B). Interestingly, in difficult to classify so-called adenosquamous tumors, NKX2-1 expression is exclusively present in the adenocarcinomatous parts of the tumor and is absent from the squamous regions, that instead are positive for the squamous marker dNp63 (also known as p40) (Fig. 1C and Fig. S1C).
Figure 1. Molecular and histologic features of human NSCLCs are reminiscent of embryonic gut endodermal patterning events.

A, Classification of non-small cell lung tumors (n = 1019) into three groups by expression of SOX2 and NKX2-1. ADC (adenocarcinoma, n = 474), SCC (squamous cell carcinoma, n = 485), and MAD (mucinous adenocarcinoma, n = 60). B, Heat map of select differentially expressed genes. C, Immunohistochemistry for an SCC marker p40 (left) and an ADC marker NKX2-1 (right) on an adenosquamous lung tumor. Yellow dotted line indicates the boundary between SCC and ADC within a single tumor. D, Immunostaining on sections from human SCC for SOX2 (green), PAX9 (red), and NKX2-1(white) (left), CK6 (green) and CK1 (red) (middle), p63 (green) and CK14 (red) (right). E, Immunostaining on serial sections from human MADs. H&E (top row, left), Alcian blue (top row, center), and TFF2 (green) (top row, right); HNF4α (green), PDX1 (red), and NKX2-1 (white) (middle row, left); CDX2 (green), SOX9 (red), and NKX2-1 (white) (middle row, center); PRSS1 (red) (middle row, right). CDX2 (green) and PDX1 (red) (bottom row, left); CDX2 (green), PDX1 (red), and MUC6 (cyan) (bottom row, center). Dotted lines correspond to boundaries in organ-specific differentiation in contiguous gut epithelia. Color-coded boxes in the top, middle and bottom panels correspond to specified regions on the H&E image. F, Pie chart of the dominant tissue types identified in human MADs (n = 23). Blue, stomach-like; yellow, duodenum-like; red, intestine-like. Nuclei, DAPI. Scale bars, 20 μm. See also Figure S1, 2, and 3.
Figure 2. Alveolar cells, but not airway cells, convert into alternate gut-like cell fates after loss of the lung lineage-specifying transcription factor Nkx2-1.

A, Immunostaining on sections from Sox2-Nkx2-1f/f mice (n = 3). Alcian Blue and Fast Red staining (left). Enlargements show the black boxed regions at higher magnification. Immunofluorescence for TFF2 (green), MUC5AC (red), and NKX2-1 (white) (middle), HNF4α (green), PDX1 (red), and NKX2-1 (white) (right). Nuclei, DAPI (blue). Black arrows, areas of mucous differentiation. B, Quantification of Nkx2-1+ cells normalized to total Sox2+ cells in the airways of Sox2-Nkx2-1f/f mice (n = 3). Mice treated with tamoxifen had significantly fewer Nkx2-1+ cells (two-sided t test, **P < 0.01). C, Immunostaining on sections from Sftpc-Nkx2-1f/f mice (n = 4). Alcian Blue and Fast Red staining (left). Insets show the black boxed regions at higher magnification. Immunofluorescence for TFF2 (green), MUC5AC (red), and NKX2-1 (white) (middle), HNF4α (green), PDX1 (red), and NKX2-1 (white) (right). Nuclei, DAPI (blue). Black arrows, areas of mucous differentiation. D, Quantification of Nkx2-1+ cells normalized to total EpCAM+ cells in the alveoli of Sftpc-Nkx2-1f/f mice (n = 3). Mice treated with tamoxifen had significantly fewer Nkx2-1+ cells (two-sided t test, ***P < 0.001). E, Quantification of Nkx2-1+ (orange) and Hnf4a+ (blue) cells in the alveoli of Sftpc-Nkx2-1f/f mice (n = 3), normalized to total E-cadherin+ cells. F, Immunostaining on sections from control airway (top row) (n = 3) and control alveoli (bottom row) (n = 3). Alcian Blue and Fast Red (left), TFF2 (green), MUC5AC (red), and NKX2-1 (white) (middle), HNF4α (green), PDX1 (red), and NKX2-1 (white) (right). Nuclei, DAPI (blue). Scale bars, 20 μm. Quantification data are shown in terms of mean ± s.e.m.
Lung squamous cell carcinomas resemble foregut squamous epithelia
Given the function of NKX2-1 during lung development (Yuan et al., 2000) and our transcriptional analysis of human tumors, we hypothesized that in the absence of NKX2-1, lung tumor cells lose their lung identity and consequently acquire alternate differentiation programs associated with their histologic classification as SCCs and MADs. We reasoned that the tumor cell identities encountered in lung SCCs are a result of the re-specification of lung cells into those of other organs normally composed of squamous gut epithelia, such as the esophagus or head & neck epithelium. Indeed, we found robust PAX9 expression (a marker specific for esophageal epithelium that is not present in other squamous epithelial tissues or in normal lung) (Peters et al., 1998) within lung SCCs (Fig. 1D and Fig. S3A–D). Additionally, consistent with previous studies, we found that SCCs were positive for squamous markers SOX2, CK1, CK6, CK14, and p63, and confirmed that they were immunohistochemically negative for NKX2-1 (n = 54/54) (Fig. 1D). Thus, we find evidence for lineage plasticity in which lung tumor epithelial cells assume cell fates reminiscent of those of neighboring gut organs, implying some form of conversion of one endodermal cell type into that of a nearby developmental neighbor. Presumably, this occurs through dedifferentiation and redifferentiation or through direct transdifferentiation of cell types.
Mucinous adenocarcinomas resemble midgut and hindgut epithelia
Since our gene expression data suggested that MADs expressed markers of many distinct gut organs, we wondered whether these lineage-specific markers were uniformly expressed within the same tumor cells, and thus not reflective of normal cell identities encountered in development, or whether the markers were distinctly expressed within subpopulations of tumor epithelial cells, reminiscent of their normal gut epithelial counterparts located in the stomach, pancreas, duodenum, liver, and intestine. Different regions of MADs within a single tumor were positive for TFF2, PRSS1, MUC6, HNF4α, PDX1, CDX2, and SOX9 in an organized combinatorial manner reflective of the expression patterns seen in normal gut epithelia (Fig. 1E). Additionally, MADs exhibited diverse differentiation programs with multiple types of alternately fated cells present within single tumors (Fig. 1E). We quantified the number of tumors that were positive for markers specific for stomach, duodenum, and intestine (>1% positive of total tumor cells). We found that 100% of these tumors expressed gastric cell specific markers, whereas duodenal and intestinal cell specific markers were expressed in 78.2% and 30.4% of tumors, respectively. Of the total 23 MAD tumor specimens analyzed, we found that gastric-like tissues (present in 23/23 samples) were the predominant type (81% of total tumor area) whereas duodenum-like (present in 18/23 samples), and intestine-like tissues (present in 7/23 samples) constituted about 16% and 3%, respectively, of the total tumor area (Fig. 1F).
Intriguingly, we were able to identify numerous regions in which a contiguous tumor epithelium transitioned from PDX1+ CDX2− to PDX1+ CDX2+ (Fig. 1E). Such an ordered epithelial transition is similar to the histologic transition seen as the embryonic distal stomach epithelium transitions into the intestinal epithelium (Fig. S2C) (Wells, 2015). Of note, the mid/hindgut specific markers we tested here are not expressed in normal human lungs (Fig. S2D). Taken together, our results indicate that NSCLCs without NKX2-1 expression have lost their lung identity and transformed into cells that reflect other organ lineages; namely, SCCs resemble the esophagus, whereas MADs resemble midgut/hindgut epithelial tissues.
Alveolar cells, but not airway cells, convert into alternate gut-like cell fates after loss of the lung lineage-specifying transcription factor Nkx2-1
To better understand the molecular mechanism underlying the role of developmental regulators in NSCLC tumor subtype heterogeneity, we generated 12 inducible genetic murine models that allowed the production of various combinations of Nkx2-1 loss of function alleles, Sox2 overexpression alleles, and a gain of function oncogenic Kras allele in either the airway or the alveoli (Table S1). To begin, we specifically deleted Nkx2-1 in lung airway cells (Sox2-creER; Nkx2-1f/f, hereafter referred to as Sox2-Nkx2-1f/f). Two weeks after tamoxifen administration, we observed extensive mucous differentiation in the airway, as demonstrated by reactivity to Alcian blue staining (Fig. 2A). We found efficient deletion of Nkx2-1 in the airway (77% ± 4.9 deleted; Fig. 2B). Similarly, we deleted Nkx2-1 in alveolar type 2 progenitor cells (Sftpc-creER; Nkx2-1f/f, hereafter referred to as Sftpc-Nkx2-1f/f) of an otherwise normal mouse (Fig. 2C). Subsequent histological analysis similarly revealed extensive mucous differentiation in alveoli (Fig. 2C) with high-efficiency Nkx2-1 deletion (96.7% ± 2.2 deleted; Fig. 2D). This is in line with prior reports where Nkx2-1 was deleted specifically in airway club cells or ubiquitously (Maeda et al., 2012; Snyder et al., 2013). Intriguingly, the alveoli of Sftpc-Nkx2-1f/f mice (n = 4) demonstrated remarkable plasticity even in the absence of an oncogenic stress, as evidenced by the expression of gut lineage specific transcription factors such as PDX1 and HNF4α along with the associated gut differentiation marker TFF2 (Fig. 2E). In contrast, the airways of Sox2-Nkx2-1f/f mice (n = 3) resisted lineage plasticity and expressed markers characteristic of lung airway mucous cells such as MUC5AC, revealing that different cell types exhibit differing degrees of plasticity in the absence of lineage-specifying transcription factors. In alveoli, quantitative analysis indicated that almost all cells which lost Nkx2-1 had changed their cell fate into alternate gut tissues, as demonstrated by the expression of HNF4A (Fig. 2C and E). We confirmed the absence of mucous differentiation and expression of gut lineage markers in normal lung airway and alveoli (Fig. 2F). In aggregate, lung alveolar cells, but not airway cells, converted into tissues that resemble multiple distinct gut lineages after loss of Nkx2-1; however, no tumors formed.
Concurrent loss of Nkx2-1 and oncogene activation leads to the acquisition of midgut and hindgut-like cell fates in lung MADs
Activating Kras mutations are frequently observed in human MADs (Shim et al., 2015), and loss of Nkx2-1 coupled with mutant Kras activation has previously been shown to drive the production of MADs in mice using Scgb1a1 secretory cell promoter-driven Cre or a ubiquitous Rosa26 promoter-driven CreER (Maeda et al., 2012; Snyder et al., 2013). To systematically dissect whether the loss of lung identity (through deletion of NKX2-1) in an oncogenic environment will result in adenocarcinomas that resemble histological and molecular features of multiple neighboring gut organs, we generated mouse models to concomitantly delete NKX2-1 and to constitutively express mutant Kras in pan-airway epithelial cells or specifically in alveolar type 2 cells. Thus, we generated Sox2-creER; KrasLSL-G12D/+; Nkx2-1f/f mice (specific to airway epithelia in the lung, hereafter referred to as Sox2-Kras-Nkx2-1f/f) and Sftpc-creER; KrasLSL-G12D/+; Nkx2-1f/f mice (specific to alveolar type 2 cells, hereafter referred to as Sftpc-Kras-Nkx2-1f/f). In these mice, tamoxifen administration concomitantly triggers a homozygous deletion of Nkx2-1 and simultaneously activates oncogenic KrasG12D. We also generated the corresponding control mouse lines with wildtype Nkx2-1 alleles (Sox2-creER; KrasLSL-G12D, and Sftpc-creER; KrasLSL-G12D, hereafter referred to as Sox2-Kras and Sftpc-Kras, respectively).
One month after tamoxifen administration, the lungs of Sox2-Kras (n = 3) mice displayed hyperplasia with no evidence of lineage conversion, indicated by the lack of HNF4a and PDX1 expression (Fig. 3A). Thus, an oncogene alone does not result in lineage plasticity. However, with combined oncogene activation and lineage-specific transcription factor modulation, Sox2-Kras-Nkx2-1f/f mice (n = 4) developed MAD-like nodules that contain cells positive for alternate gut lineages including TFF2, HNF4α and PDX1 (Fig. 3B). This result stands in contrast to the situation in which Nkx2-1 deletion alone in the otherwise normal airway does not lead to the expression of alternate gut markers. We speculate that proliferation engendered by Kras activation may foster plasticity, but other oncogene-specific effects are equally likely to be at play in engendering alternative cell fate acquisition. Consistent with previous findings, in the alveoli, Sftpc-Kras mice (n = 6) presented with ADC-like nodules that contain cells positive for lung markers SFTPC and NKX2-1, while negative for gastrointestinal markers (Fig. 3C) revealing once again that an oncogene alone does not necessarily result in lineage plasticity even when it has the ability to induce tumors. In contrast, in the setting of oncogenic and ontogenetic transcription factor modulation, alveoli with concurrent oncogenic Kras and Nkx2-1 deletion (n = 4) were replete with MAD-like nodules that expressed TFF2, HNF4α and PDX1 (Fig. 3D). Of note, Nkx2-1 deletion and Kras activation did not cause a cellular conversion of epithelial lineages into mesenchymal or endothelial lineages (as assessed by the expression of Fibroblast Specific Protein (FSP1) and CD31, respectively, in YFP+ lineage-traced cells) (Fig. 3E). Thus, in both airway and alveoli, oncogenic Kras alone does not elicit lineage plasticity, but concurrent deletion of Nkx2-1 and mutant Kras expression results in lineage transformation towards gastrointestinal lineages. To assess whether loss of Nkx2-1 has any effect on the growth properties of these tumor cells, we performed immunofluorescence analysis for the proliferation marker Ki67 and found that there is a modest but statistically insignificant increase in the number of proliferating cells in mice with mutant Kras activation combined with Nkx2-1 loss as compared to mice with mutant Kras activation alone (14% ±2.05 in Kras vs 19.6% ±3.6 in Kras-Nkx2-1f/f; p >0.05) (Fig. 3F).
Figure 3. Concurrent loss of Nkx2-1 and oncogene activation leads to acquisition of mid/hindgut-like cell fates in lung mucinous adenocarcinomas.

A, Immunostaining on sections from Sox2-Kras mice (n = 3). Alcian Blue and Fast Red staining (left). Immunofluorescence for TFF2 (green) and SCGB1A1 (red) (middle), HNF4α (green), PDX1 (red), and NKX2-1 (white) (right). B, Immunostaining on sections from Sox2-Kras-Nkx2-1f/f mice (n = 4). Alcian Blue and Fast Red staining (left). Immunofluorescence for TFF2 (green) and MUC5AC (red) (middle), HNF4α (green), PDX1 (red), and NKX2-1 (white) (right). C, Immunostaining on sections from Sftpc-Kras mice (n = 6). Alcian Blue and Fast Red staining (left). Immunostaining for TFF2 (green) and SFTPC (red) (middle), HNF4α (green), PDX1 (red), and NKX2-1 (white) (right). D, Immunostaining on sections from Sftpc-Kras-Nkx2-1f/f mice (n = 4). Alcian Blue and Fast Red staining (left). Immunostaining for TFF2 (green) and MUC5AC (red) (middle), HNF4α (green), PDX1 (red), and NKX2-1 (white) (right). Nuclei, DAPI (blue). Scale bars, 20 μm. E, Immunostaining on sections from Sox2-Kras-Nkx2-1+/+/LSL-YFP mice for YFP/GFP (green), CD31 (red), and FSP1 (purple). Nuclei, DAPI (blue). F, Quantification of Ki67+ proliferating cells among total DAPI+ cells in Sftpc-Kras (blue) (n = 3) and Sftpc-Kras-Nkx2-1f/f (green) (n = 3) mice. The proportion of Ki67+ cells was not significantly different between the two genotypes (two-sided t test, P > 0.05). Quantification data are shown in terms of mean ± s.e.m. See also Figure S4.
The above mice perish after 1 month. To assess long term phenotypes in tumors, we intra-nasally administered adenovirus containing the cre recombinase gene (Ad-Cre) to Kras-Nkx2-1f/f mice (n = 8) which results in the modulation of Nkx2-1 and Kras in a smaller subset of cells. Three months after adenoviral administration, as in prior reports (Maeda et al., 2012; Snyder et al., 2013), we observed numerous MAD-like nodules throughout the lungs (Fig. S4A). Once again, marker analysis of midgut and hindgut proteins revealed the presence of subpopulations of tumor epithelial cells reminiscent of their normal gut epithelial counterparts located in the stomach, pancreas, duodenum, and intestine (Fig. 3 and Fig. S4A).
Loss of Nkx2-1 and gain of Sox2 induces lung squamous cell carcinomas without the need for additional oncogenic stimulus
We next sought to test whether ontogenetic modulation similarly regulates the formation of SCCs. Since SOX2 is frequently amplified in human SCCs, we tested whether overexpression of the foregut lineage specifying transcription factor SOX2 was sufficient to induce squamous transformation in the lung. Indeed, mice treated with adeno-cre virus to cause Nkx2-1 loss and Sox2 gain (n = 3) developed SCCs, which expressed CK5, CK14, p63, and CK6 (Fig. S4B–D). In order to define the cell of origin of these squamous cell cancers, we first generated inducible mouse models to ectopically and concomitantly express Sox2 and GFP in lung airway cells (Sox2-creER; Rosa26R-LSL-Sox2-IRES-GFPf/+), hereafter referred to as Sox2-SIGf/+. To assess the earliest changes that occur after Sox2 ectopic expression, we isolated lungs from Sox2-SIGf/+ mice (n = 4) 30 days post tamoxifen administration. Histological analysis of lungs derived from Sox2-SIGf/+ revealed no significant changes in morphology or cellular composition (Fig. 4A–B). We reasoned that the lack of SCC formation following Sox2 ectopic expression could be due to the presence of NKX2-1, which was maintaining the lung cell identity. We therefore generated Sox2-SIGf/+-Nkx2-1f/f mice (n = 3), with which we could concomitantly delete Nkx2-1 and ectopically express Sox2. To our surprise, no lineage plasticity occurred, and no SCCs were generated 30 days after administering tamoxifen (Fig. S4E and I). Instead, airways were enriched for FOXJ1+ ciliated cells and depleted of SCGB1A1+ secretory club cells (Fig. S4E and I). Reasoning that human lung SCCs exhibit extremely high copy number amplifications in the SOX2 genomic locus (Fig. S4G), we then generated Sox2-SIGf/f-Nkx2-1f/f mice (n = 8) (Fig. 4C), homozygous for the SIG allele. In this setting, we indeed observed large lung SCCs in 6 out of 8 mice, which were positive for esophageal and forestomach squamous markers, including CK6, CK14, p63 and PAX9 (Fig. 4C–D and Fig. S4H). No evidence of a conversion towards mesenchymal or endothelial lineages was observed (Fig. 4E). Thus, we have generated a mouse model of squamous cell cancer solely by modulating the expression of lineage-specifying transcription factors.
Figure 4. Loss of Nkx2-1 and gain of Sox2 induces conversion of lung epithelium into esophageal-like squamous epithelium in lung squamous cell carcinoma.

A, Staining on sections from Sox2-SIGf/+ mice (n = 4). Hematoxylin and eosin staining (left). Immunofluorescence for GFP (green), FOXJ1 (red) and CK6 (white) (middle), GFP (green), SCGB1A1 (red), and AcTub (white) (right). B, Quantification of GFP+ cells in Sox2-SIGf/+ (n = 3) lungs. Ciliated cells (blue), secretory cells (gray), squamous cells (orange), and all other cells (navy). C, Staining on sections from Sox2-Nkx2-1f/f-SIGf/f mice (n = 8 mice). Hematoxylin and eosin staining (left). Immunostaining for GFP (green) and CK6 (red) (middle), SOX2 (green), CK6 (red), and NKX2-1 (white) (right). D, Quantification of GFP+ cells in Sox2-Nkx2-1f/f-SIGf/f (n = 7; right) lungs. Ciliated cells (blue), secretory cells (gray), squamous cells (orange), and all other cells (navy). E, Immunostaining on sections from Sox2-SIGf/f-Nkx2-1f/f mice for YFP/GFP (green), CD31 (red), and FSP1 (purple). Nuclei, DAPI (blue). F, Tumors derived from subcutaneous grafts were stained for SOX2 (red), GFP (green), and KRT14 (purple). G, Quantification of Ki67+ proliferating cells among total DAPI+ cells. Sox2-Nkx2-1f/f-SIGf/f mice had significantly more Ki67+ cells than Sox2-Nkx2-1f/f mice (two-sided t test, *P < 0.05). H, Immunostaining on sections from Sftpc-SIGf/+ mice (n = 3). Hematoxylin and eosin staining (left). Immunostaining for GFP (green), FOXJ1 (red) and CK6 (white) (middle), GFP (green), SCGB1A1 (red), and AcTub (white) (right). I, Quantification of GFP+ cells in Sftpc-SIGf/+ (n = 3) lungs. Ciliated cells (blue), secretory cells (gray), squamous cells (orange), alveolar type II (AT2) cells (red), and all other cells (navy). J, Immunostaining on sections from Sftpc-Nkx2-1f/f-SIGf/f mice (n = 4). Hematoxylin and eosin staining (left). Immunostaining for GFP (green) and CK6 (red) (middle), SOX2 (green), CK6 (red), and NKX2-1 (white) (right). K, Quantification of GFP+ cells in Sftpc-Nkx2-1f/f-SIGf/f (n = 4) lungs. Ciliated cells (blue), secretory cells (gray), squamous cells (orange), alveolar type II (AT2) cells (red), and all other cells (navy). Insets show the white boxed regions at higher magnification. Nuclei, DAPI (blue). Quantification data are shown in terms of mean ± s.e.m. Scale bars, 20 μm. See also Figure S4.
We next isolated GFP+ cells from our Sox2-SIGf/f-Nkx2-1f/f mice and subcutaneously grafted them into immunodeficient Nu/Nu mice (n = 3). Transplanted cells made visible tumors within one month in all mice. These tumors morphologically and molecularly resembled primary squamous cell carcinomas, indicating that these tumors contained tumor-propagating cells which have the characteristics of SCCs (Fig. 4F). Through quantitative analysis of Ki67 expression we found that there is a significant increase (31% ±1.9 SIGf/f-Nkx2-1f/f vs 17% ±2.62 in SIGf/f mouse models; P< 0.05) in the number of proliferating cells, indicating that the loss of Nkx2-1 alters not only lung cell identity, but also increases tumor cell propagation (Fig. 4G). Taken together, our results demonstrate that loss of the lung lineage-specifying transcription factor NKX2-1 coupled with high levels of the foregut-specifying transcription factor SOX2 is sufficient to drive the conversion of lung epithelial cells into foregut-like squamous tissues.
To similarly understand whether the foregut specifying transcription factor SOX2 could affect the transdifferentiation of type 2 alveolar cells into squamous tumor cells, we generated inducible mouse models to ectopically express Sox2 in alveolar cells (Sftpc-creER; Rosa26R-LSL-Sox2-IRES-GFPf/+) hereafter referred to as Sftpc-SIGf/+ (n = 4). We also generated Sftpc-SIGf/+-Nkx2-1f/f mice (n = 5) and Sftpc-SIGf/f-Nkx2-1f/f mice (n = 6) to assess the restraining effect of NKX2-1 presence on lineage plasticity.
In Sftpc-SIGf/+ mice, we noticed lung ADCs with cells expressing markers of airway epithelium, demonstrating that alveolar cells can adopt an airway fate. However, no lineage conversion into alternate gut organ cell fates was evident (Fig. 4H and I). We speculated that the appearance of ADCs following foregut transcription factor misexpression, similar to findings in other recent studies (Lu et al., 2010), was again due to the continued presence of the lung lineage specifying transcription factor NKX2-1, preventing lineage plasticity. Therefore, we generated and analyzed Sftpc-SIGf/+-Nkx2-1f/f mice and Sftpc-SIGf/f-Nkx2-1f/f mice. Interestingly, despite the lack of NKX2-1, squamous differentiation occurred only in a minority of cells within the resulting tumors (Fig. 4J and K and Fig. S4F and J), in contrast to the results seen in the airway epithelium (Fig. 4A and B). The remaining non-squamous cells in the alveoli did not express alveolar markers, perhaps indicative of an undifferentiated or transitional cell state. Thus, unlike airway cells, alveolar type 2 cells were less likely to undergo lineage conversion into squamous epithelial cells. We consequently infer that different cells of origin have differing propensities for lineage transformation during tumorigenesis, even when subjected to the same oncogenic stress and ontogenetic modulation.
Nkx2-1 loss induces tumor cell lineage transformation independent of stromal cells
Both normal and tumor cells incorporate inputs from multiple sources for their growth and maintenance. We wondered whether the lineage conversion phenotype following Nkx2-1 loss required inputs from stromal cells in the lung. To address this, we isolated EpCAM+ cells from mouse lungs (a population that includes both airway and alveolar cells) from Sox2-Kras, Sox2-Kras-Nkx2-1f/f, Sox2-SIGf/+, and Sox2-SIGf/f-Nkx2-1f/f mice and expanded them in airway epithelial cell culture medium (SAGM+) as previously described (Mou et al., 2016). Cultured cells expressed Sox2, p63, and Krt5, indicative of the growth of airway basal cells. We then infected these cells with Adeno-cre-GFP virus to activate or to delete specific genes. Infected cells were FACS sorted and then mixed in 50% Matrigel (1:1 volume) to perform organoid culture assays without any feeder cells present (Fig. 5A). We then collected organoids on day-12 and performed immunofluorescence analysis for SCC and MAD markers. Marker analysis indicated that cultured cells expressed markers of SCC and MAD in the respective genotypes but only when Nkx2-1 is deleted (Fig. 5B–C). This data indicates that lineage conversion occurs ex vivo in tumor organoids in a process that does not require stromal cells.
Figure 5. Concurrent loss of Nkx2-1 and gain of oncogenes results in conversion of lung epithelium into foregut-like or mid/hindgut-like tissues in organoid cultures independent of stromal cells.

A, Schematic representation of the isolation and organoid culture of lung epithelial cells from Sox2-creER/SIGf/f::Nkx2-1f/f and Sox2-creER/KrasG12D::Nkx2-1f/f mice. B, Immunostaining for mid/hindgut markers KRT20 (green), HNF4A or SOX9 (red), and lung epithelial marker Nkx2-1 (gray) on organoid sections derived from Sox2-creER/KrasG12D:Nkx2-1f/f. C, Immunostaining for foregut squamous epithelial markers KRT5 or TP63 (green), SOX2 (red), and lung epithelial marker Nkx2-1 (gray) on organoid sections derived from Sox2-creER/SIGf/f:Nkx2-1f/f. D, Colony forming efficiency of Sox2-Kras and Sox2-Kras/Nkx2-1f/f cells was not significantly different. E, Percentage of Ki67+ cells was significantly higher in Sox2-Kras/Nkx2-1f/f cells than in Sox2-Kras cells (two-sided t test, *P < 0.05). F, Colony forming efficiency of Sox2-SIG and Sox2-SIG/Nkx2-1f/f cells was not significantly different. G, Percentage of Ki67+ cells was significantly higher in Sox2-SIG/Nkx2-1f/f cells than in Sox2-SIG cells (two-sided t test, *P < 0.05). H and I, Quantitative analysis of the size of the organoids derived from SIG and SIGf/f-Nkx2-1f/f (H) and Kras and Kras-Nkx2-1f/f mice (I) (two-sided t test, *P < 0.05). Quantification data are shown in terms of mean ± s.e.m. Scale bars 20 μm.
Nkx2-1 loss enhances oncogene induced tumor growth ex vivo
Our conditional mouse models indicate that the loss of Nkx2-1 influences tumor cell lineage plasticity, and additionally suggests that loss of Nkx2-1 promotes tumor cell replication and progression in vivo in certain contexts (Fig. 4G). To further test this finding ex vivo, we quantified the number and the size of organoids with oncogene activation alone (i.e., Kras or SIGf/f) or in combination with the loss of Nkx2-1 (i.e., Kras-Nkx2-1f/f or SIGf/f-Nkx2-1f/f). Although we did not observe a significant increase in the overall number of organoids (colony forming units) (Fig. 5D and F), we found a significant increase in the number of Ki67+ proliferating cells with concurrent Nkx2-1 loss and oncogene activation as compared to oncogene activation alone (32.6 ±2.8 in Kras-Nkx2-1 vs 13 ±6.4 in Kras; P< 0.05) (40.6 ±6.94 in SIGf/f-Nkx2-1f/f vs 18.3 ±8.99 in SIGf/f alone; P< 0.05) (Fig. 5E and G). Consistent with this data, we also observed a significant increase in the number of organoids that are >500μm in size (66 ±8.6 in Kras-Nkx2-1 vs 22 ±5.9 in Kras alone; P< 0.05) (68.3 ±5.89 in SIGf/f-Nkx2-1f/f vs 36 ±4.18 in SIGf/f alone; P< 0.05) in organoids that suffered a combination of Nkx2-1 loss and oncogene activation as compared to organoids characterized by oncogene activation alone (Fig. 5H–I).
Nkx2-1 loss rewires genomic occupancy of SOX2 and activates a squamous differentiation program
Since the presence of Nkx2-1 restricts Sox2 from driving a squamous differentiation program in the airway epithelium, we hypothesized that the presence or absence of Nkx2.1 might alter Sox2 genomic occupancy. We thus performed Sox2 chromatin immunoprecipitation followed by deep sequencing (ChIP-seq) on SIG Nkx2-1+/+ and SIG Nkx2-1−/− primary lung epithelial cells. A total of 542 genomic regions were consistently bound by Sox2 regardless of Nkx2-1 status, suggesting that these are canonical Sox2 targets in lung epithelial cells (Fig. 6A). Of note, 72 regions were depleted of Sox2 binding upon Nkx2-1 deletion, while 1185 regions were exclusively bound by Sox2 in the absence of Nkx2-1 (Fig. 6A). These results indicate that loss of Nkx2-1 leads to systematic changes in Sox2 binding (Fig. 6B). For instance, we found that Sox2 acquired several new binding sites in the Trp63 locus after Nkx2-1 deletion (Fig. 6C). Trp63 is a key squamous transcription factor that we previously demonstrated to be exclusively expressed in lung SCC but not in ADC or MAD. Some of these new binding sites are present in introns of the Trp63 locus. Interestingly, two intronic enhancers have been well-characterized in the Trp63 gene (Antonini et al., 2015). Furthermore, we identified multiple Sox2 binding peaks specific to SIG Nkx2-1−/− cells in the Slc25a21 locus, which is directly 3′ of to the Pax9 locus (Fig. 6D). Several regions in Slc25a21 have previously been shown to harbor functional Pax9 enhancer activity in multiple species (Chatterjee et al., 2011; Meyertholen et al., 2012; Santagati et al., 2003). We also identified SIG Nkx2-1−/− specific Sox2 binding peaks in Dsc2, Dsc3, and Dsg3 (Fig. S5A–C), which encode squamous-specific cell junction proteins. Interestingly, western blot analysis indicated that loss of Nkx2-1 resulted in a 2-fold increase in the levels of SOX2 protein in SIGf/f-Nkx2-1f/f cells compared to SIGf/f cells (Fig. 6E–F). This finding is consistent with the notion that cell fate is often a function of the stoichiometric ratios of multiple transcription factors. Taken together, these results indicate that Nkx2-1 deletion dramatically alters the binding profile of Sox2 in lung epithelial cells allowing an activation of a squamous differentiation program.
Figure 6. Nkx2-1 deletion enhances SOX2 expression and rewires SOX2 genomic occupancy towards a squamous gene program.

A, Average Sox2 ChIP-seq profiles of common regions (n = 542), SIG Nkx2-1+/+ specific regions (n = 72), and SIG Nkx2-1−/− specific regions (n = 1185). SIG Nkx2-1+/+ signal is marked in blue, while the signal for SIG Nkx2-1−/− is denoted in pink. Data are shown in terms of log2 fold change vs. corresponding IgG ChIP controls. B, Heat map of Sox2 ChIP-seq signal in SIG Nkx2-1+/+ (left) and SIG Nkx2-1−/− (right) treatment conditions. The comparison revealed three clusters of Sox2-bound regions: common regions, SIG Nkx2-1+/+ specific regions, and SIG Nkx2-1−/− specific regions. Data are shown in terms of log2 fold change vs. corresponding IgG ChIP controls. C, Normalized Sox2 ChIP-seq signal in SIG Nkx2-1+/+ (top, blue) and SIG Nkx2-1−/− (bottom, red) treatment conditions at the Trp63 locus. Peak calls specific to SIG Nkx2-1−/− are indicated in black bars and highlighted in yellow. Data have been normalized to millions of reads mapped and are shown in terms of fold change vs. corresponding IgG ChIP controls. D, Normalized Sox2 ChIP-seq signal in SIG Nkx2-1+/+ (top, blue) and SIG Nkx2-1−/− (bottom, red) treatment conditions at putative Pax9 3′ enhancers (Slc25a21). Peak calls specific to SIG Nkx2-1−/− are indicated in black bars and highlighted in yellow. Data have been normalized to millions of reads mapped and are shown in terms of fold change vs. corresponding IgG ChIP controls. e, Western blot analysis for SOX2 (35 kDa) (top row), Nkx2-1 (48 kDa) (middle row), and tubulin (48 kDa, loading control) (bottom row) in lung cells from SIG and Nkx2-1f/f-SIGf/f mice, with or without Cre virus. F, Quantification of SOX2 Western blot signal in (E), normalized to tubulin. Sox2 protein levels were significantly higher in Nkx2-1f/f-SIGf/f cells treated with Cre virus as compared to untreated controls (two-sided t test, **P < 0.01). Nuclei, DAPI (blue). Quantification data are shown in terms of mean ± s.e.m. See also Figure S5.
As transcription factors generally work in multi-factor complexes to drive specific differentiation programs, we wondered whether Nkx2-1 deletion alters the binding partners of Sox2. To explore possible binding partners of Sox2 in the presence and absence of Nkx2-1, we performed motif analysis surrounding each Sox2-bound region. Among the 72 Sox2-bound regions specific to SIG Nkx2-1+/+ cells, we identified enrichment for Sox-family motifs (Fig. S5D). In contrast, the 1185 regions specific to SIG Nkx2-1−/− cells showed strong enrichment of motifs corresponding to transcription factors such as Atf3, Fra1, Batf, AP-1, and Fosl2, as well as Sox3 and Sox2 (Fig. S5E). Of note, Atf3, Fra1, and AP-1 family factors have been previously implicated in squamous carcinomas (Ding et al., 2013; Wu et al., 2010).
To explicitly delineate possible changes in Sox2 binding partners with or without Nkx2-1, we next performed differential motif analysis between SIG Nkx2-1+/+ and SIG Nkx2-1−/− specific regions. Using SIG Nkx2-1−/− specific regions as the comparison control, we found that SIG Nkx2-1+/+ specific regions were enriched for motifs corresponding to RAR and Nkx-family factors Nkx3.2, Nkx2.2, Nkx2.5, and Nkx2.1 (Fig. S5F). This finding suggests that the Sox2 binding sites which are lost upon Nkx2-1 deletion are likely due to the loss of direct interactions between Sox2 and Nkx2-1 at these specific sites. The direct comparison of SIG Nkx2-1−/− regions to SIG Nkx2-1+/+ regions again revealed significant enrichment of numerous transcription factors implicated in squamous transformation, such as Fra1, Jun-AP1, Fosl2, AP-1, and Atf3 (Fig. S5G). Our motif analysis supports the notion that Nkx2-1 normally interacts with Sox2 to restrict squamous differentiation; but in the absence of Nkx2-1, Sox2 interacts with a different set of transcription factors to drive squamous differentiation.
This phenomenon echoes the situation in lung MADs. Using previously published H3K27ac ChIP-seq data in mouse MADs, we also found that Nkx2-1 deletion led to a gain of H3K27ac signal around Cdx2 and Tff2, in addition to the previously reported gain of H3K27ac signal around Hnf4a (Fig. S5H).
Altogether, our data suggest that developmental transcription factors rewire their genomic occupancy depending on the presence or absence of other factors expressed in the lung tumor cells, thereby driving lineage plasticity and subsequent tumor heterogeneity.
Discussion
Herein we have shown that simple combinatorial expression patterns of cardinal developmental regulators can be used to parse different subtypes of lung cancer. Furthermore, we demonstrate that in the absence of the cardinal lung specifying transcription factor NKX2-1, both normal and oncogene-expressing lung epithelial cells adopt features that resemble their developmentally related neighboring gut tissues. Of note, signaling factor modulation in the developing lung has already been show to engender alternate fate choice, setting a precedent for transcription factor-induced “reprogramming” (Okubo and Hogan, 2004). Interestingly, all prior models of lung squamous cell cancer were associated with the downregulation of NKX2-1, suggesting the possibility that the loss of the cardinal lung specifying transcription factor is absolutely required for squamous transformation (Fig. 4). More generally, our findings suggest that in the absence of fate specifiers such as NKX2-1 and SOX2, cells adopt the fates of their neighboring tissues. We speculate that the loss of a lineage-restricting factor such as NKX2-1 allows for a lineage transformation event and that these cells subsequently activate an embryonic gut differentiation program similar to those events that occur during normal gut endoderm regionalization. On occasion, as we have shown, contiguous tumor epithelia are formed in a pattern analogous to their embryonic gut counterparts (Fig. 1E) suggesting that some elements of actual embryonic patterning may be replayed in tumors. That said, regular stereotyped embryonic endodermal regionalization events are not commonplace within tumors, and so a wholesale replay of embryonic patterning does not occur as a default event. However, local nests of cells reminiscent of normal epithelial counterparts suggest that progenitor cells once formed from transfated lung epithelial cells can then further differentiate along the lines that they would normally into ordered epithelial nests. Whether these transformations occur through a dedifferentiation event in which a lung epithelial cell converts into a multipotent gut endodermal progenitor that then re-differentiates into alternative gut cell fates or whether a lung epithelial cell directly transdifferentiates into alternative gut epithelial cell fates remains to be explored. Of note, recent studies have identified that NKX2-1 directly binds to the HNF4a promoter in normal lung epithelial cells indicating that this lung transcription factor may repress alternate fate choices (Snyder et al., 2013). This further suggests that cells may directly transdifferentiate into alternate fates without undergoing dedifferentiation when such programs are de-repressed. In this way, cells might transdifferentiate from a lung fate into their developmentally nearest neighboring tissue fates (such as esophageal or gastric or intestinal) depending upon which transcription factor program happens to exert itself. We speculate that another possibility for such restricted plasticity could be due to chromatin mediated epigenetic mechanisms (Kim et al., 2014). These findings are in line with the metaphorical framework laid out by Conrad H. Waddington to explain developmental fate decisions (Waddington C.H., 1957). Although our data suggests that transfated lung cells remain endodermal in our models, it remains possible that further plasticity may occur in vivo or at later time points perhaps due to further mutation or specific tumor microenvironments.
We also find that oncogenes facilitate the ability of developmental regulators to drive lineage conversion, but canonical oncogenes themselves do not engender lineage plasticity on their own. Though we show that MADs can be generated from differing cells of origin within the lung, airway cells are much more likely than alveolar cells to give rise to SCCs after Nkx2-1 loss and Sox2 overexpression. Thus, the cell of origin does indeed constrain plasticity in tumorigenesis. Our data thus indicates that while ontogenic factors such as Nkx2-1 and Sox2 are critical nodes in the regulation of lung squamous transformation, the cell of origin also places significant constraints on tumor plasticity, perhaps by providing differing epigenetic contexts for these ontogenic modulations. Furthermore, our data demonstrate that lineage-specifying transcription factors not only rewires transcriptional networks but also alters the dosage of the other transcription factors (in this case SOX2). Indeed, we found that the dosage of a lineage regulator influences its ability to induce lineage conversion, which has obvious implications for the importance of copy number variation in engendering plasticity.
We note that developmentally defined subtypes of tumors, such as lung MADs, are shown to be correlated with survival. We speculate that this increased mortality may be caused by various forms of resistance to therapy that are predicated upon tumor plasticity. A similar prognostic association has been demonstrated with CDX2− tumors in human colon cancer (Dalerba et al., 2016). Remarkably, when multiple solid tumors lose their respective cardinal lineage specifying factors, the tumors begin to express markers of developmentally related lineages (Fig. S6A–D). This suggests that the plasticity we have demonstrated here in lung tumors may be broadly applicable to tumors at large and that ontogenetic pathways may frequently be repurposed during tumorigenesis, and that this results in tumor heterogeneity and possibly increased resistance. Future studies in mouse and human models should demonstrate whether and how the remarkable plasticity we have observed here can be invoked by tumors to evade therapy.
CONTACT FOR REAGENTS AND RESOURCE SHARING
Further information and requests for resources and reagents should be directed to and will be fulfilled by the Lead Contact, Purushothama Rao Tata (purushothamarao.tata@duke.edu)
EXPERIMENTAL MODELS AND SUBJECT DETAILS
Animal Studies
Sox2-creER(Arnold et al., 2011), Sftpc-creER(Rock et al., 2011), R26-LSL-Sox2-IRES-GFP(Xu et al., 2014), KRASLSL-G12D (JAX 008179), and Nkx2-1fl/fl(Kusakabe et al., 2006) mice were previously described. Corn oil or tamoxifen (2 mg per day) was intraperitoneally injected for five consecutive days to induce the cre-mediated recombination. For all genetic modulations that were driven by Sftpc-creER, we injected 1 dose of tamoxifen (0.1mg/20gram body weight), due to a higher sensitivity of this strain to the compound. Adeno-cre-GFP virus (purchased from Signagen (Cat.No. SL100706)) was infected as described previously (DuPage et al., 2009). A mixed population of male and female 6–12-week-old mice were used for both control and treated animals. Mice were sacrificed 30 days after the last tamoxifen injection and we analyzed at least 3–7 mice in each experiment as indicated in the relevant sections of the results and figure legends and all the experiments were repeated at least three times. All procedures and protocols were approved by the MGH Subcommittee on Research Animal Care in accordance with NIH guidelines.
METHOD DETAILS
Tissue preparation, immunohistochemistry, and immunofluorescence
Human primary lung tumors analyzed in this study were collected following institutional IRB approval. Mouse lungs were inflated and fixed in 4% paraformaldehyde for 5 hours at 4°C, washed with PBS, and transferred to a 30% sucrose solution overnight. For immunofluorescence, tissues were embedded in OCT and cryosectioned as transverse 5 μm thick sections. Cryosections were stained with the previously described protocol(Tata et al., 2013). Briefly, cryosections were permeabilized with 0.1% Triton X-100 in PBS, blocked in 1% BSA for 30 min at room temperature (27°C).
The following antibodies were used: goat anti-CC10 (1:200; sc-9772, Santa Cruz Biotechnology), rabbit anti-CDX2 (1:100; 12306S, Cell Signaling Technology), rabbit anti-CK1 (1:400; PRB-149P, Covance), mouse anti-CK14 (1:400; ab7800, Abcam), rabbit anti-CK5 (1:1000; ab53121, Abcam), rabbit anti-CK6 (1:500; ab24646, Abcam), rabbit anti-CPS1 (1:400; ab3682, Abcam), goat anti-FOXA2 (1:250; sc6554, Santa Cruz Biotechnology), mouse anti-FOXJ1 (1:500; 14-9965, eBioscience), chicken anti-GFP (1:500; GFP-1020, Aves Labs); goat anti-GFP (1:100; NB-100-1770, Novus Biologicals), goat anti-HNF4α isoform 7–9 (1:250; PP-H6939-00, R&D Systems), rabbit anti-MUC2 (1:200; sc-15334, Santa Cruz Biotechnology), mouse IgG1 anti-MUC5AC (1:250; MS-145, Thermo Scientific), goat anti-MUC6 (1:200; sc-16914, Santa Cruz Biotechnology), mouse IgG1 anti-MUC6 (1:200; MUC-6-CE-S, Leica Biosystems), rabbit anti-NKX2-1 (1:500; ab76013, Abcam), mouse IgG2a anti-p63 (1:100; 790-4509, Ventana), rat anti-PAX9 (1:500; ab28538, Abcam), goat anti-PDX1 (1:200; AF2419, R&D Systems), sheep anti-PRSS1 (1:250; AF3848, R&D Systems), goat anti-SOX2 (1:200; AF2018, R&D Systems), goat anti-SOX9 (1:200; AF3075, R&D Systems), and rabbit anti-TFF2 (1:400; 13681-1-AP, ProteinTech). All secondary antibodies were Alexa Fluor conjugates (488, 594 and 647) and used at 1:400 dilution (Life Technologies).
Organoid cultures
Lung epithelial cells were isolated from KrasLSL-G12D/+ mice, KrasLSL-G12D/+; Nkx2-1f/f mice, SIGf/f mice, and SIGf/f-Nkx2-1f/f mice and cultured as previously described (Mou et al., 2016). Cells were infected with Adeno-cre virus (Signagen laboratories, Cat# SL100706) to activate KrasG12D or SOX2 and to delete Nkx2-1. Cells were trypsinized, counted and mixed in matrigel (50% volume/volume) (at a density of 1000 cells per well) and cultured for 12 days. On Day12, organoids were fixed with 4% PFA for 1 hour at room temperature. Colony forming efficiency (CFE) was measured by counting total numbers of organoids. Fixed organoids were washed in 2X PBS for 10 mins each and incubated in 30% Sucrose overnight and embedded them in O.C.T and sectioned.
Cell culture and subcutaneous transplantation
EpCAM+ cells from mouse lungs (including both airway and alveolar cells) were isolated and subsequently cultured in airway epithelial cell culture medium (SAGM+) as previously described (Mou et al., 2016). Briefly, the lungs and airway tissues are dissected and immediately placed into a petri dish containing sterile cold PBS to wash away blood and to remove connective tissue. The tissues were then transferred to another dish and minced using sterile surgical knives to generate small pieces. The tissue pieces were transferred to a 10 ml tube and the tissue pellets were washed with cold PBS. After removal of PBS, the tissue pieces were re-suspended in Dissociation Medium (1 U/ml Pronase, 400 U/ml Collagenase Type I, 0.5 mg/ml DNase I, 10 μM Y-27632, 100 units/ml Penicillin- Streptomycin in DMEM/F12). The digestion was performed at 4°C with gentle rocking for 12 hours or at 37°C for 1–2 hours with frequent agitation. After digestion, DMEM + 10% FBS was added, and tissue clumps were disrupted by vigorously pipetting followed by filtering through a 100 μm strainer. The cells were then washed at least 2 times with DMEM + 10% FBS. Small Airway Epithelial Cell Basal Medium (SAGM, Lonza) containing 10μM ROCKi, 1 μM A8301, 1 μM DMH-1 and 1 μM CHIR99021 was used to culture and expand lung epithelial cells. Cultured cells expressed Sox2, p63, and Krt5, pointing to an outgrowth of airway basal cells. Lung epithelial cells from SIGf/f-Nkx2-1f/f mice were cultured and infected with Adeno-cre virus (Signagen laboratories, Cat# SL100706) to activate SOX2 and to delete Nkx2-1. Cells were harvested five days following viral infection and subcutaneously injected into nude (Nu/Nu) mice. 3×10⁵ cells were mixed with 6×10⁵ fibroblasts and matrigel (50%) were injected subcutaneously into nude mice. Tumors were harvested on day-30 following transplantation.
Chromatin Immunoprecipitation and sequencing
Chromatin immunoprecipitation was carried out as described previously with minor modifications (Saladi et al., 2017). Briefly, cultured cells were cross-linked with 2 mM EGS (Ethylene Glycol-bis (Succinimidylsuccinate)) in PBS for 30 minutes at room temperature followed by cross-linking with 1% (v/v) formaldehyde at room temperature for 15 minutes. 125 mM glycine was added to stop cross-linking. Cells were then lysed in RIPA buffer for 1–2 hr at 4°C. Nuclear lysates were sonicated 5 min for 8 times in a Bioruptor (Diagenode). Sonicated chromatin was precleared with Protein G Sepharose beads (GE Healthcare) pre-blocked with BSA and sonicated salmon sperm DNA (15632-011, Invitrogen). Samples were incubated with 2μg antibody (SOX2, IgG) for overnight at 4°C followed by incubation with beads for additional 4 hrs. Immunoprecipitated beads were washed in wash buffer 1 (containing 150 mM NaCl), wash buffer 2 (containing 500 mM NaCl), wash buffer 3 (containing 250 mM LiCl). After the wash, beads were incubated for 3 hrs at 55°C, then overnight at 65°C in TE buffer containing, SDS, RNase A, and Proteinase K. DNA was purified via Qiaquick PCR purification kit (28106, Qiagen) as per manufacturer’s instructions. PCR was performed using IQ SYBR Green Supermix reagent (Bio-Rad) in a MX300P machine (Stratagene). Percentage of input from the IPs was calculated by using 10% as standard. Libraries were preparation using the NEBNext Ultra DNA Library Prep Kit with manufacturer’s instructions. 11 cycles were used for the library amplification. Compatible barcodes #1–12 from illumina were used. Single end 50bp sequencing was done on HiSeq 2000 using TruSeq V3 High-output kits.
Microscopy
Images were obtained using Olympus IX81 Inverted microscope (Olympus). Confocal images were obtained with a Nikon A1 confocal laser-scanning microscope with a 40× or 60× oil objective (Nikon CFI Plan APO VC 40× or 60× Oil) or Olympus Fluoview FV3000 confocal laser-scanning microscope with a 20X or 40X objective. Cells were manually counted based on immunofluorescence staining of markers for each of the respective cell types. Serial sections were stained for the antibodies tested and randomly selected slides were used for cell counting.
Western blot analysis
Cells were lysed in lysis buffer (50 mM Tris/HCl, pH 7.5, 150 mM NaCl, 1% Triton X-100, 2 mM EDTA, 2 mM DTT and complete proteinase inhibitors (Roche)) for 30 min at 4°C and centrifuged at 13000rpm for 15min. Protein concentrations were quantified by Bradford assay. We then added 4x sample buffer and boiled at 95°C for 10min. For immunoblotting, samples were loaded on 10% polyacrylamide gel and run until the appropriate protein separation was achieved. Samples were transferred onto the PVDF membrane, blocked for 1 hour in 5% non-fat milk in TBST (Tris-buffered saline + 0.1% Tween-20). The membranes were then incubated overnight at 4°C with the following primary antibodies: anti-Sox2 (R&D), anti-Nkx2-1 (Abcam) and Tubulin (Proteintech). After incubation with primary antibodies, the membranes were washed 3× in TBST then incubated with the appropriate HRP-labeled secondary antibody in TBST for 1 hour at room temperature. Membranes were then washed 3× with TBST then developed with regular ECL (Thermo Scientific). The intensity of individual bands was quantified using ImageJ.
Computational Analysis
Analysis of NSCLC data from TCGA
The results published or shown here are in whole or part based upon data generated by the TCGA Research Network: http://cancergenome.nih.gov/. Normalized gene-level expression data for lung squamous carcinoma (n = 501) and lung adenocarcinoma (n = 518) were obtained from the GDAC Firehose (http://gdac.broadinstitute.org) on September 27, 2015. Data were then log2 transformed prior to further analysis. High/low thresholds for NKX2-1 and SOX2 expression were determined in an unbiased fashion by calculating the best-fit step function for each gene(Sahoo et al., 2007). The advantage of this method (as opposed to using the mean or median) is that the best-fit step function explicitly identifies the optimal value for partitioning expression values for a particular gene into high/low groups. These thresholds were then used to classify lung tumors into four groups, as shown in Fig. S1A.
Principal component analysis was performed in R, and the first two principal components were visualized with the ggbiplot library. Differential gene expression analysis was performed using limma(Ritchie et al., 2015). Differentially expressed genes were defined as having a Benjamini-Hochberg corrected p-value < 0.05 and log fold change ≥ 1. A subset of these differentially expressed genes was selected for the heat maps in Fig. 1B and Fig. S1B. In both cases, expression values for each gene were first scaled to z-scores. For Fig. 1B, the z-scores of each group were then averaged for final representation in the heat map; the un-averaged z-scores are shown in Fig. S1B. Complete linkage clustering of genes and NSCLC groups was performed using the Euclidean distance metric.
Gene expression in normal human tissues
Select genes that were differentially expressed across the 3 NSCLC subtypes were then evaluated for expression in normal human tissues. Normalized RNA-seq expression data derived from a variety of human tissue samples (n = 5347) was obtained from GTEx (http://gtexportal.org) on September 17, 2015.
Survival analysis
Overall survival times for NSCLC patients (n = 865) in the TCGA database were collected from the GDAC Firehose (discrepancies in the number of patients is because follow-up times were not available for all patients in the RNA-seq dataset). Kaplan-Meier survival curves were created in R. Statistical significance of differences in overall survival rates among the NSCLC groups was assessed by log-rank test.
ChIP-Seq analysis
Raw fastq reads were aligned to the mm10 genome using Bowtie v2.2.9 (Langmead and Salzberg, 2012), allowing for one mismatch in the seed region (−N 1), and converted to bam files using Samtools v1.4 (Li et al., 2009). Peaks and summits were then called using the callpeak function in MACS2 v2.1.1 (Zhang et al., 2008), with an extension size of 200. Differential binding between experimental conditions was performed using the bdgdiff function in MACS2 with a gap distance of 60bp and a minimum region length of 120bp. Normalized fold enrichment tracks were generated by using the callpeak function with the -SPMR flag and a 200bp extension size, then passing the bedgraph outputs into the bdgcmp function with the setting -m FE (fold enrichment). ChIP-seq average signal plots and clustered heatmaps were generated using ngs.plot v2.61 (Shen et al., 2014).
Motif analysis was performed using HOMER v4.8.3 (Heinz et al., 2010). The differentially bound regions identified by MACS2 were used to perform motif enrichment compared to a normalized background using a window size of 200 bp and repeat regions masked. In addition, comparative motif analysis was performed by alternatively setting each of the two treatment conditions as the background control.
H3K27ac ChIP-seq signal tracks in Nkx2-1+/+ and Nkx2-1−/− lung tumors were created using a previously published dataset(Snyder et al., 2013). Peak calls and wig signal tracks were directly obtained from the GSE43252 data repository. Wig signal tracks were converted to bigWig format for visualization.
QUANTIFICATION AND STATISTICAL ANALYSIS
No statistical methods were used to predetermine the sample size. Experiments were performed completely blinded, being repeated by two different investigators. We did not establish any criteria to include or exclude any specific sample or animal from the analysis and no method of randomization was performed. The standard error of the mean was calculated from the average of at least 3 independent lung samples unless otherwise mentioned. A p-value of less than 0.05 was considered significant.
DATA REPORTING AND SOFTWARE AVAILABILITY
All relevant data are available from authors. All the software used in this work are described in the relevant methods sections. The accession number for the ChIP-seq data reported in this paper is GEO: GSE108952.
Supplementary Material
Highlights.
A framework for considering tumor plasticity through the lens of normal development
Loss of Nkx2.1 leads to the acquisition of gut fates in mucinous adenocarcinoma
A model of lung squamous cancer driven solely by transcription factor modulation
Loss of Nkx2-1 rewires Sox2 genomic occupancy towards a squamous program
Acknowledgments
We thank Konrad Hochedlinger for sharing Sox2-creER mice and Brigid Hogan for sharing Sftpc-creER mice. We wish to extend our thanks to all of the members of the Rajagopal Laboratory for their discussions in lab meetings. This research was supported by the New York Stem Cell Foundation (J.R. is a New York Stem Cell Foundation Robertson Investigator), by a National Institutes of Health-National Heart, Lung, and Blood Institute Early Career Research New Faculty (P30) award (5P30HL101287-02), an RO1 (RO1HL118185) from NHLBI (to J.R.), funding from the Ludwig Cancer Center at Harvard, the Massachusetts Eye and Ear Infirmary, and a Harvard Stem Cell Institute (HSCI) Junior Investigator Grant (to J.R.). R.D.C. is supported by the NIH MSTP training grant (T32GM007205). A.K is supported by the Medical Scientist Training Program (GM007101); P.R.T is a Whitehead Scholar and is supported by a career development award from NHLBI/NIH (K99HL127181). J.R. is also the Maroni Research Scholar at MGH and an HHMI Faculty Scholar.
Footnotes
Author contribution: P.R.T designed, conceived and performed the experiments and co-wrote the manuscript; R.D.C. performed computational analysis, performed experiments and co-wrote the manuscript; A.T., A.K., D.M., H.M. performed western blot analysis and immunofluorescence stainings; S.V.S. performed ChIP experiments; L.H., A.S., M.M-K. provided human lung cancer tissue slides and tumor array slides and analyzed histology and immunohistochemical stainings; S.K. provided mice; L.W.E. supervised ChIP experiments and commented on manuscript; J.R. supervised the work and co-wrote the manuscript. All authors reviewed and edited the manuscript for accuracy. Correspondence and requests for materials should be addressed to P.R.T.
Declaration of interests:
The authors declare no competing interests.
Publisher's Disclaimer: This is a PDF file of an unedited manuscript that has been accepted for publication. As a service to our customers we are providing this early version of the manuscript. The manuscript will undergo copyediting, typesetting, and review of the resulting proof before it is published in its final citable form. Please note that during the production process errors may be discovered which could affect the content, and all legal disclaimers that apply to the journal pertain.
References
- Antonini D, Sirico A, Aberdam E, Ambrosio R, Campanile C, Fagoonee S, Altruda F, Aberdam D, Brissette JL, Missero C. A composite enhancer regulates p63 gene expression in epidermal morphogenesis and in keratinocyte differentiation by multiple mechanisms. Nucleic Acids Res. 2015;43:862–874. doi: 10.1093/nar/gku1396. [DOI] [PMC free article] [PubMed] [Google Scholar]
- Arnold K, Sarkar A, Yram MA, Polo JM, Bronson R, Sengupta S, Seandel M, Geijsen N, Hochedlinger K. Sox2(+) adult stem and progenitor cells are important for tissue regeneration and survival of mice. Cell Stem Cell. 2011;9:317–329. doi: 10.1016/j.stem.2011.09.001. [DOI] [PMC free article] [PubMed] [Google Scholar]
- Bass AJ, Watanabe H, Mermel CH, Yu S, Perner S, Verhaak RG, Kim SY, Wardwell L, Tamayo P, Gat-Viks I, et al. SOX2 is an amplified lineage-survival oncogene in lung and esophageal squamous cell carcinomas. Nat Genet. 2009;41:1238–1242. doi: 10.1038/ng.465. [DOI] [PMC free article] [PubMed] [Google Scholar]
- Blanpain C. Tracing the cellular origin of cancer. Nat Cell Biol. 2013;15:126–134. doi: 10.1038/ncb2657. [DOI] [PubMed] [Google Scholar]
- Campbell JD, Alexandrov A, Kim J, Wala J, Berger AH, Pedamallu CS, Shukla SA, Guo G, Brooks AN, Murray BA, et al. Distinct patterns of somatic genome alterations in lung adenocarcinomas and squamous cell carcinomas. Nat Genet. 2016;48:607–616. doi: 10.1038/ng.3564. [DOI] [PMC free article] [PubMed] [Google Scholar]
- Cancer Genome Atlas Research Network. Comprehensive molecular profiling of lung adenocarcinoma. Nature. 2014;511:543–550. doi: 10.1038/nature13385. [DOI] [PMC free article] [PubMed] [Google Scholar]
- Chatterjee S, Bourque G, Lufkin T. Conserved and non-conserved enhancers direct tissue specific transcription in ancient germ layer specific developmental control genes. BMC Dev Biol. 2011;11:63. doi: 10.1186/1471-213X-11-63. [DOI] [PMC free article] [PubMed] [Google Scholar]
- Waddington CH. The Strategy of the Genes; a Discussion of Some Aspects of Theoretical Biology. Allen & Unwin; London: 1957. [Google Scholar]
- Dalerba P, Sahoo D, Paik S, Guo X, Yothers G, Song N, Wilcox-Fogel N, Forgó E, Rajendran PS, Miranda SP, et al. CDX2 as a Prognostic Biomarker in Stage II and Stage III Colon Cancer. N Engl J Med. 2016;374:211–222. doi: 10.1056/NEJMoa1506597. [DOI] [PMC free article] [PubMed] [Google Scholar]
- Ding X, Pan H, Li J, Zhong Q, Chen X, Dry SM, Wang C-Y. Epigenetic activation of AP1 promotes squamous cell carcinoma metastasis. Sci Signal. 2013;6:ra28.1–13. S0–15. doi: 10.1126/scisignal.2003884. [DOI] [PMC free article] [PubMed] [Google Scholar]
- DuPage M, Dooley AL, Jacks T. Conditional mouse lung cancer models using adenoviral or lentiviral delivery of Cre recombinase. Nat Protoc. 2009;4:1064–1072. doi: 10.1038/nprot.2009.95. [DOI] [PMC free article] [PubMed] [Google Scholar]
- Egeblad M, Nakasone ES, Werb Z. Tumors as organs: complex tissues that interface with the entire organism. Dev Cell. 2010;18:884–901. doi: 10.1016/j.devcel.2010.05.012. [DOI] [PMC free article] [PubMed] [Google Scholar]
- Ferone G, Song JY, Sutherland KD, Bhaskaran R, Monkhorst K, Lambooij JP, Proost N, Gargiulo G, Berns A. SOX2 Is the Determining Oncogenic Switch in Promoting Lung Squamous Cell Carcinoma from Different Cells of Origin. Cancer Cell. 2016;30:519–532. doi: 10.1016/j.ccell.2016.09.001. [DOI] [PMC free article] [PubMed] [Google Scholar]
- Garraway LA, Lander ES. Lessons from the cancer genome. Cell. 2013;153:17–37. doi: 10.1016/j.cell.2013.03.002. [DOI] [PubMed] [Google Scholar]
- Govindan R. Cancer. Attack of the clones. Science. 2014;346:169–170. doi: 10.1126/science.1259926. [DOI] [PubMed] [Google Scholar]
- Han X, Li F, Fang Z, Gao Y, Li F, Fang R, Yao S, Sun Y, Li L, Zhang W, et al. Transdifferentiation of lung adenocarcinoma in mice with Lkb1 deficiency to squamous cell carcinoma. Nat Commun. 2014;5:3261. doi: 10.1038/ncomms4261. [DOI] [PMC free article] [PubMed] [Google Scholar]
- Hanahan D, Weinberg RA. Hallmarks of cancer: the next generation. Cell. 2011;144:646–674. doi: 10.1016/j.cell.2011.02.013. [DOI] [PubMed] [Google Scholar]
- Heinz S, Benner C, Spann N, Bertolino E, Lin YC, Laslo P, Cheng JX, Murre C, Singh H, Glass CK. Simple combinations of lineage-determining transcription factors prime cis-regulatory elements required for macrophage and B cell identities. Mol Cell. 2010;38:576–589. doi: 10.1016/j.molcel.2010.05.004. [DOI] [PMC free article] [PubMed] [Google Scholar]
- Junttila MR, de Sauvage FJ. Influence of tumour micro-environment heterogeneity on therapeutic response. Nature. 2013;501:346–354. doi: 10.1038/nature12626. [DOI] [PubMed] [Google Scholar]
- Justilien V, Walsh MP, Ali SA, Thompson EA, Murray NR, Fields AP. The PRKCI and SOX2 oncogenes are coamplified and cooperate to activate Hedgehog signaling in lung squamous cell carcinoma. Cancer Cell. 2014;25:139–151. doi: 10.1016/j.ccr.2014.01.008. [DOI] [PMC free article] [PubMed] [Google Scholar]
- Kim BR, Van de Laar E, Cabanero M, Tarumi S, Hasenoeder S, Wang D, Virtanen C, Suzuki T, Bandarchi B, Sakashita S, et al. SOX2 and PI3K Cooperate to Induce and Stabilize a Squamous-Committed Stem Cell Injury State during Lung Squamous Cell Carcinoma Pathogenesis. PLoS Biol. 2016;14:e1002581. doi: 10.1371/journal.pbio.1002581. [DOI] [PMC free article] [PubMed] [Google Scholar]
- Kim TH, Li F, Ferreiro-Neira I, Ho LL, Luyten A, Nalapareddy K, Long H, Verzi M, Shivdasani RA. Broadly permissive intestinal chromatin underlies lateral inhibition and cell plasticity. Nature. 2014;506:511–515. doi: 10.1038/nature12903. [DOI] [PMC free article] [PubMed] [Google Scholar]
- Kusakabe T, Kawaguchi A, Hoshi N, Kawaguchi R, Hoshi S, Kimura S. Thyroid-Specific Enhancer-Binding Protein/NKX2.1 Is Required for the Maintenance of Ordered Architecture and Function of the Differentiated Thyroid. Mol Endocrinol Baltim Md. 2006;20:1796–1809. doi: 10.1210/me.2005-0327. [DOI] [PMC free article] [PubMed] [Google Scholar]
- Kwon M, Berns A. Mouse models for lung cancer. Mol Oncol. 2013;7:165–177. doi: 10.1016/j.molonc.2013.02.010. [DOI] [PMC free article] [PubMed] [Google Scholar]
- Langmead B, Salzberg SL. Fast gapped-read alignment with Bowtie 2. Nat Methods. 2012;9:357–359. doi: 10.1038/nmeth.1923. [DOI] [PMC free article] [PubMed] [Google Scholar]
- Li H, Handsaker B, Wysoker A, Fennell T, Ruan J, Homer N, Marth G, Abecasis G, Durbin R Subgroup, 1000 Genome Project Data Processing. The Sequence Alignment/Map format and SAMtools. Bioinformatics. 2009;25:2078–2079. doi: 10.1093/bioinformatics/btp352. [DOI] [PMC free article] [PubMed] [Google Scholar]
- Lu Y, Futtner C, Rock JR, Xu X, Whitworth W, Hogan BLM, Onaitis MW. Evidence That SOX2 Overexpression Is Oncogenic in the Lung. PLoS ONE. 2010;5:e11022. doi: 10.1371/journal.pone.0011022. [DOI] [PMC free article] [PubMed] [Google Scholar]
- Maeda Y, Tsuchiya T, Hao H, Tompkins DH, Xu Y, Mucenski ML, Du L, Keiser AR, Fukazawa T, Naomoto Y, et al. Kras(G12D) and Nkx2-1 haploinsufficiency induce mucinous adenocarcinoma of the lung. J Clin Invest. 2012;122:4388–4400. doi: 10.1172/JCI64048. [DOI] [PMC free article] [PubMed] [Google Scholar]
- Marusyk A, Almendro V, Polyak K. Intra-tumour heterogeneity: a looking glass for cancer? Nat Rev Cancer. 2012;12:323–334. doi: 10.1038/nrc3261. [DOI] [PubMed] [Google Scholar]
- McGranahan N, Swanton C. Biological and therapeutic impact of intratumor heterogeneity in cancer evolution. Cancer Cell. 2015;27:15–26. doi: 10.1016/j.ccell.2014.12.001. [DOI] [PubMed] [Google Scholar]
- Meacham CE, Morrison SJ. Tumour heterogeneity and cancer cell plasticity. Nature. 2013;501:328–337. doi: 10.1038/nature12624. [DOI] [PMC free article] [PubMed] [Google Scholar]
- Meyertholen K, Ravnan JB, Matalon R. Identification of a Novel 14q13.3 Deletion Involving the SLC25A21 Gene Associated with Familial Synpolydactyly. Mol Syndromol. 2012;3:25–29. doi: 10.1159/000339177. [DOI] [PMC free article] [PubMed] [Google Scholar]
- Mou H, Vinarsky V, Tata PR, Brazauskas K, Choi SH, Crooke AK, Zhang B, Solomon GM, Turner B, Bihler H, et al. Dual SMAD Signaling Inhibition Enables Long-Term Expansion of Diverse Epithelial Basal Cells. Cell Stem Cell. 2016;19:217–231. doi: 10.1016/j.stem.2016.05.012. [DOI] [PMC free article] [PubMed] [Google Scholar]
- Mukhopadhyay A, Berrett KC, Kc U, Clair PM, Pop SM, Carr SR, Witt BL, Oliver TG. Sox2 cooperates with Lkb1 loss in a mouse model of squamous cell lung cancer. Cell Rep. 2014;8:40–49. doi: 10.1016/j.celrep.2014.05.036. [DOI] [PMC free article] [PubMed] [Google Scholar]
- Okubo T, Hogan BLM. Hyperactive Wnt signaling changes the developmental potential of embryonic lung endoderm. J Biol. 2004;3:11. doi: 10.1186/jbiol3. [DOI] [PMC free article] [PubMed] [Google Scholar]
- Peters H, Neubüser A, Kratochwil K, Balling R. Pax9-deficient mice lack pharyngeal pouch derivatives and teeth and exhibit craniofacial and limb abnormalities. Genes Dev. 1998;12:2735–2747. doi: 10.1101/gad.12.17.2735. [DOI] [PMC free article] [PubMed] [Google Scholar]
- Ritchie ME, Phipson B, Wu D, Hu Y, Law CW, Shi W, Smyth GK. limma powers differential expression analyses for RNA-sequencing and microarray studies. Nucleic Acids Res. 2015;43:e47. doi: 10.1093/nar/gkv007. [DOI] [PMC free article] [PubMed] [Google Scholar]
- Rock JR, Barkauskas CE, Cronce MJ, Xue Y, Harris JR, Liang J, Noble PW, Hogan BLM. Multiple stromal populations contribute to pulmonary fibrosis without evidence for epithelial to mesenchymal transition. Proc Natl Acad Sci U S A. 2011;108:E1475–1483. doi: 10.1073/pnas.1117988108. [DOI] [PMC free article] [PubMed] [Google Scholar]
- Sahoo D, Dill DL, Tibshirani R, Plevritis SK. Extracting binary signals from microarray time-course data. Nucleic Acids Res. 2007;35:3705–3712. doi: 10.1093/nar/gkm284. [DOI] [PMC free article] [PubMed] [Google Scholar]
- Saladi SV, Ross K, Karaayvaz M, Tata PR, Mou H, Rajagopal J, Ramaswamy S, Ellisen LW. ACTL6A Is Co-Amplified with p63 in Squamous Cell Carcinoma to Drive YAP Activation, Regenerative Proliferation, and Poor Prognosis. Cancer Cell. 2017;31:35–49. doi: 10.1016/j.ccell.2016.12.001. [DOI] [PMC free article] [PubMed] [Google Scholar]
- Santagati F, Abe K, Schmidt V, Schmitt-John T, Suzuki M, Yamamura KI, Imai K. Identification of Cis-regulatory elements in the mouse Pax9/Nkx2-9 genomic region: implication for evolutionary conserved synteny. Genetics. 2003;165:235–242. doi: 10.1093/genetics/165.1.235. [DOI] [PMC free article] [PubMed] [Google Scholar]
- Shen L, Shao N, Liu X, Nestler E. ngs.plot: Quick mining and visualization of next-generation sequencing data by integrating genomic databases. BMC Genomics. 2014;15:284. doi: 10.1186/1471-2164-15-284. [DOI] [PMC free article] [PubMed] [Google Scholar]
- Shim HS, Kenudson M, Zheng Z, Liebers M, Cha YJ, Hoang Ho Q, Onozato M, Phi Le L, Heist RS, Iafrate AJ. Unique Genetic and Survival Characteristics of Invasive Mucinous Adenocarcinoma of the Lung. J Thorac Oncol Off Publ Int Assoc Study Lung Cancer. 2015;10:1156–1162. doi: 10.1097/JTO.0000000000000579. [DOI] [PubMed] [Google Scholar]
- Snyder EL, Watanabe H, Magendantz M, Hoersch S, Chen TA, Wang DG, Crowley D, Whittaker CA, Meyerson M, Kimura S, et al. Nkx2-1 represses a latent gastric differentiation program in lung adenocarcinoma. Mol Cell. 2013;50:185–199. doi: 10.1016/j.molcel.2013.02.018. [DOI] [PMC free article] [PubMed] [Google Scholar]
- Tata PR, Mou H, Pardo-Saganta A, Zhao R, Prabhu M, Law BM, Vinarsky V, Cho JL, Breton S, Sahay A, et al. Dedifferentiation of committed epithelial cells into stem cells in vivo. Nature. 2013;503:218–223. doi: 10.1038/nature12777. [DOI] [PMC free article] [PubMed] [Google Scholar]
- Visvader JE. Cells of origin in cancer. Nature. 2011;469:314–322. doi: 10.1038/nature09781. [DOI] [PubMed] [Google Scholar]
- Weir BA, Woo MS, Getz G, Perner S, Ding L, Beroukhim R, Lin WM, Province MA, Kraja A, Johnson LA, et al. Characterizing the cancer genome in lung adenocarcinoma. Nature. 2007;450:893–898. doi: 10.1038/nature06358. [DOI] [PMC free article] [PubMed] [Google Scholar]
- Wells JM. Developmental biology. Regional identity of gut stem cells--one gene to rule them all. Nat Rev Gastroenterol Hepatol. 2015;12:125–126. doi: 10.1038/nrgastro.2015.22. [DOI] [PubMed] [Google Scholar]
- Wu X, Nguyen BC, Dziunycz P, Chang S, Brooks Y, Lefort K, Hofbauer GFL, Dotto GP. Opposing roles for calcineurin and ATF3 in squamous skin cancer. Nature. 2010;465:368–372. doi: 10.1038/nature08996. [DOI] [PMC free article] [PubMed] [Google Scholar]
- Xu X, Huang L, Futtner C, Schwab B, Rampersad RR, Lu Y, Sporn TA, Hogan BLM, Onaitis MW. The cell of origin and subtype of K-Ras-induced lung tumors are modified by Notch and Sox2. Genes Dev. 2014;28:1929–1939. doi: 10.1101/gad.243717.114. [DOI] [PMC free article] [PubMed] [Google Scholar]
- Yuan B, Li C, Kimura S, Engelhardt RT, Smith BR, Minoo P. Inhibition of distal lung morphogenesis in Nkx2.1(−/−) embryos. Dev Dyn Off Publ Am Assoc Anat. 2000;217:180–190. doi: 10.1002/(SICI)1097-0177(200002)217:2<180::AID-DVDY5>3.0.CO;2-3. [DOI] [PubMed] [Google Scholar]
- Zhang Y, Liu T, Meyer CA, Eeckhoute J, Johnson DS, Bernstein BE, Nusbaum C, Myers RM, Brown M, Li W, et al. Model-based Analysis of ChIP-Seq (MACS) Genome Biol. 2008;9:R137. doi: 10.1186/gb-2008-9-9-r137. [DOI] [PMC free article] [PubMed] [Google Scholar]
Associated Data
This section collects any data citations, data availability statements, or supplementary materials included in this article.