

Abstract
Concerns about high caffeine intake and coffee as a vehicle for added fat and sugar have raised questions about the net impact of coffee on health. Although inverse associations have been observed for overall mortality, data for cause-specific mortality are sparse. Additionally, few studies have considered exclusively decaffeinated coffee intake or use of coffee additives. Coffee intake was assessed at baseline by self-report in the Prostate, Lung, Colorectal and Ovarian Cancer Screening Trial. Hazard ratios were estimated using Cox proportional hazards models. Among 90,317 US adults without cancer at study baseline (1998–2001) or history of cardiovascular disease at study enrollment (1993–2001), 8,718 deaths occurred during 805,644 person-years of follow-up from 1998 through 2009. Following adjustment for smoking and other potential confounders, coffee drinkers, as compared with nondrinkers, had lower hazard ratios for overall mortality (<1 cup/day: hazard ratio (HR) = 0.99 (95% confidence interval (CI): 0.92, 1.07); 1 cup/day: HR = 0.94 (95% CI: 0.87, 1.02); 2–3 cups/day: HR = 0.82 (95% CI: 0.77, 0.88); 4–5 cups/day: HR = 0.79 (95% CI: 0.72, 0.86); ≥6 cups/day: HR = 0.84 (95% CI: 0.75, 0.95)). Similar findings were observed for decaffeinated coffee and coffee additives. Inverse associations were observed for deaths from heart disease, chronic respiratory diseases, diabetes, pneumonia and influenza, and intentional self-harm, but not cancer. Coffee may reduce mortality risk by favorably affecting inflammation, lung function, insulin sensitivity, and depression.
Keywords: additives, caffeine, cause-specific mortality, coffee, mortality
Approximately 80% of US adults drink coffee, and 60% drink coffee daily (1). The high prevalence of exposure to coffee worldwide, combined with the possibility that coffee consumption poses both health benefits and risks (2–12), has prompted numerous epidemiologic studies. Despite accumulating evidence supporting an inverse relationship between coffee consumption and overall mortality, the modest association continues to be debated (13). In a recent study, Liu et al. (14) reported a positive association between heavy coffee consumption and mortality. However, results from the largest cohort study conducted to date suggested that coffee consumption was inversely associated with overall mortality among older adults (15). Moreover, meta-analyses of prospective studies indicate that coffee consumption is inversely related to overall mortality (13, 16, 17).
Prior cohort studies have considered the association between coffee consumption and cardiovascular disease mortality; meta-analyses of these studies have observed a modest inverse association (13, 17). Fewer studies have considered associations with other major causes of death. Freedman et al. (15) considered 7 specific causes of death and observed inverse associations between coffee consumption and mortality due to heart disease, respiratory disease, stroke, injuries and accidents, diabetes, and infections. Additional studies indicated that coffee consumption was inversely associated with suicide (18) and chronic liver disease mortality (9).
We used data from the Prostate, Lung, Colorectal and Ovarian (PLCO) Cancer Screening Trial, a large population-based US cohort study, to evaluate the associations of coffee drinking with mortality from all causes and the 10 leading causes of death in the United States. The results of our analysis, which included detailed data on decaffeinated coffee consumption and use of additives (e.g., cream and sugar), enhance our understanding of the relationship between coffee consumption and mortality.
METHODS
Study population
The PLCO Cancer Screening Trial, which has been described in detail elsewhere (19, 20), is a large, population-based randomized cancer screening trial that enrolled 78,234 women and 76,704 men aged 55–74 years from 10 screening centers across the United States between 1993 and 2001. Participants were not eligible if they had a history of PLCO cancers; detailed exclusion criteria are reported elsewhere (19). Of 154,938 participants, 111,511 completed the baseline questionnaire, which queried about demographic characteristics and other general risk factors, and a valid Diet History Questionnaire (DHQ) at study entry or at a follow-up visit made approximately 3 years after study entry. A DHQ was considered invalid if the participant died before its completion, had more than 8 missing or multiple-frequency responses, had a missing completion date, or had extreme calorie consumption, defined as less than the first percentile of intake or more than the 99th percentile of intake. We additionally excluded participants with incomplete data on coffee consumption (n =247) or smoking (n = 998), a history of cancer prior to completion of the DHQ (n = 9,612), or a self-reported history of cardiovascular disease at study entry (n = 10,337). Our analytical cohort included 90,317 participants.
The institutional review boards of the National Cancer Institute and the 10 participating study centers approved this study. Informed consent was obtained from all participants at study enrollment.
Assessment of coffee
The DHQ is a 114-item food frequency questionnaire (21–23) that queries about coffee consumption in the previous 12 months using 10 prespecified categories. We defined coffee consumption as follows: non–coffee drinking, <1 cup/day, 1 cup/day, 2–3 cups/day, 4–5 cups/day, or ≥6 cups/day. We collapsed the top 2 categories for secondary analyses to preserve sample size in these more sparsely populated categories of consumption. Participants specified how often they drank decaffeinated coffee, using 5 categories ranging from “almost never or never” to “almost always or always,” and the frequency and amount of sugar or honey, artificial sweeteners, nondairy creamers, and dairy products that they added to their coffee or tea.
Cohort follow-up
The DHQ was introduced into the PLCO trial in December 1998. Timing of DHQ completion varied according to study arm and date of randomization. Participants who were randomized to the control arm prior to December 1998 completed the DHQ in 1999 or 2000; those who were randomized to the control arm in or after December 1998 (until 2001, when enrollment closed) completed the DHQ at study entry. Participants who were randomized to the screening arm prior to December 1995 completed the DHQ in 1999; those randomized to the screening arm in or after December 1995 completed the DHQ around their third anniversary of randomization. For all analyses, we counted person-years of follow-up time from completion of the DHQ until the date of death or December 31, 2009, whichever came first. For cause-specific mortality analyses, persons who died from other causes were censored at their date of death.
Ascertainment of death
Vital status was ascertained by annual mailed questionnaires and periodic linkage to the National Death Index. Our primary outcome of interest was overall mortality. Secondary outcomes included the 10 leading causes of death in the United States according to the recent National Vital Statistics Report (24). We used International Classification of Diseases, Ninth Revision (ICD-9), codes to classify the underlying cause of death specified on the death certificate (25). Causes of death, in order, were defined as follows: heart disease (ICD-9 codes 390–398, 402, 404, and 410–429), cancer (ICD-9 codes 140–239), chronic lower respiratory diseases (ICD-9 codes 490–494 and 496), stroke (ICD-9 codes 430–434 and 436–438), accidents (ICD-9 codes E800–E869 and E880–E929), Alzheimer's disease (ICD-9 code 331.0), diabetes mellitus (ICD-9 code 250), influenza and pneumonia (ICD-9 codes 480–487), kidney disease (ICD-9 codes 580–589), and intentional self-harm (ICD-9 codes E950–E959; includes suicide and late effects of self-inflicted injury).
Assessment of covariates
The baseline questionnaire obtained information on potential confounding factors. Current and former cigarette smoking were defined by smoking intensity (cigarettes/day) and age of initiation, and former smoking by time since quitting. Nutrient and food group intakes were computed using responses from the DHQ in conjunction with the US Department of Agriculture's 1994–1996 Continuing Survey of Food Intakes by Individuals database (26, 27).
Statistical analysis
We tabulated potential confounding factors by coffee intake. Cox proportional hazards regression models were used to estimate hazard ratios and 95% confidence intervals for mortality. Person-years (i.e., calendar time) of follow-up were used as the underlying time metric; results calculated with age as the underlying time metric were similar. We conducted trend tests by assigning participants the midpoint of their intake category and entering this single variable into the model; participants in the open-ended categories of ≥6 cups/day and ≥4 cups/day were assigned values of 8 cups/day and 5 cups/day, respectively, for trend tests. We tested the proportional-hazards assumption by modeling the interaction of follow-up time with the ordinal 6-level coffee variable; no deviations were observed for overall mortality (for likelihood ratio test, P = 0.34). We used SAS software, version 9.3 (SAS Institute, Inc., Cary, North Carolina) to conduct analyses. Statistical tests were 2-sided, and corresponding P values less than 0.05 were interpreted as statistically significant.
For the analyses of coffee and mortality, we adjusted for age, sex, and tobacco smoking, as well as demographic, lifestyle, and dietary factors potentially associated with mortality. Hazard ratio estimates for cancer mortality were adjusted for a family history of cancer (other than nonmelanoma skin cancer) in a first-degree relative. Less than 2% of the cohort lacked information on any single covariate; nonetheless, we included indicator variables to represent missing-data categories in regression models. Since physical activity is a potential confounder but data on this variable were available for only a subset of participants (n = 42,235), we examined confounding by physical activity, with the recognition of its measurement error problems, in this subsample.
We calculated risk estimates separately for participants who drank only caffeinated or decaffeinated coffee. We also used additive models to mutually adjust for caffeinated and decaffeinated coffee intake using nondrinkers of both coffee types as the reference group. Additionally, we calculated hazard ratio estimates among prespecified subgroups based on the following: use of coffee additives, follow-up time, sex, age, cigarette-smoking status, diabetes status, body mass index (defined as weight in kilograms divided by height in meters squared), alcohol consumption, supplemental vitamin use, regular use of nonsteroidal antiinflammatory drugs, receipt of menopausal hormone therapy (women only), and high or low intake of saturated fat, red and processed meat, white meat, fruits, and vegetables. We used the likelihood ratio test to compare multivariable models with and without the cross-product terms for each level of the stratifying variable with coffee consumption as an ordinal 5-level variable. We conducted sensitivity analyses to better understand the robustness of the observed associations. We excluded participants with a self-reported or unknown history of hypertension (n = 27,427) or gastrointestinal comorbidity (n = 11,362), and we examined associations after including participants with cancer at baseline (n = 9,612) or a self-reported/unknown history of coronary heart disease, heart attack, or stroke (n = 10,337).
RESULTS
In the PLCO cohort, 49% and 23% of coffee drinkers reported drinking only caffeinated or decaffeinated coffee, respectively. Coffee drinkers, as compared with nondrinkers, were more likely to be male, non-Hispanic white, and current smokers; they were more likely to use nonsteroidal antiinflammatory drugs, drink alcohol, and have a body mass index above 25, but they were less likely to be college graduates, work for pay or be a homemaker, use supplemental vitamins, or report a history of diabetes. Women who drank coffee were less likely to be current users of menopausal hormone therapy. With regards to diet, coffee drinkers generally consumed more saturated fat, red and processed meat, and daily calories, but less white meat, fruits, and vegetables (Table 1).
Table 1.
Baseline Characteristics of US Adults Who Participated in the Prostate, Lung, Colorectal and Ovarian Cancer Screening Trial (n = 90,317), by Daily Coffee Intake, 1998–2009
| Characteristic | Coffee Consumption, cups/day |
P Valuea | |||||||
|---|---|---|---|---|---|---|---|---|---|
| 0 (n = 14,585) |
<1 (n = 14,600) |
2–3 (n = 34,083) |
≥6 (n = 3,240) |
||||||
| % | Median (IQR) | % | Median (IQR) | % | Median (IQR) | % | Median (IQR) | ||
| Male sex | 40.2 | 44.5 | 47.6 | 62.1 | <0.0001 | ||||
| Non-Hispanic white race | 90.6 | 84.8 | 93.7 | 97.5 | <0.0001 | ||||
| College graduate | 38.9 | 38.7 | 36.1 | 28.2 | <0.0001 | ||||
| Employed or homemaker | 57.4 | 53.6 | 52.5 | 55.4 | <0.0001 | ||||
| Married or living as married | 78.8 | 74.9 | 79.5 | 76.2 | <0.0001 | ||||
| Current cigarette smoker | 4.0 | 5.2 | 9.8 | 31.8 | <0.0001 | ||||
| Diabetes | 6.4 | 6.7 | 5.2 | 4.8 | <0.0001 | ||||
| Body mass indexb ≥25 | 64.9 | 65.6 | 66.4 | 66.9 | <0.0001 | ||||
| Regular ibuprofen usec | 25.6 | 27.7 | 29.9 | 29.4 | <0.0001 | ||||
| Regular aspirin usec | 38.0 | 42.3 | 46.0 | 46.4 | <0.0001 | ||||
| Supplemental vitamin usec | 85.9 | 86.3 | 84.5 | 78.6 | <0.0001 | ||||
| Alcohol intake ≥3 drinks/day | 17.1 | 34.6 | 50.0 | 43.2 | <0.0001 | ||||
| Family history of cancerd | 56.3 | 55.4 | 56.5 | 55.7 | 0.17 | ||||
| Randomized to screening arm | 51.2 | 51.1 | 51.5 | 50.0 | 0.63 | ||||
| Current receipt of MHTe | 54.8 | 54.2 | 53.5 | 44.2 | <0.0001 | ||||
| Age, years | 65 (60–69) | 65 (60–70) | 65 (61–70) | 64 (60–68) | <0.0001 | ||||
| Dietary intake | |||||||||
| Total energy, kcal/day | 1,558 (1,189–2,031) | 1,532 (1,162–2,018) | 1,622 (1,242–2,114) | 1,931 (1,461–2,518) | <0.0001 | ||||
| Fruits, servings/day | 1.7 (1.0–2.5) | 1.6 (1.0–2.4) | 1.4 (0.8–2.1) | 1.0 (0.5–1.6) | <0.0001 | ||||
| Vegetables, servings/day | 2.2 (1.6–2.9) | 2.2 (1.5–2.9) | 2.1 (1.5–2.8) | 1.9 (1.3–2.6) | <0.0001 | ||||
| Red meat, g/day | 27.0 (16.3–40.8) | 28.6 (17.8–42.6) | 32.0 (21.1–45.5) | 36.2 (24.2–51.9) | <0.0001 | ||||
| White meat, g/day | 22.4 (12.8–38.1) | 24.1 (14.1–40.1) | 23.6 (14.2–38.2) | 19.6 (11.3–32.2) | <0.0001 | ||||
| Saturated fat, % of kcal/day | 9.9 (7.8–11.9) | 9.5 (7.6–11.6) | 10.0 (8.1–12.0) | 11.2 (8.9–13.3) | <0.0001 | ||||
Abbreviations: IQR, interquartile range; MHT, menopausal hormone therapy.
a P value from a χ2 test for categorical variables and a Jonckheere-Terpstra test for trend for continuous variables.
b Weight (kg)/height (m)2.
c In the previous 12 months.
d Cancer (excluding nonmelanoma skin cancer) in a first-degree relative.
e Women with nonmissing data on MHT use only (n = 48,307).
During 805,644 person-years of follow-up (median, 9 years), 8,718 deaths occurred. In age- and sex-adjusted analyses, coffee consumption was associated with an increased hazard ratio for overall mortality (P for trend < 0.0001). Following adjustment for smoking, we observed evidence of an inverse dose-dependent association (P for trend < 0.001). Additional adjustment for other potential confounders had a modest effect on hazard ratio estimates (Table 2).
Table 2.
Association of Daily Coffee Intake With All-Cause Mortality in the Prostate, Lung, Colorectal and Ovarian Cancer Screening Trial (n = 90,317), 1998–2009
| Model | Coffee Consumption, cups/daya |
P for Trendb | |||||||||||
|---|---|---|---|---|---|---|---|---|---|---|---|---|---|
| 0 (n = 14,585) |
<1 (n = 14,600) |
1 (n = 13,886) |
2–3 (n = 34,083) |
4–5 (n = 9,923) |
≥6 (n = 3,240) |
||||||||
| HR | 95% CI | HR | 95% CI | HR | 95% CI | HR | 95% CI | HR | 95% CI | HR | 95% CI | ||
| Model 1c | 1.00 | Referent | 1.03 | 0.96, 1.11 | 0.96 | 0.89, 1.03 | 0.92 | 0.86, 0.98 | 1.05 | 0.97, 1.14 | 1.41 | 1.27, 1.58 | <0.0001 |
| Model 2d | 1.00 | Referent | 0.95 | 0.88, 1.02 | 0.86 | 0.80, 0.93 | 0.74 | 0.70, 0.79 | 0.72 | 0.66, 0.79 | 0.79 | 0.70, 0.88 | <0.0001 |
| Model 3e | 1.00 | Referent | 0.99 | 0.92, 1.07 | 0.94 | 0.87, 1.02 | 0.82 | 0.77, 0.88 | 0.79 | 0.72, 0.86 | 0.84 | 0.75, 0.95 | <0.0001 |
Abbreviations: CI, confidence interval; HR, hazard ratio.
a There were 1,376, 1,452, 1,372, 3,107, 998, and 413 deaths in the 6 coffee consumption categories, respectively.
b Statistical tests were 2-sided, and P < 0.05 was interpreted as statistically significant.
c Results were adjusted for age and sex.
d Results were additionally adjusted for detailed smoking history (number of cigarettes smoked per day (≤10, 11–20, 21–40, or ≥41), time of smoking cessation (>1–<5, 5–<10, 10–<20, or ≥20 years prior to study entry; persons who quit within 1 year of baseline were considered current smokers), age at smoking initiation (<15, 15–<20, 20–<25, or ≥25 years), and use of pipes or cigars (never, former, or current use)).
e Results were additionally adjusted for race/ethnicity (non-Hispanic white, non-Hispanic black, Hispanic, or other), educational level (less than a high school education, high school graduate or equivalent, some post–high school education, or college graduate), marital status (married or living as married or not married), employment status (working or homemaker, unemployed, retired, on extended sick leave or disabled, or other), presence or absence of diabetes, body mass index (weight (kg)/height (m)2; <18.5, 18.5–<25, 25–<30, 30–<35, or ≥35), any supplemental vitamin use in the previous 12 months (yes or no), regular ibuprofen use in the previous 12 months (yes or no), regular aspirin use in the previous 12 months (yes or no), receipt of menopausal hormone therapy (women only) (never, former, or current use), alcohol consumption (0, <1, 1–<3, or ≥3 drinks/day), total daily energy intake, and quintile of daily intake of red and processed meat, white meat (i.e., poultry and fish), saturated fat, fruits, and vegetables.
In our cohort, the 10 leading causes of death in the United States (24) accounted for 79% of deaths, with cancer and heart disease accounting for the largest fractions at 37% and 20%, respectively. In fully adjusted models, we observed inverse associations between coffee and death from heart disease, chronic lower respiratory diseases, diabetes, influenza and pneumonia, intentional self-harm, and other or unknown causes (all P's for trend < 0.05). Conversely, associations between coffee consumption and deaths from cancer, stroke, accidents, Alzheimer's disease, or kidney disease were not statistically significant (Table 3).
Table 3.
Association of Daily Coffee Intake With Cause-Specific Mortality in the Prostate, Lung, Colorectal and Ovarian Cancer Screening Trial (n = 90,317), 1998–2009
| Cause of Death and Model |
Coffee Consumption, cups/day |
P for Trenda | |||||||||
|---|---|---|---|---|---|---|---|---|---|---|---|
| 0 (n = 14,585) |
<1 (n = 14,600) |
1 (n = 13,886) |
2–3 (n = 34,083) |
≥4 (n = 13,163) |
|||||||
| HR | 95% CI | HR | 95% CI | HR | 95% CI | HR | 95% CI | HR | 95% CI | ||
| Heart disease | |||||||||||
| No. of deaths | 305 | 328 | 259 | 596 | 273 | ||||||
| Model 1b | 1.00 | Referent | 1.04 | 0.89, 1.22 | 0.81 | 0.69, 0.96 | 0.79 | 0.68, 0.90 | 0.97 | 0.82, 1.14 | 0.12 |
| Model 2c | 1.00 | Referent | 0.96 | 0.82, 1.12 | 0.73 | 0.62, 0.87 | 0.65 | 0.56, 0.75 | 0.67 | 0.56, 0.79 | <0.0001 |
| Model 3d | 1.00 | Referent | 1.00 | 0.85, 1.18 | 0.81 | 0.68, 0.96 | 0.74 | 0.64, 0.86 | 0.75 | 0.63, 0.90 | <0.0001 |
| Cancer | |||||||||||
| No. of deaths | 438 | 446 | 501 | 1,227 | 600 | ||||||
| Model 1 | 1.00 | Referent | 1.00 | 0.88, 1.14 | 1.13 | 0.99, 1.28 | 1.15 | 1.03, 1.28 | 1.49 | 1.32, 1.69 | <0.0001 |
| Model 2 | 1.00 | Referent | 0.92 | 0.80, 1.05 | 1.00 | 0.88, 1.14 | 0.90 | 0.81, 1.01 | 0.92 | 0.80, 1.04 | 0.21 |
| Model 3e | 1.00 | Referent | 0.93 | 0.81, 1.07 | 1.05 | 0.92, 1.20 | 0.95 | 0.84, 1.06 | 0.95 | 0.83, 1.09 | 0.47 |
| Chronic lower respiratory diseases | |||||||||||
| No. of deaths | 52 | 62 | 48 | 183 | 112 | ||||||
| Model 1 | 1.00 | Referent | 1.17 | 0.81, 1.69 | 0.87 | 0.59, 1.29 | 1.44 | 1.06, 1.97 | 2.46 | 1.77, 3.43 | <0.0001 |
| Model 2 | 1.00 | Referent | 0.86 | 0.60, 1.25 | 0.57 | 0.38, 0.84 | 0.67 | 0.49, 0.92 | 0.68 | 0.48, 0.95 | 0.11 |
| Model 3 | 1.00 | Referent | 0.93 | 0.64, 1.35 | 0.73 | 0.48, 1.08 | 0.78 | 0.57, 1.08 | 0.68 | 0.48, 0.97 | 0.04 |
| Stroke | |||||||||||
| No. of deaths | 83 | 79 | 82 | 149 | 66 | ||||||
| Model 1 | 1.00 | Referent | 0.94 | 0.69, 1.29 | 0.92 | 0.68, 1.25 | 0.75 | 0.58, 0.99 | 0.97 | 0.70, 1.35 | 0.44 |
| Model 2 | 1.00 | Referent | 0.92 | 0.67, 1.25 | 0.89 | 0.65, 1.21 | 0.68 | 0.52, 0.90 | 0.77 | 0.55, 1.08 | 0.03 |
| Model 3 | 1.00 | Referent | 0.89 | 0.65, 1.22 | 0.88 | 0.64, 1.21 | 0.68 | 0.51, 0.91 | 0.77 | 0.54, 1.10 | 0.06 |
| Accidents | |||||||||||
| No. of deaths | 55 | 50 | 50 | 123 | 46 | ||||||
| Model 1 | 1.00 | Referent | 0.89 | 0.60, 1.30 | 0.88 | 0.60, 1.30 | 0.90 | 0.66, 1.24 | 0.90 | 0.61, 1.33 | 0.78 |
| Model 2 | 1.00 | Referent | 0.86 | 0.59, 1.27 | 0.86 | 0.58, 1.26 | 0.85 | 0.61, 1.17 | 0.78 | 0.53, 1.18 | 0.35 |
| Model 3 | 1.00 | Referent | 0.93 | 0.62, 1.38 | 0.94 | 0.63, 1.41 | 0.91 | 0.64, 1.29 | 0.80 | 0.52, 1.22 | 0.32 |
| Alzheimer's disease | |||||||||||
| No. of deaths | 21 | 19 | 14 | 27 | 12 | ||||||
| Model 1 | 1.00 | Referent | 0.89 | 0.48, 1.65 | 0.60 | 0.30, 1.17 | 0.54 | 0.31, 0.96 | 0.73 | 0.36, 1.48 | 0.19 |
| Model 2 | 1.00 | Referent | 0.86 | 0.46, 1.60 | 0.57 | 0.29, 1.12 | 0.51 | 0.29, 0.92 | 0.64 | 0.30, 1.35 | 0.12 |
| Model 3 | 1.00 | Referent | 1.01 | 0.53, 1.95 | 0.66 | 0.32, 1.36 | 0.59 | 0.31, 1.11 | 0.72 | 0.33, 1.58 | 0.20 |
| Diabetes | |||||||||||
| No. of deaths | 27 | 48 | 31 | 45 | 22 | ||||||
| Model 1 | 1.00 | Referent | 1.72 | 1.07, 2.76 | 1.12 | 0.67, 1.87 | 0.67 | 0.41, 1.07 | 0.85 | 0.48, 1.50 | 0.003 |
| Model 2 | 1.00 | Referent | 1.63 | 1.02, 2.63 | 1.06 | 0.63, 1.78 | 0.59 | 0.36, 0.97 | 0.66 | 0.37, 1.20 | 0.0002 |
| Model 3f | 1.00 | Referent | 1.90 | 1.17, 3.10 | 1.38 | 0.81, 2.36 | 0.79 | 0.48, 1.32 | 0.88 | 0.48, 1.60 | 0.01 |
| Kidney diseaseg | |||||||||||
| No. of deaths | 18 | 17 | 27 | 37 | 9 | ||||||
| Model 1 | 1.00 | Referent | 0.91 | 0.47, 1.76 | 1.35 | 0.74, 2.44 | 0.84 | 0.48, 1.48 | 0.59 | 0.27, 1.33 | 0.11 |
| Model 2 | 1.00 | Referent | 0.87 | 0.45, 1.70 | 1.27 | 0.70, 2.33 | 0.75 | 0.42, 1.34 | 0.49 | 0.21, 1.11 | 0.03 |
| Model 3 | 1.00 | Referent | 1.07 | 0.54, 2.12 | 1.72 | 0.92, 3.23 | 1.05 | 0.57, 1.93 | 0.62 | 0.26, 1.44 | 0.13 |
| Influenza and pneumonia | |||||||||||
| No. of deaths | 38 | 38 | 42 | 77 | 23 | ||||||
| Model 1 | 1.00 | Referent | 0.97 | 0.62, 1.52 | 1.03 | 0.67, 1.60 | 0.82 | 0.56, 1.21 | 0.68 | 0.40, 1.14 | 0.06 |
| Model 2 | 1.00 | Referent | 0.85 | 0.54, 1.33 | 0.88 | 0.57, 1.38 | 0.63 | 0.42, 0.94 | 0.44 | 0.26, 0.75 | 0.001 |
| Model 3 | 1.00 | Referent | 1.00 | 0.63, 1.59 | 1.11 | 0.70, 1.75 | 0.82 | 0.54, 1.25 | 0.55 | 0.32, 0.95 | 0.01 |
| Intentional self-harm | |||||||||||
| No. of deaths | 8 | 13 | 15 | 19 | 8 | ||||||
| Model 1 | 1.00 | Referent | 1.54 | 0.64, 3.72 | 1.91 | 0.81, 4.50 | 0.91 | 0.40, 2.08 | 0.91 | 0.34, 2.44 | 0.17 |
| Model 2 | 1.00 | Referent | 1.36 | 0.56, 3.31 | 1.64 | 0.69, 3.91 | 0.70 | 0.30, 1.63 | 0.58 | 0.21, 1.60 | 0.02 |
| Model 3 | 1.00 | Referent | 1.16 | 0.47, 2.87 | 1.48 | 0.61, 3.59 | 0.60 | 0.25, 1.42 | 0.50 | 0.18, 1.42 | 0.02 |
| Other causes | |||||||||||
| No. of deaths | 331 | 352 | 303 | 624 | 240 | ||||||
| Model 1 | 1.00 | Referent | 1.05 | 0.90, 1.23 | 0.87 | 0.74, 1.02 | 0.77 | 0.68, 0.88 | 0.82 | 0.69, 0.97 | <0.0001 |
| Model 2 | 1.00 | Referent | 0.99 | 0.85, 1.15 | 0.81 | 0.70, 0.95 | 0.67 | 0.59, 0.77 | 0.63 | 0.53, 0.75 | <0.0001 |
| Model 3 | 1.00 | Referent | 1.05 | 0.90, 1.23 | 0.91 | 0.77, 1.07 | 0.77 | 0.66, 0.89 | 0.71 | 0.59, 0.85 | <0.0001 |
Abbreviations: CI, confidence interval; HR, hazard ratio.
a Statistical tests were 2-sided, and P < 0.05 was interpreted as statistically significant.
b Results were adjusted for age and sex.
c Results were additionally adjusted for detailed smoking history (number of cigarettes smoked per day (≤10, 11–20, 21–40, ≥41), time of smoking cessation (>1–<5, 5–<10, 10–<20, or ≥20 years prior to study entry; persons who quit within 1 year of baseline were considered current smokers), age at smoking initiation (<15, 15–<20, 20–<25, or ≥25 years), use of pipes or cigars (never, former, or current use)).
d Results were additionally adjusted for race/ethnicity (non-Hispanic white, non-Hispanic black, Hispanic, or other), educational level (less than a high school education, high school graduate or equivalent, some post–high school education, or college graduate), marital status (married or living as married or not married), employment status (working or homemaker, unemployed, retired, extended sick leave or disabled, or other), presence or absence of diabetes, body mass index (weight (kg)/height (m)2; <18.5, 18.5–<25, 25–<30, 30–<35, or ≥35), any supplemental vitamin use in the previous 12 months (yes or no), regular ibuprofen use in the previous 12 months (yes or no), regular aspirin use in the previous 12 months (yes or no), receipt of menopausal hormone therapy (women only) (never, former, or current use), alcohol consumption (0, <1, 1–<3, or ≥3 drinks/day), total daily energy intake, and quintile of intake of daily red and processed meat, white meat (i.e., poultry and fish), saturated fat, fruits, and vegetables.
e For cancer, model 3 results were additionally adjusted for a history of cancer (other than nonmelanoma skin cancer) in a first-degree relative (yes or no).
f For diabetes, model 3 results were not adjusted for the presence or absence of self-reported diabetes.
g Nephritis, nephrotic syndrome, and nephrosis.
We observed similar associations among participants who always drank either caffeinated coffee or decaffeinated coffee (Figure 1). However, there were relatively few decaffeinated coffee drinkers in the cohort. Hazard ratio estimates for those who consumed only decaffeinated coffee were of similar magnitude and direction as those for total and caffeinated coffee intake but did not reach statistical significance. In analyses that included consumers of both caffeinated and decaffeinated coffee, inverse associations of decaffeinated coffee with overall and heart disease mortality were statistically significant (Table 4).
Figure 1.
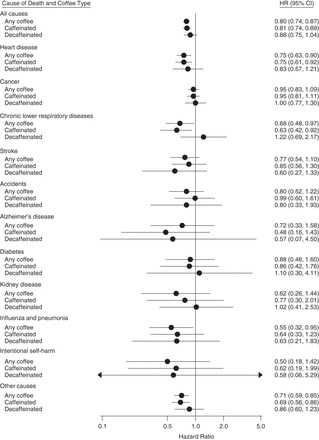
Associations of daily coffee intake (total, caffeinated only, and decaffeinated only) with overall and cause-specific mortality among participants who drank ≥4 cups/day as compared with non–coffee drinkers in the Prostate, Lung, Colorectal and Ovarian Cancer Screening Trial, 1998–2009. Hazard ratios (HRs) were adjusted for age, sex, detailed smoking history, race/ethnicity, educational level, marital status, employment status, presence or absence of diabetes, body mass index (weight (kg)/height (m)2), any supplemental vitamin use in the previous 12 months, regular ibuprofen use in the previous 12 months, regular aspirin use in the previous 12 months, receipt of menopausal hormone therapy (women only), alcohol consumption, total daily energy intake, and quintile of intake of daily red and processed meat, white meat (i.e., poultry and fish), saturated fat, fruits, and vegetables. HRs for cancer mortality were additionally adjusted for history of cancer (other than nonmelanoma skin cancer) in a first-degree relative. HRs for diabetes mortality were not adjusted for the presence or absence of self-reported diabetes. Because there were no deaths from kidney disease in the highest category (≥4-cups/day) of decaffeinated coffee consumption, the association for 2–3 cups/day (as compared with non–coffee drinking) is shown. Statistical tests were 2-sided, and P < 0.05 was interpreted as statistically significant. Bars, CI, confidence intervals (CIs).
Table 4.
Associationsa Between Daily Caffeinated and Decaffeinated Coffee Intake and Mortality in the Prostate, Lung, Colorectal and Ovarian Cancer Screening Trial, 1998–2009b
| Cause of Death and Coffee Type |
Coffee Consumption, cups/day |
P for Trendc | |||||||||
|---|---|---|---|---|---|---|---|---|---|---|---|
| 0 |
<1 |
1 |
2–3 |
≥4 |
|||||||
| HR | 95% CI | HR | 95% CI | HR | 95% CI | HR | 95% CI | HR | 95% CI | ||
| All causes | |||||||||||
| Any coffee | 1.00 | Referent | 0.99 | 0.92, 1.07 | 0.94 | 0.87, 1.02 | 0.82 | 0.77, 0.88 | 0.80 | 0.74, 0.87 | <0.0001 |
| Caffeinated coffee | 1.00 | Referent | 1.05 | 0.98, 1.13 | 0.87 | 0.81, 0.93 | 0.83 | 0.78, 0.89 | 0.80 | 0.74, 0.88 | <0.0001 |
| Decaffeinated coffee | 1.00 | Referent | 0.90 | 0.84, 0.96 | 0.85 | 0.79, 0.91 | 0.88 | 0.81, 0.95 | 0.84 | 0.72, 0.98 | 0.0005 |
| Heart disease | |||||||||||
| Any coffee | 1.00 | Referent | 1.00 | 0.85, 1.18 | 0.81 | 0.68, 0.96 | 0.74 | 0.64, 0.86 | 0.75 | 0.63, 0.90 | <0.0001 |
| Caffeinated coffee | 1.00 | Referent | 1.04 | 0.89, 1.21 | 0.78 | 0.67, 0.91 | 0.76 | 0.66, 0.87 | 0.79 | 0.66, 0.96 | 0.005 |
| Decaffeinated coffee | 1.00 | Referent | 0.85 | 0.74, 0.98 | 0.81 | 0.69, 0.96 | 0.77 | 0.64, 0.92 | 0.75 | 0.52, 1.07 | 0.009 |
| Cancerd | |||||||||||
| Any coffee | 1.00 | Referent | 0.93 | 0.81, 1.07 | 1.05 | 0.92, 1.20 | 0.95 | 0.84, 1.06 | 0.95 | 0.83, 1.09 | 0.47 |
| Caffeinated coffee | 1.00 | Referent | 1.04 | 0.93, 1.18 | 1.02 | 0.91, 1.14 | 0.95 | 0.86, 1.06 | 0.96 | 0.84, 1.17 | 0.35 |
| Decaffeinated coffee | 1.00 | Referent | 0.96 | 0.86, 1.07 | 0.98 | 0.87, 1.10 | 0.99 | 0.87, 1.13 | 0.98 | 0.87, 1.13 | 0.77 |
| Chronic lower respiratory diseases | |||||||||||
| Any coffee | 1.00 | Referent | 0.93 | 0.64, 1.35 | 0.73 | 0.48, 1.08 | 0.78 | 0.57, 1.08 | 0.68 | 0.48, 0.97 | 0.04 |
| Caffeinated coffee | 1.00 | Referent | 1.15 | 0.82, 1.62 | 0.79 | 0.56, 1.10 | 0.90 | 0.68, 1.19 | 0.69 | 0.49, 0.97 | 0.07 |
| Decaffeinated coffee | 1.00 | Referent | 0.83 | 0.60, 1.15 | 0.77 | 0.54, 1.08 | 0.84 | 0.60, 1.19 | 1.23 | 0.73, 2.08 | 0.99 |
| Stroke | |||||||||||
| Any coffee | 1.00 | Referent | 0.89 | 0.65, 1.22 | 0.88 | 0.64, 1.21 | 0.68 | 0.51, 0.91 | 0.77 | 0.54, 1.10 | 0.06 |
| Caffeinated coffee | 1.00 | Referent | 1.01 | 0.76, 1.34 | 0.62 | 0.46, 0.84 | 0.68 | 0.51, 0.91 | 0.86 | 0.58, 1.37 | 0.04 |
| Decaffeinated coffee | 1.00 | Referent | 1.04 | 0.79, 1.36 | 1.21 | 0.91, 1.62 | 0.92 | 0.65, 1.30 | 0.65 | 0.30, 1.40 | 0.52 |
| Accidents | |||||||||||
| Any coffee | 1.00 | Referent | 0.93 | 0.62, 1.38 | 0.94 | 0.63, 1.41 | 0.91 | 0.64, 1.29 | 0.80 | 0.52, 1.22 | 0.32 |
| Caffeinated coffee | 1.00 | Referent | 0.94 | 0.65, 1.35 | 0.84 | 0.59, 1.19 | 0.89 | 0.64, 1.24 | 0.91 | 0.56, 1.43 | 0.61 |
| Decaffeinated coffee | 1.00 | Referent | 1.04 | 0.74, 1.45 | 0.95 | 0.66, 1.38 | 0.85 | 0.55, 1.31 | 0.88 | 0.38, 2.04 | 0.52 |
| Alzheimer's disease | |||||||||||
| Any coffee | 1.00 | Referent | 1.01 | 0.53, 1.95 | 0.66 | 0.32, 1.36 | 0.59 | 0.31, 1.11 | 0.72 | 0.33, 1.58 | 0.20 |
| Caffeinated coffee | 1.00 | Referent | 1.36 | 0.70, 2.65 | 1.34 | 0.73, 2.47 | 0.94 | 0.50, 1.77 | 0.60 | 0.21, 1.69 | 0.38 |
| Decaffeinated coffee | 1.00 | Referent | 0.75 | 0.42, 1.36 | 0.39 | 0.16, 0.92 | 0.81 | 0.37, 1.79 | 0.54 | 0.07, 4.03 | 0.20 |
| Diabetese | |||||||||||
| Any coffee | 1.00 | Referent | 1.90 | 0.17, 3.10 | 1.38 | 0.81, 2.36 | 0.79 | 0.48, 1.32 | 0.88 | 0.48, 1.60 | 0.01 |
| Caffeinated coffee | 1.00 | Referent | 1.79 | 0.16, 2.78 | 1.04 | 0.64, 1.70 | 0.67 | 0.41, 1.11 | 0.80 | 0.42, 1.53 | 0.02 |
| Decaffeinated coffee | 1.00 | Referent | 0.98 | 0.65, 1.48 | 0.70 | 0.40, 1.23 | 0.96 | 0.53, 1.74 | 0.90 | 0.28, 2.96 | 0.28 |
| Kidney diseasef | |||||||||||
| Any coffee | 1.00 | Referent | 1.07 | 0.54, 2.12 | 1.72 | 0.92, 3.23 | 1.05 | 0.57, 1.93 | 0.62 | 0.26, 1.44 | 0.13 |
| Caffeinated coffee | 1.00 | Referent | 1.29 | 0.69, 2.39 | 1.53 | 0.89, 2.62 | 0.75 | 0.41, 1.36 | 0.68 | 0.28, 1.64 | 0.25 |
| Decaffeinated coffee | 1.00 | Referent | 0.63 | 0.35, 1.12 | 0.77 | 0.42, 1.44 | 0.86 | 0.41, 1.81 | 0.17 | ||
| Influenza and pneumonia | |||||||||||
| Any coffee | 1.00 | Referent | 1.00 | 0.63, 1.59 | 1.11 | 0.70, 1.75 | 0.82 | 0.54, 1.25 | 0.55 | 0.32, 0.95 | 0.01 |
| Caffeinated coffee | 1.00 | Referent | 0.88 | 0.56, 1.39 | 0.98 | 0.66, 1.46 | 0.64 | 0.42, 0.96 | 0.51 | 0.28, 0.94 | 0.03 |
| Decaffeinated coffee | 1.00 | Referent | 0.72 | 0.48, 1.08 | 0.76 | 0.48, 1.19 | 0.83 | 0.50, 1.35 | 0.59 | 0.21, 1.66 | 0.37 |
| Intentional self-harm | |||||||||||
| Any coffee | 1.00 | Referent | 1.16 | 0.47, 2.87 | 1.48 | 0.61, 3.59 | 0.60 | 0.25, 1.42 | 0.50 | 0.18, 1.42 | 0.02 |
| Caffeinated coffee | 1.00 | Referent | 1.32 | 0.60, 2.87 | 1.26 | 0.60, 2.65 | 0.51 | 0.23, 1.17 | 0.56 | 0.20, 1.57 | 0.07 |
| Decaffeinated coffee | 1.00 | Referent | 0.83 | 0.42, 1.62 | 0.28 | 0.08, 0.92 | 0.77 | 0.30, 1.96 | 0.52 | 0.07, 4.07 | 0.20 |
| Other causes | |||||||||||
| Any coffee | 1.00 | Referent | 1.05 | 0.90, 1.23 | 0.91 | 0.77, 1.07 | 0.77 | 0.66, 0.89 | 0.71 | 0.59, 0.85 | <0.0001 |
| Caffeinated coffee | 1.00 | Referent | 1.02 | 0.88, 1.18 | 0.74 | 0.63, 0.86 | 0.79 | 0.69, 0.90 | 0.65 | 0.53, 0.79 | <0.0001 |
| Decaffeinated coffee | 1.00 | Referent | 0.86 | 0.75, 0.98 | 0.68 | 0.58, 0.81 | 0.83 | 0.70, 0.99 | 0.76 | 0.54, 1.07 | 0.02 |
Abbreviations: CI, confidence interval; HR, hazard ratio.
a Results were adjusted for age, sex, detailed smoking history (number of cigarettes smoked per day (≤10, 11–20, 21–40, ≥41), time of smoking cessation (>1–<5, 5–<10, 10–<20, or ≥20 years prior to study entry; persons who quit within 1 year of baseline were considered current smokers), age at smoking initiation (<15, 15–<20, 20–<25, or ≥25 years), use of pipes or cigars (never, former, or current use)), race/ethnicity (non-Hispanic white, non-Hispanic black, Hispanic, or other), educational level (less than a high school education, high school graduate or equivalent, some post–high school education, or college graduate), marital status (married or living as married or not married), employment status (working or homemaker, unemployed, retired, extended sick leave or disabled, or other), presence or absence of diabetes, body mass index (weight (kg)/height (m)2; <18.5, 18.5–< 25, 25–<30, 30–<35, or ≥35), any supplemental vitamin use in the previous 12 months (yes or no), regular ibuprofen use in the previous 12 months (yes or no), regular aspirin use in the previous 12 months (yes or no), receipt of menopausal hormone therapy (women only) (never, former, or current use), alcohol consumption (0, <1, 1–<3, or ≥3 drinks/day), total daily energy intake, and quintile of intake of daily red and processed meat, white meat (i.e., poultry and fish), saturated fat, fruits, and vegetables. In models for caffeinated and decaffeinated coffee intake, results were additionally adjusted for consumption of the other type of coffee and missing data on coffee type.
b Additive models were used to mutually adjust for type of coffee intake.
c Statistical tests were 2-sided, and P < 0.05 was interpreted as statistically significant.
d Results were additionally adjusted for a history of cancer (other than nonmelanoma skin cancer) in a first-degree relative (yes or no).
e Results were not adjusted for the presence or absence of self-reported diabetes.
f Nephritis, nephrotic syndrome, and nephrosis.
Data on additives were assessed for coffee and tea together; however, the majority of coffee drinkers (88%) did not drink tea regularly. Hazard ratio estimates and trends in hazard ratios were similar across all additive subgroups (Table 5). On average, coffee drinkers who reported using cream or whole milk added approximately 1 tablespoon per day, and those who reported using sugar or honey added approximately 1.5 teaspoons per day.
Table 5.
Associationsa Between Daily Total Coffee Intake and Overall Mortality According to Use of Common Coffee Additives in the Prostate, Lung, Colorectal and Ovarian Cancer Screening Trial, 1998–2009
| Additive Subgroup | Total No. of Participants | No. of Deaths | Coffee Consumption, cups/day |
P for Trendb | |||||||
|---|---|---|---|---|---|---|---|---|---|---|---|
| <1 |
1 |
2–3 |
≥4 |
||||||||
| HR | 95% CI | HR | 95% CI | HR | 95% CI | HR | 95% CI | ||||
| Non–coffee drinker | 14,585 | 1,376 | 1.00 | Referent | 1.00 | Referent | 1.00 | Referent | 1.00 | Referent | |
| No additives in coffee | 27,713 | 2,845 | 1.05 | 0.94, 1.17 | 0.90 | 0.80, 1.01 | 0.84 | 0.77, 0.92 | 0.83 | 0.75, 0.92 | <0.0001 |
| Cream or whole milk only | 2,183 | 218 | 0.95 | 0.68, 1.33 | 1.20 | 0.89, 1.61 | 0.85 | 0.68, 1.06 | 0.69 | 0.49, 0.96 | 0.02 |
| Low-fat milk only | 2,424 | 227 | 0.92 | 0.67, 1.26 | 0.94 | 0.72, 1.23 | 0.78 | 0.63, 0.97 | 0.78 | 0.54, 1.11 | 0.02 |
| Nondairy creamer | 2,925 | 307 | 1.18 | 0.91, 1.53 | 1.13 | 0.89, 1.44 | 0.92 | 0.76, 1.11 | 0.70 | 0.50, 0.99 | 0.05 |
| Sugar or honey only | 5,968 | 607 | 0.82 | 0.66, 1.01 | 1.07 | 0.88, 1.30 | 0.87 | 0.76, 1.01 | 0.81 | 0.66, 0.99 | 0.02 |
| Sugar-free sweetener only | 2,533 | 264 | 1.15 | 0.89, 1.49 | 0.88 | 0.66, 1.18 | 0.84 | 0.69, 1.03 | 0.73 | 0.53, 1.01 | 0.01 |
| Lightener and sweetener | 21,537 | 1,980 | 0.97 | 0.87, 1.08 | 0.91 | 0.82, 1.02 | 0.80 | 0.72, 0.88 | 0.85 | 0.74, 0.97 | 0.0001 |
| Otherc | 10,449 | 894 | 0.94 | 0.80, 1.11 | 0.87 | 0.74, 1.03 | 0.73 | 0.65, 0.83 | 0.76 | 0.64, 0.91 | <0.0001 |
Abbreviations: CI, confidence interval; HR, hazard ratio.
a Results were adjusted for age, sex, detailed smoking history (number of cigarettes smoked per day (≤10, 11–20, 21–40, ≥41), time of smoking cessation (>1–<5, 5–<10, 10–<20, or ≥20 years prior to study entry; persons who quit within 1 year of baseline were considered current smokers), age at smoking initiation (<15, 15–<20, 20–<25, or ≥25 years), use of pipes or cigars (never, former, or current use)), race/ethnicity (non-Hispanic white, non-Hispanic black, Hispanic, or other), educational level (less than a high school education, high school graduate or equivalent, some post–high school education, or college graduate), marital status (married or living as married or not married), employment status (working or homemaker, unemployed, retired, extended sick leave or disabled, or other), presence or absence of diabetes, body mass index (weight (kg)/height (m)2; <18.5, 18.5–< 25, 25–<30, 30–< 35, or ≥35), any supplemental vitamin use in the previous 12 months (yes or no), regular ibuprofen use in the previous 12 months (yes or no), regular aspirin use in the previous 12 months (yes or no), receipt of menopausal hormone therapy (women only) (never, former, or current use), alcohol consumption (0, <1, 1–<3, or ≥3 drinks/day), total daily energy intake, and quintile of intake of daily red and processed meat, white meat (i.e., poultry and fish), saturated fat, fruits, and vegetables.
b Statistical tests were 2-sided, and P < 0.05 was interpreted as statistically significant.
c Other additives (e.g., condensed milk, rice milk, soy milk) and other combinations of additives.
We conducted further analyses stratified by factors associated with coffee consumption. As illustrated in Figure 2, hazard ratio estimates differed by smoking status (P for heterogeneity = 0.002), with a stronger inverse association among never smokers (P for trend < 0.0001) than among former smokers (P for trend = 0.01) and no association among current smokers (P for trend = 0.39). The downward trend in hazard ratio estimates with increasing coffee consumption appeared greater for events occurring within the first 4 years of follow-up (P for heterogeneity = 0.04), although inverse associations persisted in later years as well. Additionally, the inverse association appeared greater among participants with self-reported diabetes (P for heterogeneity = 0.04). The inverse association between coffee and overall mortality appeared generally consistent across examined strata of other covariates (all P's for heterogeneity > 0.10). Similar associations were observed in women and men. We present sex-specific results in Supplementary Data (available at http://aje.oxfordjournals.org/) for the purpose of comparison with prior studies which included only men or women or analyzed men and women separately.
Figure 2.

Associations of daily coffee intake with overall mortality among subgroups of participants (determined by important baseline factors) who drank ≥4 cups/day as compared with non–coffee drinkers in the Prostate, Lung, Colorectal and Ovarian Cancer Screening Trial, 1998–2009. Where applicable, hazard ratios (HRs) were adjusted for age, sex, detailed smoking history, race/ethnicity, educational level, marital status, employment status, presence or absence of diabetes, body mass index (weight (kg)/height (m)2), any supplemental vitamin use in the previous 12 months, regular ibuprofen use in the previous 12 months, regular aspirin use in the previous 12 months, receipt of menopausal hormone therapy (MHT; women only), alcohol consumption, total daily energy intake, and quintile of daily intake of red and processed meat, white meat (i.e., poultry and fish), saturated fat, fruits, and vegetables. Risk estimates for cancer mortality were additionally adjusted for history of cancer (other than nonmelanoma skin cancer) in a first-degree relative. Statistical tests were 2-sided, and P < 0.05 was interpreted as statistically significant. Nonsteroidal antiinflammatory drug (NSAID) use was defined as use of any product containing aspirin or ibuprofen. Bars, CI, confidence intervals (CIs).
Hazard ratio estimates were also similar after further exclusion of persons with a history of hypertension or gastrointestinal comorbidity (data not shown). Moreover, inclusion of participants with a history of cancer, coronary heart disease, heart attack, or stroke did not meaningfully alter the results, except for the association between coffee and kidney disease mortality, which became statistically significant (P for trend < 0.001) (Supplementary Data). Finally, hazard ratio estimates in the subset of participants for whom we had data on physical activity were similar following adjustment for physical activity (Supplementary Data).
DISCUSSION
Coffee drinking was inversely associated with overall mortality in this large, population-based cohort following adjustment for smoking history and other potential confounders. This association was largely due to inverse associations with several leading causes of death, including heart disease, chronic lower respiratory diseases, diabetes, influenza and pneumonia, and intentional self-harm. While we did not observe an association between coffee and cancer mortality, it is possible, given an average of 9 years of follow-up time, that the association between coffee drinking and cancers with a long duration between diagnosis and death (i.e., prostate cancer) could not be observed or that coffee reduces mortality risk for some cancers but not others. Although we lacked statistical power to observe modest associations among caffeine-type subgroups, hazard ratio estimates appeared similar in terms of magnitude and direction among caffeinated and decaffeinated coffee drinkers, as compared with non–coffee drinkers, suggesting that coffee constituents other than caffeine may contribute to the observed associations. In addition, hazard ratio estimates did not differ between persons who drank their coffee black and those who used common coffee additives, such as milk, cream, and sugar.
Coffee contains numerous biologically active compounds, including phenolic acids, potassium, and caffeine. Consequently, multiple mechanisms have been proposed to explain potential inverse associations of coffee with mortality and disease incidence. General hypotheses concern the potential effects of coffee on insulin sensitivity, liver function, and chronic inflammation. Higher levels of coffee drinking have been associated with improved insulin sensitivity (28), as well as lower levels of liver enzymes (29) and inflammatory markers. Despite biological plausibility, other possible explanations for the observed associations of coffee drinking with mortality include chance, confounding by unmeasured or poorly measured risk factors, and reverse causality.
We conducted subgroup analyses to better understand potential effect modification. We found that associations were generally similar across strata. In the case of smoking, the association was greatest among never smokers, suggesting that residual confounding by smoking status, if it occurred, may have actually attenuated coffee-mortality associations. The prospective nature of our study argues against reverse causality; nevertheless, participants in poor health, especially those with hypertension or gastrointestinal comorbidity, may have altered their coffee consumption habits in the year prior to completing the DHQ. Therefore, we excluded participants with a history of cancer, coronary heart disease, heart attack, or stroke and adjusted for employment status. In a sensitivity analysis, we further excluded persons with a history of hypertension or gastrointestinal comorbidity and found similar results. A fraction of participants reported their medical history prior to coffee intake, which could have contributed to reverse causation. However, inverse associations between coffee and mortality persisted, albeit attenuated, when deaths occurring within the first 4 or 8 years of follow-up were excluded.
Our results for overall mortality are consistent with 2 recent meta-analyses, which found summary relative risk estimates of 0.82 (95% confidence interval (CI): 0.78, 0.86) for 4 cups of coffee per day relative to non–coffee drinking (17) and 0.88 (95% CI: 0.84, 0.93) for comparison of the study-specific highest category of coffee consumption with ≤1 cup/day (13). Also consistent with our findings, both of these meta-analyses found suggestive evidence of an inverse association between coffee and cardiovascular disease mortality but no evidence of an association with cancer mortality (13, 17).
Liu et al. (14) recently reported a positive association between coffee consumption of >28 cups/week and risk of death among men and women below the age of 55 years. Adults under 55 years of age were not eligible for the PLCO study. We observed no association between coffee and overall mortality among participants under 60 years of age, but few deaths occurred in this subgroup. Besides differences in age distribution and chance, the discrepant results may have been due to differences in adjustment for smoking. Future studies with younger populations are needed to further explore whether age modifies the association between coffee and mortality.
The PLCO Cancer Screening Trial is one of a few prospective studies to have considered causes of death beyond composite measures of cardiovascular disease and cancer. Consistent with our findings, Freedman et al. observed that coffee was inversely associated with deaths due to heart disease, respiratory disease, and diabetes (15). Coffee has been consistently linked to a lower hazard ratio for incident type 2 diabetes (5, 30). Experimental and observational evidence suggests an association between coffee and improved lung function (31), and theophylline, a metabolite of caffeine, is used to treat symptoms associated with various lung diseases (32). The association between coffee and risk of coronary heart disease continues to be debated (4) because of inconsistent results derived by varying study designs (33, 34), as well as small experimental studies showing that acute intake of coffee and caffeine can increase blood pressure (35) and adversely affect endothelial function (36). Evidence suggests that cafestol, found mainly in unfiltered coffee, is associated with higher total cholesterol levels (37). Hazard ratio estimates for coffee drinking and stroke mortality, in our study, were below 1 and borderline significant (P for trend = 0.06). Associations between coffee drinking and stroke incidence have been observed in some but not all prospective studies (15, 38). We also observed an inverse association between coffee and intentional self-harm similar to that reported for suicide in previous prospective studies (18, 39). While the mechanisms underlying this association are unclear, higher coffee consumption has been associated with lower relative risk of depression (40, 41).
Strengths of this study include the distinction between caffeinated and decaffeinated coffee intake and the analysis of common coffee additives. Although similar associations were observed for coffee additive subgroups, coffee drinkers should follow current dietary guidelines to limit their intake of calories from solid fats and added sugars. In future studies, investigators should also consider the question of coffee additives, as generational differences in usual coffee consumption habits have probably occurred.
Limitations of this study include the assessment of coffee consumption at only 1 point in time; however, among participants in the intervention arm who completed 2 food frequency questionnaires, the correlation between reports of coffee consumption was strong (Spearman correlation coefficient =0.76, P < 0.0001). Additionally, preparation methods may meaningfully alter the chemical composition of coffee, but we lacked this information. In future research, investigators should quantify variation in bioactive components according to preparation method. Another potential limitation is that we relied on death certificates, which may be unreliable, to assign causes of death. The PLCO cohort was older and predominately non-Hispanic white. Consequently, our results may not be generalizable to other populations. Finally, the PLCO cohort lacked data on genetic factors, such as cytochrome P-450 1A2 (CYP1A2) genotype, that may influence individual consumption of coffee as well as its physiological effects (42).
In summary, we observed an inverse association between coffee consumption and overall mortality that was consistent across most examined subgroups. Additional experimental and observational studies are needed to better understand the potential mechanisms underlying the observed associations. Although our results may provide reassurance to coffee drinkers, they are based on observational data and should be interpreted with caution.
Supplementary Material
ACKNOWLEDGMENTS
Author affiliations: Division of Cancer Epidemiology and Genetics, National Cancer Institute, Bethesda, Maryland (Erikka Loftfield, Neal D. Freedman, Barry I. Graubard, Kristin A. Guertin, Amanda Black, Wen-Yi Huang, Rashmi Sinha); Department of Chronic Disease Epidemiology, Yale School of Public Health, New Haven, Connecticut (Erikka Loftfield, Fatma M. Shebl, Susan T. Mayne); Yale Cancer Center, New Haven, Connecticut (Fatma M. Shebl, Susan T. Mayne); and Center for Food Safety and Applied Nutrition, Food and Drug Administration, US Department of Health and Human Services, College Park, Maryland (Susan T. Mayne).
This study was supported in part by a Yale–National Cancer Institute predoctoral training grant (grant T32 CA105666) to S.T.M. and by the Intramural Research Program of the National Institutes of Health, National Cancer Institute.
Portions of this paper were presented at the 48th Annual Meeting of the Society for Epidemiologic Research, Denver, Colorado, June 16–19, 2015.
The opinions and conclusions expressed in this article are solely the views of the author(s) and do not necessarily reflect those of the National Cancer Institute or the Food and Drug Administration.
Conflict of interest: none declared.
REFERENCES
- 1. National Coffee Association. National Coffee Drinking Trends. New York, NY: National Coffee Association; 2014. [Google Scholar]
- 2. Coffee drinking and acute myocardial infarction: report from the Boston Collaborative Drug Surveillance Program. Lancet. 1972;27790:1278–1281. [PubMed] [Google Scholar]
- 3. Jick H, Miettinen OS, Neff RK et al. . Coffee and myocardial infarction. N Engl J Med. 1973;2892:63–67. [DOI] [PubMed] [Google Scholar]
- 4. Wu JN, Ho SC, Zhou C et al. . Coffee consumption and risk of coronary heart diseases: a meta-analysis of 21 prospective cohort studies. Int J Cardiol. 2009;1373:216–225. [DOI] [PubMed] [Google Scholar]
- 5. Huxley R, Lee CM, Barzi F et al. . Coffee, decaffeinated coffee, and tea consumption in relation to incident type 2 diabetes mellitus: a systematic review with meta-analysis. Arch Intern Med. 2009;16922:2053–2063. [DOI] [PubMed] [Google Scholar]
- 6. Liu R, Guo X, Park Y et al. . Caffeine intake, smoking, and risk of Parkinson disease in men and women. Am J Epidemiol. 2012;17511:1200–1207. [DOI] [PMC free article] [PubMed] [Google Scholar]
- 7. Je Y, Giovannucci E. Coffee consumption and risk of endometrial cancer: findings from a large up-to-date meta-analysis. Int J Cancer. 2012;1317:1700–1710. [DOI] [PubMed] [Google Scholar]
- 8. Gunter MJ, Schaub JA, Xue X et al. . A prospective investigation of coffee drinking and endometrial cancer incidence. Int J Cancer. 2012;1314:E530–E536. [DOI] [PMC free article] [PubMed] [Google Scholar]
- 9. Lai GY, Weinstein SJ, Albanes D et al. . The association of coffee intake with liver cancer incidence and chronic liver disease mortality in male smokers. Br J Cancer. 2013;1095:1344–1351. [DOI] [PMC free article] [PubMed] [Google Scholar]
- 10. Sang LX, Chang B, Li XH et al. . Consumption of coffee associated with reduced risk of liver cancer: a meta-analysis. BMC Gastroenterol. 2013;13:34. [DOI] [PMC free article] [PubMed] [Google Scholar]
- 11. Tang N, Wu Y, Ma J et al. . Coffee consumption and risk of lung cancer: a meta-analysis. Lung Cancer. 2010;671:17–22. [DOI] [PubMed] [Google Scholar]
- 12. Sinha R, Cross AJ, Daniel CR et al. . Caffeinated and decaffeinated coffee and tea intakes and risk of colorectal cancer in a large prospective study. Am J Clin Nutr. 2012;962:374–381. [DOI] [PMC free article] [PubMed] [Google Scholar]
- 13. Malerba S, Turati F, Galeone C et al. . A meta-analysis of prospective studies of coffee consumption and mortality for all causes, cancers and cardiovascular diseases. Eur J Epidemiol. 2013;287:527–539. [DOI] [PubMed] [Google Scholar]
- 14. Liu J, Sui X, Lavie CJ et al. . Association of coffee consumption with all-cause and cardiovascular disease mortality. Mayo Clin Proc. 2013;8810:1066–1074. [DOI] [PMC free article] [PubMed] [Google Scholar]
- 15. Freedman ND, Park Y, Abnet CC et al. . Association of coffee drinking with total and cause-specific mortality. N Engl J Med. 2012;36620:1891–1904. [DOI] [PMC free article] [PubMed] [Google Scholar]
- 16. Je Y, Giovannucci E. Coffee consumption and total mortality: a meta-analysis of twenty prospective cohort studies. Br J Nutr. 2014;1117:1162–1173. [DOI] [PubMed] [Google Scholar]
- 17. Crippa A, Discacciati A, Larsson SC et al. . Coffee consumption and mortality from all causes, cardiovascular disease, and cancer: a dose-response meta-analysis. Am J Epidemiol. 2014;1808:763–775. [DOI] [PubMed] [Google Scholar]
- 18. Kawachi I, Willett WC, Colditz GA et al. . A prospective study of coffee drinking and suicide in women. Arch Intern Med. 1996;1565:521–525. [PubMed] [Google Scholar]
- 19. Prorok PC, Andriole GL, Bresalier RS et al. . Design of the Prostate, Lung, Colorectal and Ovarian (PLCO) Cancer Screening Trial. Control Clin Trials. 2000;21(6 suppl):273S–309S. [DOI] [PubMed] [Google Scholar]
- 20. Hayes RB, Sigurdson A, Moore L et al. . Methods for etiologic and early marker investigations in the PLCO trial. Mutat Res. 2005;592(1-2):147–154. [DOI] [PubMed] [Google Scholar]
- 21. Subar AF, Ziegler RG, Thompson FE et al. . Is shorter always better? Relative importance of questionnaire length and cognitive ease on response rates and data quality for two dietary questionnaires. Am J Epidemiol. 2001;1534:404–409. [DOI] [PubMed] [Google Scholar]
- 22. Willett WC, Sampson L, Stampfer MJ et al. . Reproducibility and validity of a semiquantitative food frequency questionnaire. Am J Epidemiol. 1985;1221:51–65. [DOI] [PubMed] [Google Scholar]
- 23. Block G, Hartman AM, Dresser CM et al. . A data-based approach to diet questionnaire design and testing. Am J Epidemiol. 1986;1243:453–469. [DOI] [PubMed] [Google Scholar]
- 24. National Center for Health Statistics. Deaths: Leading Causes for 2010. Hyattsville, MD: National Center for Health Statistics; 2013. (National Vital Statistics Reports, vol. 62, no. 6) (DHHS publication no. (PHS) 2014-1120). [PubMed] [Google Scholar]
- 25. National Center for Health Statistics. Comparability of Cause of Death Between ICD-9 and ICD-10: Preliminary Estimates. Hyattsville, MD: National Center for Health Statistics; 2001. (National Vital Statistics Reports, vol. 49, no. 2) (DHHS publication no. (PHS) 2001-1120). [PubMed] [Google Scholar]
- 26. Subar AF, Midthune D, Kulldorff M et al. . Evaluation of alternative approaches to assign nutrient values to food groups in food frequency questionnaires. Am J Epidemiol. 2000;1523:279–286. [DOI] [PubMed] [Google Scholar]
- 27. Agricultural Research Service, US Department of Agriculture. Design and Operation: The Continuing Survey of Food Intakes by Individuals and the Diet and Health Knowledge Survey, 1994–96. Washington, DC: US Department of Agriculture; 1997. (Nationwide Food Surveys Report no. 96-1). [Google Scholar]
- 28. Arnlöv J, Vessby B, Risérus U. Coffee consumption and insulin sensitivity. JAMA. 2004;29110:1199–1201. [DOI] [PubMed] [Google Scholar]
- 29. Xiao Q, Sinha R, Graubard BI et al. . Inverse associations of total and decaffeinated coffee with liver enzyme levels in National Health and Nutrition Examination Survey 1999–2010. Hepatology. 2014;606:2091–2098. [DOI] [PMC free article] [PubMed] [Google Scholar]
- 30. van Dam RM, Hu FB. Coffee consumption and risk of type 2 diabetes: a systematic review. JAMA. 2005;2941:97–104. [DOI] [PubMed] [Google Scholar]
- 31. Nettleton JA, Follis JL, Schabath MB. Coffee intake, smoking, and pulmonary function in the Atherosclerosis Risk in Communities Study. Am J Epidemiol. 2009;16912:1445–1453. [DOI] [PMC free article] [PubMed] [Google Scholar]
- 32. Aubier M. Effect of theophylline on diaphragmatic and other skeletal muscle function. J Allergy Clin Immunol. 1986;784:787–792. [DOI] [PubMed] [Google Scholar]
- 33. Ding M, Bhupathiraju SN, Satija A et al. . Long-term coffee consumption and risk of cardiovascular disease: a systematic review and a dose-response meta-analysis of prospective cohort studies. Circulation. 2014;1296:643–659. [DOI] [PMC free article] [PubMed] [Google Scholar]
- 34. Greenland S. A meta-analysis of coffee, myocardial infarction, and coronary death. Epidemiology. 1993;44:366–374. [DOI] [PubMed] [Google Scholar]
- 35. Nurminen ML, Niittynen L, Korpela R et al. . Coffee, caffeine and blood pressure: a critical review. Eur J Clin Nutr. 1999;5311:831–839. [DOI] [PubMed] [Google Scholar]
- 36. Papamichael CM, Aznaouridis KA, Karatzis EN et al. . Effect of coffee on endothelial function in healthy subjects: the role of caffeine. Clin Sci (Lond). 2005;1091:55–60. [DOI] [PubMed] [Google Scholar]
- 37. Urgert R, Katan MB. The cholesterol-raising factor from coffee beans. Annu Rev Nutr. 1997;17:305–324. [DOI] [PubMed] [Google Scholar]
- 38. Larsson SC, Orsini N. Coffee consumption and risk of stroke: a dose-response meta-analysis of prospective studies. Am J Epidemiol. 2011;1749:993–1001. [DOI] [PubMed] [Google Scholar]
- 39. Klatsky AL, Armstrong MA, Friedman GD. Coffee, tea, and mortality. Ann Epidemiol. 1993;34:375–381. [DOI] [PubMed] [Google Scholar]
- 40. Lucas M, Mirzaei F, Pan A et al. . Coffee, caffeine, and risk of depression among women. Arch Intern Med. 2011;17117:1571–1578. [DOI] [PMC free article] [PubMed] [Google Scholar]
- 41. Ruusunen A, Lehto SM, Tolmunen T et al. . Coffee, tea and caffeine intake and the risk of severe depression in middle-aged Finnish men: the Kuopio Ischaemic Heart Disease Risk Factor Study. Public Health Nutr. 2010;138:1215–1220. [DOI] [PubMed] [Google Scholar]
- 42. Cornelis MC, Byrne EM, Esko T et al. . Genome-wide meta-analysis identifies six novel loci associated with habitual coffee consumption. Mol Psychiatry. 2015;205:647–656. [DOI] [PMC free article] [PubMed] [Google Scholar]
Associated Data
This section collects any data citations, data availability statements, or supplementary materials included in this article.