Abstract
The interpatient variability in response to asthma controllers is significant and associates with pharmacogenomic variability. The goal of the present study was to identify novel variants that associate with response to common asthma controllers: fluticasone, combination of fluticasone + salmeterol and montelukast with single nucleotide polymorphisms (SNPs) in β2-adrenergic receptor, corticosteroid and leukotriene pathway candidate genes. Participants in a large clinical trial of step-down strategies volunteered for this pharmacogenetic study. 169 SNPs in 26 candidate genes were genotyped in 189 Caucasian participants with asthma who took either fluticasone (100 μg bid), fluticasone (100 μg) + salmeterol (50 μg) (FP/Salm) or montelukast (5 or 10 mg) each night for 16 weeks. Primary outcomes were the slopes of plots of Asthma Control Questionnaire (ACQ) scores vs. time following randomization; and the percent change in percent predicted FEV1 (ΔFEV1%pred) from enrollment to the end of the study. Associations between SNPs and outcomes were analyzed using general linear models. False Discovery Rate and Bonferroni corrections were used to correct for multiple comparisons. In all, 16 SNPs in seven genes were significantly associated with outcomes. For FP/Salm, 3 SNPs in CHRM2 associated with ACQ slope (p=2.8×10⁻⁵), and rs1461496 in HSPA8 associated with ΔFEV1%pred. For fluticasone, 5 SNPs in CRHR1 (p=1.9×10⁻⁴), and 3 SNPs in COL2A1 associated with ACQ slope and ΔFEV1%pred, respectively. For montelukast, 4 SNPs in CHRM2 associated with ΔFEV1%pred and predicted an opposite effect compared to fluticasone (p=9×10⁻³). The present study indentified several novels SNPs that associate with response to common asthma controllers and support further pharmacogenomic study and the use of genetic variants to personalize asthma treatment.
Introduction
Asthma is a chronic complex disease characterized by variable and recurring symptoms, airflow obstruction, bronchial hyperresponsiveness and underlying inflammation. Asthma affects an estimated 20 million people in the US and 300 million people worldwide, and its prevalence is rising1. There are a number of different drugs and drug classes that can be categorized as either bronchodilators or as controllers, and are effective and generally safe in controlling asthma symptoms2. The three most common classes of asthma controllers include inhaled corticosteroids (lCS), ICS in combination with long acting beta agonists (LABA) (ICS + LABA), and leukotriene receptor antagonists (LTRA) either alone or in combination with lCS. Although effective, these drugs are associated with a significant degree of heterogeneity in patient response, which is due in large part to genetic variability3,4. This is known from evaluation of the repeatability of asthma treatment response2,5,6, which is defined as the proportion of variance in a trait (FEV1, asthma exacerbations) that occurs between rather than within individuals.
Consistent with this understanding of the genetic basis for response heterogeneity, several polymorphisms have been associated with response to ICS7,8, the combination of ICS and LABA9,10, and LTRAs11–13 in different studies. Knowledge of sequence variants that influence response to asthma controller drugs is important because it can lead to personalizing asthma therapy and the development of novel drugs. At present however, known sequence variants explain only a small fraction of the observed heterogeneity in response to asthma controller drugs. The goal of the present study was to identify novel variants that associate with response to common asthma controller drug therapy. A unique aspect of the present study is that we determine the pharmacogenetics of the 3 most common asthma controller drugs within the same study, providing a direct venue to compare pharmacogenetic response across therapies while increasing the specificity of our findings.
Methods
Study Design and Patients
The present pharmacogenetic study was ancillary to a large clinical trial entitled: The Leukotriene Modifier or Corticosteroid or Corticosteroid-Salmeterol Trial (LOCCS NCT00156819)14. Briefly, patients whose asthma was acceptably controlled with inhaled fluticasone proprionate (Flovent Diskus, Glaxo-SmithKline; 100 μg twice daily), were randomly assigned to receive double-blind treatment for 16 weeks with either continued inhaled fluticasone (100 μg twice daily), FP/Salm (100 μg fluticasone propionate + 50 μg salmeterol, Advair Diskus, Glaxo-SmithKline, once daily), or montelukast (Singulair, Merck and Co.; 6–14 years old, 5 mg chewable tablet; ≥15 years old, 10 mg capsule once daily). Acceptable control was defined as all of the following during the last two-weeks of the fluticasone treatment run-in period: pre-bronchodilator FEV1 > 80% predicted; Asthma Control Questionnaire (ACQ) score less than 1.5; rescue β2-agonist use less than 16 puffs per week (excluding use as a premedication for exercise, one nebulizer use was considered equivalent to 2 puffs of β2-agonist); no hospitalization or unscheduled medical care visit for asthma; no oral corticosteroid use; no need for any additional asthma medication for asthma symptoms. All centers that participated in this ancillary study received approval from the relevant institutional review boards and all participants gave written informed consent prior to participation14. Treatments are subsequently referred to as fluticasone, FP/Salm, or montelukast, respectively. In the present study we report data from Caucasians only (64 FP/Salm, 65 fluticasone, and 60 montelukast). Details of patient characteristics at enrollment and randomization from the parent trial can be found in the main manuscript14. In the parent trial, 64.2% of participants who received study treatment were Caucasian and 93.7% of those were non-Hispanic. Ethnicity of the participants in the pharmacogenomic study paralleled the parent trial with 68.4% being Causacian and of those 93.1% were non-Hispanic. Race or ethnic group was self-reported. A replicate cohort for the montelukast arm was obtained from a previous ALA-ACRC study15.
Outcomes
Two outcomes were considered: the slope of the least squares regression line fit to a plot of scores from the Asthma Control Questionnaire16 (ACQ) versus time at weeks 0, 2, 4, 8, 12, and 16 after randomization, and percent change in percent predicted FEV1 (pre-bronchodilator) from enrollment to the end of the study (ΔFEV1%pred), defined as (%predicted FEV1 (week 16) - %predicted FEV1 (enrollment) / %predicted FEV1 (enrollment)) × 100. Higher ACQ scores are indicative of asthma worsening. Predicted values for pulmonary function were calculated as described by Hankinson et al.17. Prior to pulmonary function testing, all participants were instructed to withhold short- and long-acting β2-agonist drugs for 4 and 12 hours, respectively. Recorded maneuvers had to meet criteria for acceptability (sharp start of flow volume curve; no cough within the first second; expiratory effort for at least 6 seconds) and reproducibility (the second largest FVC should be within 0.2 L of the largest acceptable FVC and the second largest FEV1 should be within 0.2 L of the largest acceptable FEV1). At least 3 acceptable and 2 reproducible efforts had to be obtained (up to a maximum of 8 attempts) and the largest FEV1 and FVC were recorded.
Genotyping
SNPs were genotyped by micro-sequencing of limited primer extension products as previously described8. P-values for deviation from Hardy-Weinberg equilibrium (HWE) between observed and expected genotype distributions were calculated using an exact test as described by Guo and Thompson18 (Table S2). For SNPs located on the X chromosome (CYSLTR1), HWE was determined in females. Linkage disequilibrium (LD) was assessed and displayed for the CEU population using Haploview19 (http://www.broadinstitute.org/haploview) and SNP Annotation and Proxy Search Version 2.220 (http://www.broadinstitute.org/mpg/snap/index.php).
Statistical Analyses
PASW Statistics release 17.0.3 (Aug 22, 2009) was used to perform basic statistical analyses. Homogeneity of baseline groups was assessed with Pearson’s X2 goodness-of-fit test21 for categorical variables, or with analysis of variance21 (ANOVA) for continuous variables (Table 1).
Table 1.
Baseline Characteristics of Study Participants
| Treatment Assignment*
|
P-value† | |||
|---|---|---|---|---|
| F/S | F | M | ||
| Number of participants | 64 | 65 | 60 | 0.46 |
| Mean age at randomization (years; SD) | 34.3(15.4) | 31.5(14.9) | 36.4(15.6) | 0.20 |
| Male (%) | 33 | 38 | 38 | 0.77 |
|
| ||||
| Smokers (> 20 packs per lifetime, %) | 38 | 11 | 22 | 0.001 |
| Mean pack-years (years; SD) | 5.7(5.2) | 8.6(6.0) | 5.8(4.3) | 0.41 |
|
| ||||
| Asthma characteristics | ||||
| Mean age at onset of asthma (years; SD) | 17.6(18.7) | 20.5(27.1) | 17.8(19.2) | 0.71 |
| ≥1 emergency visits for asthma in the previous year | 38 | 26 | 27 | 0.27 |
| ≥1 course of oral corticosteroids in the previous year | 33 | 21 | 25 | 0.31 |
| Use of rescue inhaler >1 time per week (%) | 59 | 70 | 68 | 0.41 |
| On inhaled corticosteroids at baseline (%) | 27 | 27 | 28 | 0.98 |
|
| ||||
| Asthma Control Scores (Mean±SD)‡ | ||||
| ACQ at enrollment | 1.77(0.76) | 1.74(0.73) | 1.8(0.90) | 0.87 |
| ACQ at randomization | 0.75(0.38) | 0.70(0.34) | 0.72(0.41) | 0.71 |
| ASUI at randomization | 0.89(0.08) | 0.88(0.09) | 0.88(0.11) | 0.72 |
|
| ||||
| Pulmonary Function (Pre-Bronchodilator, Mean±SD)§ | ||||
| Peak Flow at enrollment (L/min) | 407(124) | 382(111) | 400(108) | 0.45 |
| Peak Flow at randomization (L/min) | 412(109) | 398(105) | 422(109) | 0.48 |
| FVC at enrollment (L) | 3.88(1.04) | 3.74(1.11) | 3.86(1.13) | 0.72 |
| FVC at randomization (L) | 4.03(1.07) | 3.94(1.09) | 4.05(1.20) | 0.83 |
| FEV1 at enrollment (L) | 2.82(0.79) | 2.75(0.78) | 2.80(0.75) | 0.86 |
| FEV1 at randomization (L) | 3.01(0.80) | 3.00(0.78) | 3.05(0.79) | 0.92 |
| % Predicted FEV1 at enrollment|| | 84.1(12.0) | 84.1(12.8) | 83.2(11.2) | 0.89 |
| % Predicted FEV1 at randomization|| | 89.4(9.7) | 91.7(8.9) | 90.8(10.2) | 0.38 |
F/S, combination of fluticasone and salmeterol ; F, fluticasone; M, montelukast
P-values were derived from a Pearson’s Χ2 goodness-of-fit test for categorical variables and from ANOVA for continuous variables21.
ACQ, Asthma Control Questionnaire; ASUI, Asthma Symptom Utility Index
FVC, forced vital capacity; FEV1, forced expiratory volume in 1 second
Predicted values for pulmonary function were calculated as described by Hankinson et al.17.
Association Analyses
We tested associations between individual SNPs and outcome phenotypes stratified by treatment using general linear models as previously described8. The effect size was then calculated as the slope of the line between the adjusted means of the response variable for each genotype. Each model was adjusted for age, gender, height, and height2. All analyses were performed in SAS V.9 (SAS Institute, Cary, NC).
To compensate for the effects of multiple comparisons, we used the False Discovery Rate (FDR) method of Storey and Tibshirani22,23 as implemented in the R Statistical Package24 computer program QVALUE23. We chose to limit the number of estimated false positives to <1 within the results that are called significant. Additionally, we calculated the threshold P-value for association significance using the Bonferroni correction21, which was 3.01×10⁻⁴.
Results
Baseline Characteristics of Participants
Baseline characteristics of the Caucasian patients who participated in this study (189 total: 64 FP/Salm, 65 fluticasone, and 60 montelukast) were not significantly different between the treatment groups (Table 1). The one notable exception was the frequency of smoking, with significantly fewer individuals in the fluticasone treatment group having ever smoked, although total pack years was consistent among smokers of all treatment groups. This pattern was also evident in the clinical trial14.
Marker Associations with Pharmacodynamic Outcomes
In total, 169 markers were genotyped in 26 candidate genes in the β2-adrenergic, corticosteroid and leukotriene pathways (Table E1 & Table E2). Three of the markers were monomorphic in our population and were not analyzed further. Genotype frequencies for 5 markers were not in HWE (p<0.05) including rs706765 in CPAMD8, rs1876831 in CRHR1, rs12319274 in HAL, rs2540483 in LTA4H, and rs7941773 in STIP. Of these only rs1876831 was found to be significantly associated with outcomes. The significant associations (16 markers in 7 genes) are summarized in Table 2.
Table 2.
Summary of Significant Associations Between Outcomes and Genotypes of SNPs in Candidate Genes.
| Treatment | Outcome* | Locus | Marker | N (MM, mM, mm) | Effect Size (SE)¶ | P-value† | MAF | Function |
|---|---|---|---|---|---|---|---|---|
| Combination | ΔFEV1%pred§ | HSPA8 | rs1461496 | 61 (24, 30, 7) | 8.41 (2.62) | 1.28x10⁻³ | 0.308 | intron |
|
| ||||||||
| ACQ slope§ | CHRM2 | rs8191992 | 61 (18, 29, 14) | 2.45x10⁻² (6.26x10⁻³) | 8.92x10⁻⁵‡ | 0.435 | untranslated-3' | |
| CHRM2 | rs6962027 | 61 (17, 28, 16) | 2.52x10⁻² (6.04x10⁻³) | 2.98x10⁻⁵‡ | 0.431 | near-gene-3' | ||
| CHRM2 | rs6967953 | 61 (17, 28, 16) | 2.56x10⁻² (6.11x10⁻³) | 2.81x10⁻⁵‡ | 0.420 | unknown | ||
| ABCC1 | rs119774 | 61 (52, 9, 0) | 3.57x10⁻² (1.36x10⁻²) | 8.69x10⁻³ | 0.043 | intron | ||
|
| ||||||||
| Fluticasone | ΔFEV1%pred§ | CRHR1 | rs242941 | 64 (34, 26, 4) | −9.98 (3.24) | 2.07x10⁻³ | 0.341 | intron |
| CRHR1 | rs739645 | 63 (36, 19, 8) | 1.03x101 (2.82) | 2.61x10⁻⁴‡ | 0.156 | intron | ||
| CRHR1 | rs1876831 | 64 (37, 19, 8) | 1.04x101 (2.79) | 1.89x10⁻⁴‡ | 0.159 | intron | ||
| CRHR1 | rs1876829 | 63 (36, 19, 8) | 1.03x101 (2.82) | 2.62x10⁻⁴‡ | 0.156 | intron | ||
| CRHR1 | rs1876828 | 64 (37, 19, 8) | 1.04x101 (2.79) | 1.89x10⁻⁴‡ | 0.154 | intron | ||
| HAL | rs17024981 | 64 (56, 8, 0) | 2.15x101 (6.22) | 5.46x10⁻⁴ | 0.078 | intron | ||
|
| ||||||||
| ΔFEV1%pred|| | COL2A1 | rs2276458 | 64 (15, 37, 12) | −1.71x101 (6.00) | 4.25x10⁻³ | 0.347 | intron | |
| COL2A1 | rs2276455 | 63 (17, 34, 12) | −1.71x101 (6.00 ) | 4.25x10⁻³ | 0.400 | intron | ||
| COL2A1 | rs2276454 | 64 (17, 34, 13) | −1.71x101 (6.04) | 4.61x10⁻³ | 0.412 | coding-synon | ||
|
| ||||||||
| Montelukast | ΔFEV1%pred§ | CRHR1 | rs739645 | 54 (34, 17, 3) | −6.26 (2.38) | 8.61x10⁻³ | 0.156 | intron |
| CRHR1 | rs1876831 | 54 (34, 16, 4) | −6.26 (2.38) | 8.61x10⁻³ | 0.159 | intron | ||
| CRHR1 | rs1876829 | 54 (34, 17, 3) | −6.26 (2.38) | 8.61x10⁻³ | 0.156 | intron | ||
| CRHR1 | rs1876828 | 53 (34, 16, 3) | −6.26 (2.38) | 8.61x10⁻³ | 0.154 | intron | ||
| HDAC2 | rs3757016 | 54 (17, 25, 12) | 5.57 (2.12) | 8.63x10⁻³ | 0.460 | untranslated-3' | ||
|
| ||||||||
| ACQ slope§ | CRHR1 | rs242950 | 55 (10, 45, 0) | −3.54x10⁻² (1.21x10⁻²) | 3.57x10⁻³ | 0.126 | intron | |
Abbreviations: MAF, minor allele frequency; N, number of patients; SE, Standard Error; synon, synonymous.
ΔFEV1%pred, change in percent predicted FEV117 defined as (%predicted FEV1 (week 16) - %predicted FEV1 (enrollment) / %predicted FEV1 (enrollment)) × 100 (unit-less); ACQ slope, slope of the least squares regression line fit to a plot of Asthma Control Questionnaire16 score versus time at weeks 0, 2, 4, 8, 12, 16 (ACQ units / week). The ACQ score ranges from 0 to 6, with lower values indicating less-severe asthma and 0.5 unit as the minimal clinically important difference16.
P-values were determined from general linear models correcting for age, gender, height, and height2 (see Methods). Reported p-values for each treatment – phenotype combination are for the maximum set of associated markers for which less than one false positive is predicted by the method of Storey and Tibshirani23;
associated markers that are significant by the Bonferroni multiple testing correction57.
Additive model;
Recessive model.
Effect size is calculated as the slope of the line between the adjusted means of the response variable for each genotype group.
FP/Salm Therapy
Three markers in CHRM2 (rs8191992, rs6962027, and rs6967953) were associated with ACQ slope for FP/Salm therapy and are in linkage disequilibrium (Table 2 and Figure E1, r2 = 0.710 – 0.839). Patients homozygous for the major allele improved by −0.019±0.001 ACQ points per week, while patients who were homozygous for the minor allele got worse by 0.0056±0.001 ACQ points per week (p=2.81×10⁻⁵; Figure 1A and Table 2). As a consequence, by week 16, patients who were homozygous for the major allele had an ACQ score of 0.57±0.19 points compared to minor allele homozygotes who scored 0.93±0.14 points (p=0.12, Figure 1B).
Figure 1.
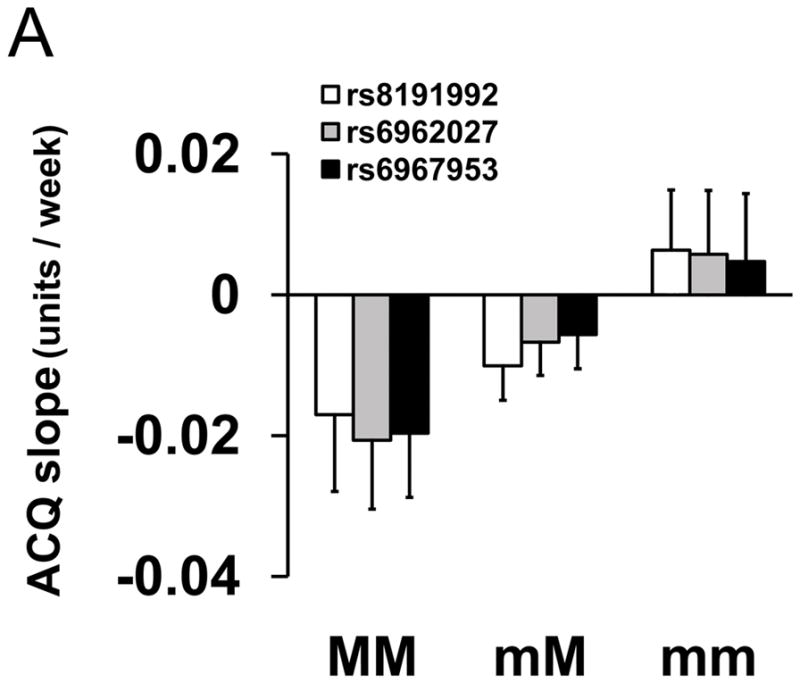
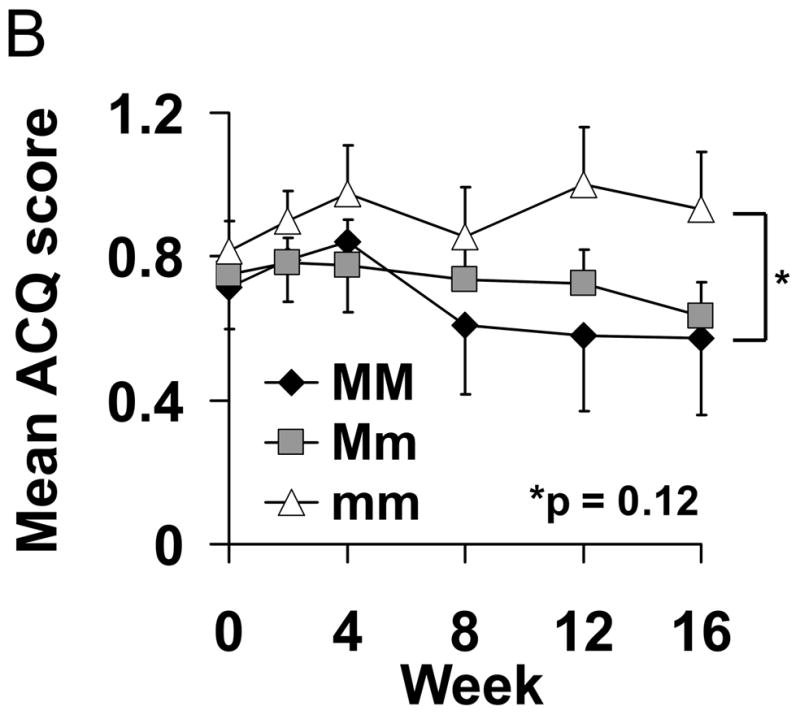
Association between Genotype of Markers in CHRM2 and Asthma Control Questionnaire Scores for FP/Salm Treatment. (Panel A) Mean slopes of the regression lines of scores from the Asthma Control Questionnaire16 (±SE) vs. time were compared by genotype for rs8191992 (□), rs6962027 (
 ) and rs6967953 (■) in participants taking fluticasone and salmeterol combination for 16 weeks. (Panel B) Mean scores from the Asthma Control Questionnaire16 (±SE) as a function of time between randomization (zero time) and week 16 by genotype. MM refers to homozygous for the major alleles (
 ); mM refers to heterozygotes (
 ); and mm refers to homozygotes for the minor allele (
 ) of each SNP.
An association between rs1461496 in HSPA8 and ΔFEV1%pred was observed for participants receiving FP/Salm therapy (Figure 2). Participants homozygous for the minor allele had a 17% increase in adjusted mean ΔFEV1%pred compared to homozygous major allele participants (p=1.28×10⁻³, Table 2). No associations with CHRM2 or HSPA8 were observed for either fluticasone or montelukast therapies (data not shown).
Figure 2.
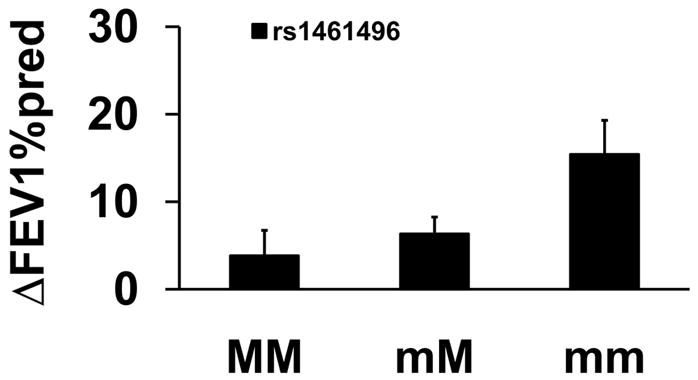
Association between Genotype for rs1461496 in HSP8A and Pulmonary Function for FP/Salm Treatment. Mean percent changes in percent predicted FEV1 (±SE) were calculated between week 16 and visit 1 (randomization) in participants taking fluticasone and salmeterol treatment by genotype. MM refers to homozygous for the major allele; mM refers to heterozygotes; and mm refers to homozygotes for the minor allele.
Fluticasone Therapy
Five markers in CRHR1 (rs242941, rs739645, rs1876831, rs1876829, and rs1876828) were significantly associated with ΔFEV1%pred for participants receiving fluticasone therapy (Table 2). Four of the markers in CRHR1 were in linkage disequilibrium (rs739645, rs1876831, rs1876829, and rs1876828), as previously reported25. Patients who were homozygous for the minor alleles showed an improvement of 24.2±9.10% in adjusted mean ΔFEV1%pred between enrollment and week 16 of treatment compared to 10.1±2.67% for heterozygotes and 2.98±1.88% for major allele homozygotes (p=1.89x10⁻⁴; Figure 3 and Table 2). Conversely, CRHR1 rs242941 was associated with decreased ΔFEV1%pred. By week 16, patients homozygous for rs242941 scored 18.3±5.59% lower than patients who were homozygous for the major allele (p=2.07×10⁻³; Figure 3 and Table 2) suggesting that ΔFEV1%pred in these patients was not protected by fluticasone therapy and in fact deteriorated over the course of the trial to finish at a value lower than that recorded at enrollment.
Figure 3.

Association between Genotype of Markers in CRHR1 and Pulmonary Function for Fluticasone Treatment. Mean percent changes in percent predicted FEV1 (±SE) were calculated between week 16 and visit 1 (randomization) in participants taking fluticasone treatment by genotype for rs242941 (□); rs739645 (
 ); rs1876831 (
 ); rs1876829 (
 ); and rs1876828 (■). MM refers to homozygous for the major alleles; mM refers to heterozygotes; and mm refers to homozygotes for the minor alleles.
The recessive model identified a novel association between three markers in COL2A1 (rs2276458, rs2276455, and rs2276454) and ΔFEV1%pred for fluticasone therapy. Markers rs2276458, rs2276455, and rs2276454 in COL2A1 are in linkage disequilibrium (Figure S2, r2= 0.870 – 1.00). Patients who were homozygous for the minor allele did not show an improvement in FEP while on fluticasone, averaging an adjusted mean ΔFEV1%pred of −1.96±1.52% and resulting in a differential of 14.5±2.37% between homozygous major and homozygous minor allele patients (p=4.25x10⁻³; Figure 4 and Table 2).
Figure 4.
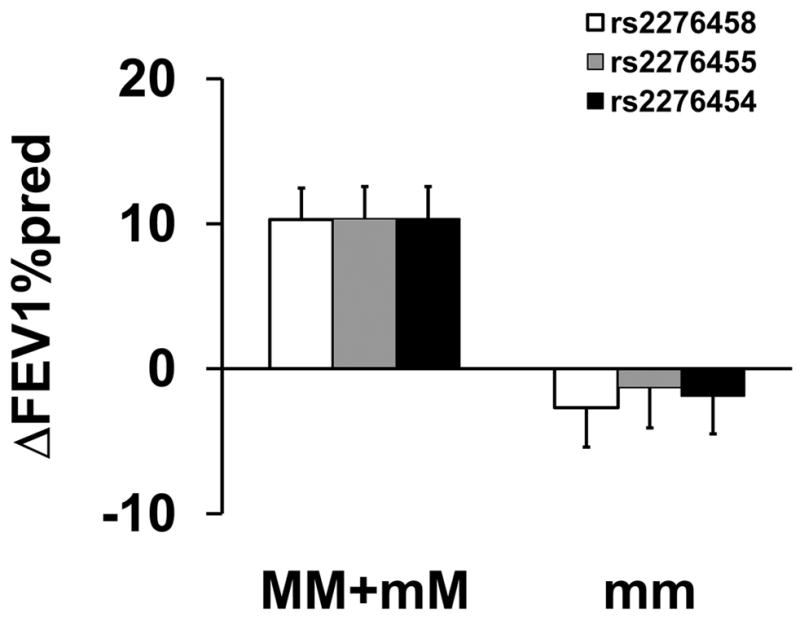
Association between Genotype of Markers in COL2A1 and Pulmonary Function for Fluticasone Treatment. Mean percent changes in percent predicted FEV1 (±SE) were calculated between week 16 and visit 1 (randomization) in participants taking fluticasone treatment by genotype for rs2276458 (□); rs2276455 (
 ); and rs2276454 (■). MM refers to homozygous for the major alleles; mM refers to heterozygotes; and mm refers to homozygotes for the minor alleles.
Montelukast Therapy
The linked markers in CRHR1: rs739645, rs1876831, rs1876829, and rs1876828 were associated with ΔFEV1%pred for montelukast therapy, however the effect observed was opposite in direction to that seen for fluticasone therapy (adjusted mean ΔFEV1%pred effect size for fluticasone vs. montelukast therapy =10.4±1.40% vs. −6.26±1.19, Table 2 and Figures 3 and 5). Patients homozygous for the major allele improved by 4.6±1.8% while patients who were homozygous for the minor allele showed no improvement over that recorded at enrollment (p=8.6×10⁻³; Figure 5 and Table 2).
Figure 5.
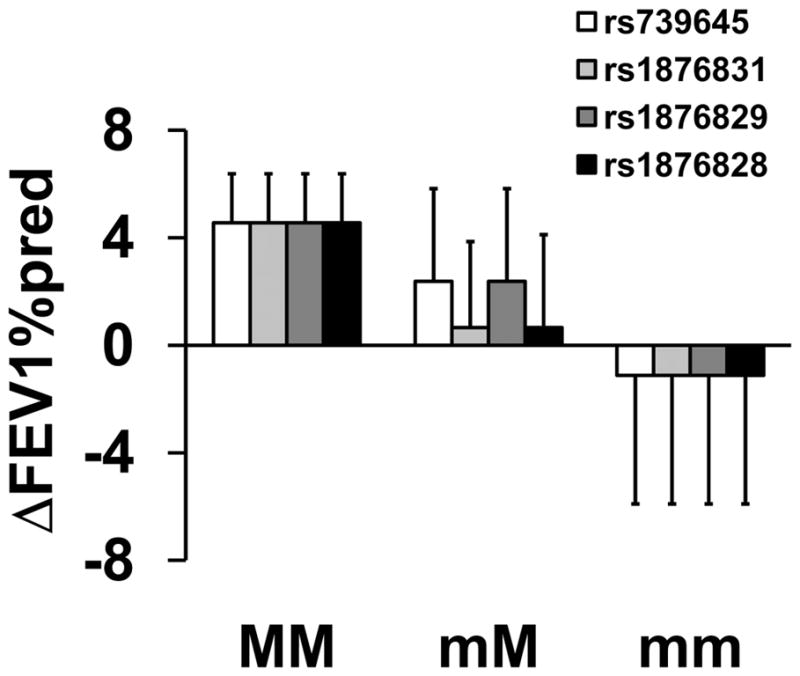
Association between Genotype of Markers in CRHR1 and Pulmonary Function for Montelukast Treatment. Mean percent changes in percent predicted FEV1 (±SE) were calculated between week 16 and visit 1 (randomization) in participants taking montelukast by genotype for rs739645(□); rs1876831 (
 ); rs1876829 (
 ); and rs1876828 (■). MM refers to homozygous for the major alleles; mM refers to heterozygotes; and mm refers to homozygotes for the minor alleles.
CRHR1 marker rs242950, which is not in LD with rs739645, rs1876831, rs1876829, and rs1876828, associated with ACQ slope for participants receiving montelukast therapy. In rs242950 heterozygotes, ACQ slope was negative indicating reduced asthma symptoms while ACQ slope for major allele homozygotes was positive indicating increased asthma symptoms (p=3.57x10⁻³; Figure 6 and Table 2). Mean ACQ scores (±SE) in homozygotes and heterozygotes at week 16 were 0.963±0.109 and 0.543±0.087, respectively (p=0.075).
Figure 6.
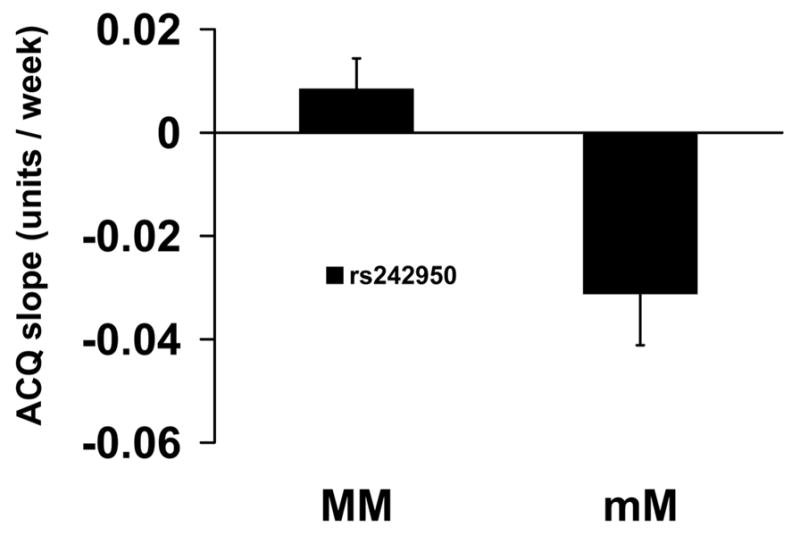
Association between rs242950 in CRHR1 and Asthma Control Questionnaire Scores for Montelukast Treatment. Mean slopes of the regression line of scores from the Asthma Control Questionnaire (±SE) vs. time were compared by genotype for rs242950 in participants taking montelukast for 16 weeks. MM refers to homozygous for the major allele; mM refers to heterozygotes.
In an attempt to evaluate the validity of the associations between response to montelukast and genotype at rs739645, rs1876831, rs1876829, and rs1876828 in CRHR1, we determined associations between rs1876829 and response (ΔFEV1%pred, ACQ scores) in a replicate cohort from a previous study15. No associations were observed between genotype at rs1876829 and ΔFEV1%pred. However, the mean ACQ scores (±SE) in major allele homozygous participants and heterozygotes were 1.65±0.11 and 1.21±0.17, respectively following one month of montelukast treatment (p=0.049). ACQ scores following six months of treatment also trended in this same direction: 1.55±0.12 and 1.23±0.16, respectively (p=0.21).
One additional marker, rs3757016 in HDAC2 (Figure 7) was associated with significant improvement in ΔFEV1%pred for montelukast therapy (Table 2). Compared to major allele homozygotes, heterozygotes and/or homozygotes for the minor allele were associated with improved ΔFEV1%pred in participants receiving montelukast therapy.
Figure 7.
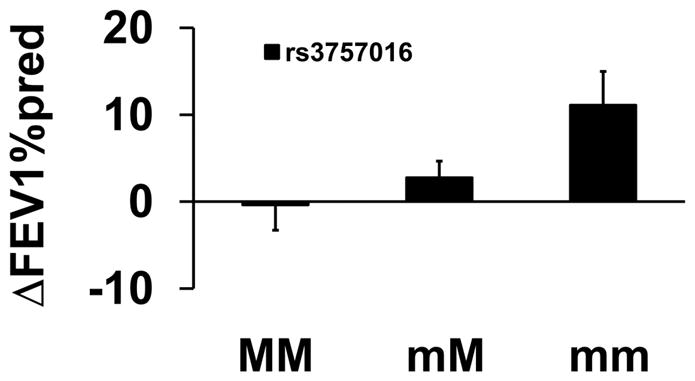
Association between Genotype of HDAC2 and Pulmonary Function for Montelukast. Mean percent changes in percent predicted FEV1 (±SE) were calculated between week 16 and visit 1 (randomization) in participants taking montelukast by genotype for rs3757016 in HDAC2. MM refers to homozygous for the major alleles; mM refers to heterozygotes; and mm refers to homozygotes for the minor alleles.
Discussion
Among the novel associations that we identified were three SNPs in CHRM2 and a single SNP in HSP8A that associated with response to FP/Salm therapy, and five SNPs in CRHR1 and a single SNP in HDAC2 that associated with response to montelukast therapy. Five SNPs in CRHR1 replicated results in previous studies with inhaled corticosteroids. Of particular interest was the observation that CRHR1 variants were inversely associated with differential improvement in lung function following fluticasone and montelukast therapies (Figure 3 and 5). To our knowledge this study is the first to report that associations between genetic variants and response to ICS and LTRA are inversely related, thus potentially providing a genetic rationale for selecting one controller over the other.
FP/Salm Therapy
The strongest pharmacogenetic association we observed was between three SNPs in CHRM2, which are in linkage disequilibrium (see Figure E1), and ACQ slope following treatment with FP/Salm (Figure 1A). Autonomic control of airway tone in humans is primarily mediated by acetylcholine released from parasympathetic nerves26. Acetylcholine exerts its effect via stimulation of muscarinic receptors (mAChRs; M1–M5) expressed on airway smooth muscle, submucosal glands, blood vessels and nerves27–29. M2 mAChR expressed on prejunctional, postganglionic parasympathetic nerves, functions to attenuate synaptic acetylcholine release through negative feedback30,31, and loss of this control contributes to increased airway tone and hyperreactivity in asthma and COPD32,33. Conversely, postjunctional M2 mAChR expressed on smooth muscle can inhibit β2-adrenoceptor-induced bronchodilation34–36. M3 mAChR expressed on airway smooth muscle and submucosal glands, facilitates smooth muscle contraction37–39 and mucus secretion40–42, respectively. β-adrenoceptors and mAchRs expressed in human airway smooth muscle can influence each other through receptor crosstalk43.
The use of ICS + LABA in asthma is controversial44; some studies report that continued LABA use even in the presence of ICS can make asthma symptoms worse10,45,46. Several studies have reported that individuals carrying the Arg16 allele of the ADRB2 are more susceptible to the negative effects of continuous β2-adrenoceptor stimulation compared to carriers of the Gly16 allele47–49. We observed no association between ACQ slope and ADRB2 variants in participants taking FP/Salm. However, given the potential of receptor crosstalk between β2-adrenoceptors and M2 mAChR in airways, and the association between ACQ scores and CHRM2 variants, it is important to replicate our findings in future studies.
Fluticasone Therapy
The linked CRHR1 SNPs rs1876831, rs1876828, rs739645, rs1876829 were strongly associated with ΔFEV1%pred in patients receiving fluticasone (8.2-fold higher for minor allele homozygotes, Figure 5). rs242941 was associated with a negative ΔFEV1%pred compared to major allele homozygotes and heterozygotes (Figure 3). These data replicate results of our previous studies in asthma8,50 and in COPD, at least for rs24294151, indicating that CRHR1 is an important gene in modulating the effects of ICS. SNPs in CRHR1 have also been associated with markers of inflammation and endothelial dysfunction in elderly males with asthma and/or COPD52.
Corticotropin-releasing hormone (CRH) binds to CRHR1 and exerts its anti-inflammatory effects by mediating the release of ACTH and promoting the production of cortisol53. Thus, variants of CRHR1 could affect CRH binding and subsequently ACTH release, airway inflammation, and responsiveness to ICS8. Alternatively, the associations between ICS responsiveness in asthma and CRHR1 variants may be related to a large inversion polymorphism25.
Montelukast Therapy
The association between CRHR1 SNPs rs1876831, rs1876828, rs739645, rs1876829 and ΔFEV1%pred in patients receiving montelukast was the inverse of that observed for patients receiving fluticasone. We were not able to replicate this association in a cohort of participants who received montelukast in a previous study (LODO15). Interestingly, ACQ scores for heterozygotes at rs1876828 in LODO participants taking montelukast were lower following one month of therapy compared to placebo (1.21±0.17 vs 2.00±0.19; ANOVA p=0.012, two-sided Dunnet p=0.007), while ACQ scores in major allele homozygotes were not significantly different from placebo (1.65±0.11 vs 1.88±0.14; ANOVA p=0.41). This pattern was not however evident following six months of treatment (data not shown). These data are not consistent with our findings in the present study.
Histone deacetylase 2 (HDAC2) SNP rs3757016 was associated with a significant improvement in ΔFEV1%pred for patients receiving montelukast (Figure 7). HDAC2 contributes to suppression of inflammatory gene expression and is thought to play a major role in corticosteroid resistance15,54,55, which potentially may be reversed by increasing HDAC2 activity56. The mechanism underlying the association between rs3757016 and ΔFEV1%pred in participants taking montelukast is not clear. However, if rs3757016 is associated with gain of HDAC2 function, then attenuation of inflammatory gene expression would increase with allele dosage, conceivably leading to increased effectiveness of montelukast.
Our study has several limitations including small numbers of participants which limited our power to detect associations between response and SNPs with minor allele frequencies <0.1. To avoid population stratification, we limited our study to Caucasians because of the small number of African Americans and other ethnicities who participated. We have limited access to other pharmacogenetic studies which impeded our ability to replicate our novel associations.
In conclusion, we believe the results of our study strongly support the inclusion of pharmacogenomics in comparative effectiveness research and personalized medicine.
Supplementary Material
At a Glance Commentary.
Genetic determinants that influence response to the three most common asthma controller therapies, inhaled corticosteroids, the combination of inhaled corticosteroids and long acting β2-agonists, and leukotriene receptor antagonists, are identified in 26 candidate genes. Our data support continued pharmacogenomic studies in asthma and the use of genetic variants to personalize asthma treatment.
Acknowledgments
Funding Sources: National Institutes of Health (R01HL071394, R01HL074755, K23HL081245, R01HL092197, and U01HL065899) and the American Lung Association.
We would like to acknowledge the ALA-ACRC investigators and research teams who conducted the LOCCS and LODO trials. We would also like to acknowledge Stacey Gray for help with preparation of the manuscript. Author Contribution: E.B. Mougey, analysis, interpretation, and drafting the manuscript for intellectual content; C. Chen, study design, statistics, and association analysis; K.G. Tantisira, conception, design, analysis, interpretation, and funding; K.V. Blake, conception, design, funding, trials; and drafting the manuscript for intellectual content; S.P. Peters, conception, design, trials; R.A. Wise, conception, design, and trials; S.T. Weiss, conception, design and funding; J.J. Lima (P.I.), conception, design, analysis, interpretation, funding, drafting the manuscript for intellectual content, and guarantor.
Footnotes
Online Data Supplement: This article has an online data supplement.
Conflicts of Interest: The authors wish to declare the following conflicts of interest: Edward Mougey and John Lima received funding from Merck to characterize associations between transporter SNPs and the pharmacokinetics and pharmacodynamics of montelukast. Stephen Peters received compensation as a consultant to the ALA-ACRC DCC. Robert Wise received compensation as a consultant to the following companies: Astra Zeneca, Boehringer-Ingelheim, GSK, Novartis, Sunovion, Centocor, Genentech, Medimmune, Intermune, Pfizerone. Dr Wise is also funded by the following companies: Boehringer-Ingelheim, GSK, Merck Forest.
References
- 1.Akinbami LJ, Moorman JE, Liu X. Asthma prevalence, health care use, and mortality: United States, 2005–2009. Natl Health Stat Report. 2011:1–14. [PubMed] [Google Scholar]
- 2.Lima JJ. Genetic influences on response to asthma pharmacotherapy. Expert Rev Clin Pharmacol. 2008;1:649–660. doi: 10.1586/17512433.1.5.649. [DOI] [PubMed] [Google Scholar]
- 3.Lima JJ. Treatment heterogeneity in asthma: genetics of response to leukotriene modifiers. Mol Diagn Ther. 2007;11:97–104. doi: 10.1007/BF03256228. [DOI] [PubMed] [Google Scholar]
- 4.Lima JJ, Blake KV, Tantisira KG, Weiss ST. Pharmacogenetics of asthma. Curr Opin Pulm Med. 2009;15:57–62. doi: 10.1097/MCP.0b013e32831da8be. [DOI] [PMC free article] [PubMed] [Google Scholar]
- 5.Drazen JM, Silverman EK, Lee TH. Heterogeneity of therapeutic responses in asthma. Br Med Bull. 2000;56:1054–1070. doi: 10.1258/0007142001903535. [DOI] [PubMed] [Google Scholar]
- 6.Wu AC, Tantisira K, Li L, Schuemann B, Weiss S. Repeatability of response to asthma medications. J Allergy Clin Immunol. 2009;123:385–390. doi: 10.1016/j.jaci.2008.10.015. [DOI] [PMC free article] [PubMed] [Google Scholar]
- 7.Tantisira KG, Hwang ES, Raby BA, et al. TBX21: a functional variant predicts improvement in asthma with the use of inhaled corticosteroids. Proc Natl Acad Sci U S A. 2004;101:18099–18104. doi: 10.1073/pnas.0408532102. [DOI] [PMC free article] [PubMed] [Google Scholar]
- 8.Tantisira KG, Lake S, Silverman ES, et al. Corticosteroid pharmacogenetics: association of sequence variants in CRHR1 with improved lung function in asthmatics treated with inhaled corticosteroids. Hum Mol Genet. 2004;13:1353–1359. doi: 10.1093/hmg/ddh149. [DOI] [PubMed] [Google Scholar]
- 9.Wechsler ME, Israel E. beta-adrenergic receptor genotype and response to salmeterol. J Allergy Clin Immunol. 2007;120:218–219. doi: 10.1016/j.jaci.2007.01.053. [DOI] [PubMed] [Google Scholar]
- 10.Wechsler ME, Lehman E, Lazarus SC, et al. beta-Adrenergic receptor polymorphisms and response to salmeterol. Am J Respir Crit Care Med. 2006;173:519–526. doi: 10.1164/rccm.200509-1519OC. [DOI] [PMC free article] [PubMed] [Google Scholar]
- 11.Klotsman M, York TP, Pillai SG, et al. Pharmacogenetics of the 5-lipoxygenase biosynthetic pathway and variable clinical response to montelukast. Pharmacogenet Genomics. 2007;17:189–196. doi: 10.1097/FPC.0b013e3280120043. [DOI] [PubMed] [Google Scholar]
- 12.Lima JJ, Zhang S, Grant A, et al. Influence of leukotriene pathway polymorphisms on response to montelukast in asthma. Am J Respir Crit Care Med. 2006;173:379–385. doi: 10.1164/rccm.200509-1412OC. [DOI] [PMC free article] [PubMed] [Google Scholar]
- 13.Telleria JJ, Blanco-Quiros A, Varillas D, et al. ALOX5 promoter genotype and response to montelukast in moderate persistent asthma. Respir Med. 2008;102:857–861. doi: 10.1016/j.rmed.2008.01.011. [DOI] [PubMed] [Google Scholar]
- 14.Peters SP, Anthonisen N, Castro M, et al. Randomized comparison of strategies for reducing treatment in mild persistent asthma. N Engl J Med. 2007;356:2027–2039. doi: 10.1056/NEJMoa070013. [DOI] [PubMed] [Google Scholar]
- 15.Clinical trial of low-dose theophylline and montelukast in patients with poorly controlled asthma. Am J Respir Crit Care Med. 2007;175:235–242. doi: 10.1164/rccm.200603-416OC. [DOI] [PubMed] [Google Scholar]
- 16.Juniper EF, O'Byrne PM, Guyatt GH, Ferrie PJ, King DR. Development and validation of a questionnaire to measure asthma control. Eur Respir J. 1999;14:902–907. doi: 10.1034/j.1399-3003.1999.14d29.x. [DOI] [PubMed] [Google Scholar]
- 17.Hankinson JL, Odencrantz JR, Fedan KB. Spirometric reference values from a sample of the general U.S. population. Am J Respir Crit Care Med. 1999;159:179–187. doi: 10.1164/ajrccm.159.1.9712108. [DOI] [PubMed] [Google Scholar]
- 18.Guo SW, Thompson EA. Performing the exact test of Hardy-Weinberg proportion for multiple alleles. Biometrics. 1992;48:361–372. [PubMed] [Google Scholar]
- 19.Barrett JC. Haploview: Visualization and analysis of SNP genotype data. Cold Spring Harb Protoc. 2009 doi: 10.1101/pdb.ip71. [DOI] [PubMed] [Google Scholar]
- 20.Johnson AD, Handsaker RE, Pulit SL, Nizzari MM, O'Donnell CJ, de Bakker PI. SNAP: a web-based tool for identification and annotation of proxy SNPs using HapMap. Bioinformatics. 2008;24:2938–2939. doi: 10.1093/bioinformatics/btn564. [DOI] [PMC free article] [PubMed] [Google Scholar]
- 21.Rao PV. Statistical Research Methods in the Life Sciences. Pacific Grove, CA: Duxbury Press; 1998. [Google Scholar]
- 22.Storey JD. A Direct Approach to False Discovery Rates. J R Stat Soc Series B Stat Methodol. 2002;64:479–498. [Google Scholar]
- 23.Storey JD, Tibshirani R. Statistical significance for genomewide studies. Proc Natl Acad Sci U S A. 2003;100:9440–9445. doi: 10.1073/pnas.1530509100. [DOI] [PMC free article] [PubMed] [Google Scholar]
- 24.Team RDC. R: A Language and Environment for Statistical Computing. Vienna, Austria: R Foundation for Statistical Computing; 2010. [Google Scholar]
- 25.Tantisira KG, Lazarus R, Litonjua AA, Klanderman B, Weiss ST. Chromosome 17: association of a large inversion polymorphism with corticosteroid response in asthma. Pharmacogenet Genomics. 2008;18:733–737. doi: 10.1097/FPC.0b013e3282fe6ebf. [DOI] [PMC free article] [PubMed] [Google Scholar]
- 26.Coulson FR, Fryer AD. Muscarinic acetylcholine receptors and airway diseases. Pharmacol Ther. 2003;98:59–69. doi: 10.1016/s0163-7258(03)00004-4. [DOI] [PubMed] [Google Scholar]
- 27.Eglen RM, Hegde SS, Watson N. Muscarinic receptor subtypes and smooth muscle function. Pharmacol Rev. 1996;48:531–565. [PubMed] [Google Scholar]
- 28.Mak JC, Barnes PJ. Autoradiographic visualization of muscarinic receptor subtypes in human and guinea pig lung. Am Rev Respir Dis. 1990;141:1559–1568. doi: 10.1164/ajrccm/141.6.1559. [DOI] [PubMed] [Google Scholar]
- 29.McGraw DW, Forbes SL, Kramer LA, et al. Transgenic overexpression of beta(2)-adrenergic receptors in airway smooth muscle alters myocyte function and ablates bronchial hyperreactivity. J Biol Chem. 1999;274:32241–32247. doi: 10.1074/jbc.274.45.32241. [DOI] [PubMed] [Google Scholar]
- 30.Baker DG, Don HF, Brown JK. Direct measurement of acetylcholine release in guinea pig trachea. Am J Physiol. 1992;263:L142–L147. doi: 10.1152/ajplung.1992.263.1.L142. [DOI] [PubMed] [Google Scholar]
- 31.Patel HJ, Barnes PJ, Takahashi T, Tadjkarimi S, Yacoub MH, Belvisi MG. Evidence for prejunctional muscarinic autoreceptors in human and guinea pig trachea. Am J Respir Crit Care Med. 1995;152:872–878. doi: 10.1164/ajrccm.152.3.7663798. [DOI] [PubMed] [Google Scholar]
- 32.Ayala LE, Ahmed T. Is there loss of protective muscarinic receptor mechanism in asthma? Chest. 1989;96:1285–1291. doi: 10.1378/chest.96.6.1285. [DOI] [PubMed] [Google Scholar]
- 33.Minette PA, Barnes PJ. Prejunctional inhibitory muscarinic receptors on cholinergic nerves in human and guinea pig airways. J Appl Physiol. 1988;64:2532–2537. doi: 10.1152/jappl.1988.64.6.2532. [DOI] [PubMed] [Google Scholar]
- 34.Fernandes LB, Fryer AD, Hirshman CA. M2 muscarinic receptors inhibit isoproterenol-induced relaxation of canine airway smooth muscle. J Pharmacol Exp Ther. 1992;262:119–126. [PubMed] [Google Scholar]
- 35.Kume H, Kotlikoff MI. Muscarinic inhibition of single KCa channels in smooth muscle cells by a pertussis-sensitive G protein. Am J Physiol. 1991;261:C1204–C1209. doi: 10.1152/ajpcell.1991.261.6.C1204. [DOI] [PubMed] [Google Scholar]
- 36.Schramm CM, Arjona NC, Grunstein MM. Role of muscarinic M2 receptors in regulating beta-adrenergic responsiveness in maturing rabbit airway smooth muscle. Am J Physiol. 1995;269:L783–L790. doi: 10.1152/ajplung.1995.269.6.L783. [DOI] [PubMed] [Google Scholar]
- 37.Chilvers ER, Batty IH, Barnes PJ, Nahorski SR. Formation of inositol polyphosphates in airway smooth muscle after muscarinic receptor stimulation. J Pharmacol Exp Ther. 1990;252:786–791. [PubMed] [Google Scholar]
- 38.Grandordy BM, Cuss FM, Sampson AS, Palmer JB, Barnes PJ. Phosphatidylinositol response to cholinergic agonists in airway smooth muscle: relationship to contraction and muscarinic receptor occupancy. J Pharmacol Exp Ther. 1986;238:273–279. [PubMed] [Google Scholar]
- 39.Roffel AF, Elzinga CR, Zaagsma J. Muscarinic M3 receptors mediate contraction of human central and peripheral airway smooth muscle. Pulm Pharmacol. 1990;3:47–51. doi: 10.1016/0952-0600(90)90009-8. [DOI] [PubMed] [Google Scholar]
- 40.Mullol J, Baraniuk JN, Logun C, et al. M1 and M3 muscarinic antagonists inhibit human nasal glandular secretion in vitro. J Appl Physiol. 1992;73:2069–2073. doi: 10.1152/jappl.1992.73.5.2069. [DOI] [PubMed] [Google Scholar]
- 41.Okayama M, Mullol J, Baraniuk JN, et al. Muscarinic receptor subtypes in human nasal mucosa: characterization, autoradiographic localization, and function in vitro. Am J Respir Cell Mol Biol. 1993;8:176–187. doi: 10.1165/ajrcmb/8.2.176. [DOI] [PubMed] [Google Scholar]
- 42.Ramnarine SI, Haddad EB, Khawaja AM, Mak JC, Rogers DF. On muscarinic control of neurogenic mucus secretion in ferret trachea. J Physiol. 1996;494(Pt 2):577–586. doi: 10.1113/jphysiol.1996.sp021515. [DOI] [PMC free article] [PubMed] [Google Scholar]
- 43.Proskocil BJ, Fryer AD. Beta2-agonist and anticholinergic drugs in the treatment of lung disease. Proc Am Thorac Soc. 2005;2:305–310. doi: 10.1513/pats.200504-038SR. [DOI] [PubMed] [Google Scholar]
- 44.Martinez FD. Safety of long-acting beta-agonists--an urgent need to clear the air. N Engl J Med. 2005;353:2637–2639. doi: 10.1056/NEJMp058299. [DOI] [PubMed] [Google Scholar]
- 45.Lee DK, Currie GP, Hall IP, Lima JJ, Lipworth BJ. The arginine-16 beta2-adrenoceptor polymorphism predisposes to bronchoprotective subsensitivity in patients treated with formoterol and salmeterol. Br J Clin Pharmacol. 2004;57:68–75. doi: 10.1046/j.1365-2125.2003.01955.x. [DOI] [PMC free article] [PubMed] [Google Scholar]
- 46.Palmer CN, Lipworth BJ, Lee S, Ismail T, Macgregor DF, Mukhopadhyay S. Arginine-16 beta2 adrenoceptor genotype predisposes to exacerbations in young asthmatics taking regular salmeterol. Thorax. 2006;61:940–944. doi: 10.1136/thx.2006.059386. [DOI] [PMC free article] [PubMed] [Google Scholar]
- 47.Hancox RJ, Sears MR, Taylor DR. Polymorphism of the beta2-adrenoceptor and the response to long-term beta2-agonist therapy in asthma. Eur Respir J. 1998;11:589–593. [PubMed] [Google Scholar]
- 48.Israel E, Chinchilli VM, Ford JG, et al. Use of regularly scheduled albuterol treatment in asthma: genotype-stratified, randomised, placebo-controlled cross-over trial. Lancet. 2004;364:1505–1512. doi: 10.1016/S0140-6736(04)17273-5. [DOI] [PubMed] [Google Scholar]
- 49.Taylor DR, Drazen JM, Herbison GP, Yandava CN, Hancox RJ, Town GI. Asthma exacerbations during long term beta agonist use: influence of beta(2) adrenoceptor polymorphism. Thorax. 2000;55:762–767. doi: 10.1136/thorax.55.9.762. [DOI] [PMC free article] [PubMed] [Google Scholar]
- 50.Weiss ST, Lake SL, Silverman ES, et al. Asthma steroid pharmacogenetics: a study strategy to identify replicated treatment responses. Proc Am Thorac Soc. 2004;1:364–367. doi: 10.1513/pats.200409-043MS. [DOI] [PubMed] [Google Scholar]
- 51.Kim WJ, Sheen SS, Kim TH, et al. Association between CRHR1 polymorphism and improved lung function in response to inhaled corticosteroid in patients with COPD. Respirology. 2009;14:260–263. doi: 10.1111/j.1440-1843.2008.01425.x. [DOI] [PubMed] [Google Scholar]
- 52.Wilker EH, Alexeeff SE, Poon A, et al. Candidate genes for respiratory disease associated with markers of inflammation and endothelial dysfunction in elderly men. Atherosclerosis. 2009;206:480–485. doi: 10.1016/j.atherosclerosis.2009.03.004. [DOI] [PMC free article] [PubMed] [Google Scholar]
- 53.Dautzenberg FM, Hauger RL. The CRF peptide family and their receptors: yet more partners discovered. Trends Pharmacol Sci. 2002;23:71–77. doi: 10.1016/s0165-6147(02)01946-6. [DOI] [PubMed] [Google Scholar]
- 54.Barnes PJ. Histone deacetylase-2 and airway disease. Ther Adv Respir Dis. 2009;3:235–243. doi: 10.1177/1753465809348648. [DOI] [PubMed] [Google Scholar]
- 55.Barnes PJ. Inhaled corticosteroids in COPD: a controversy. Respiration. 2010;80:89–95. doi: 10.1159/000315416. [DOI] [PubMed] [Google Scholar]
- 56.Barnes KC, Grant AV, Gao P. A review of the genetic epidemiology of resistance to parasitic disease and atopic asthma: common variants for common phenotypes? Curr Opin Allergy Clin Immunol. 2005;5:379–385. doi: 10.1097/01.all.0000182543.37724.7b. [DOI] [PubMed] [Google Scholar]
- 57.Miller RG. Simultaneous Statistical Inference. New York: Springer Verlag; 2010. [Google Scholar]
Associated Data
This section collects any data citations, data availability statements, or supplementary materials included in this article.


