

Abstract
Background
Pediatric practices’ scores on health care quality measures are increasingly available to the public. However, patients from low-income and racial/ethnic minority populations rarely use these data. We sought to understand potential barriers to using quality data by assessing what factors mattered to women when choosing a pediatric practice.
Methods
As part of a randomized trial to overcome barriers to using quality data, we recruited women from a prenatal clinic serving an underserved population. Women reported how much 12 factors mattered when they chose a pediatric practice (5-point Likert scale), what other factors mattered to them, and which factors mattered the most. We assessed whether factor importance varied with selected participant characteristics and qualitatively analyzed the “other” factors named.
Results
Participants’ (n=367) median age was 23 years and they were largely Hispanic (60.4%), White (21.2%), or Black (16.9%). Insurance acceptance “mattered a lot” to the highest percentage of women (93.2%), while online information about what other parents think of a practice “mattered a lot” to the fewest (7.4%). Major themes from our qualitative analysis of “other” factors that mattered included Physicians’ Interpersonal Skills and Pediatrician-Specific Traits. Factors related to Access “mattered the most” to the majority of women.
Conclusions
Pediatrician characteristics and factors related to access to care may be more important to low-income and racial/ethnic minority women than more commonly reported quality metrics. Aligning both the content and delivery of publicly reported quality data with women’s interests may increase use of pediatric quality data.
Clinical Trial Registration
Keywords: pediatric health care quality, choosing a pediatric practice, low income, minority, pregnant women
Background
Health care quality is routinely measured by private insurance companies and state and federal health insurance programs. Pediatric quality measures generally fit into one of two categories: “clinical quality” or “patient experience.” Clinical quality measures, such as those found in the Healthcare Effectiveness Data and Information Set,1 can be process- or outcome-, but many pediatric measures are process-oriented (e.g., timely receipt of vaccinations). Performance on clinical quality measures is derived from insurance claims data. Patient experience measures, such as willingness to recommend a practice, are measured using patient surveys such as the Clinician and Group Consumer Assessment of Health Providers and Systems.2 Practice’s performance on these health care quality measures is increasingly available in the public domain; making these data public is intended to improve health care by stimulating institutional quality improvement efforts and by enabling consumers to choose higher quality practices.3 While public reporting of quality data has increased institutional quality improvement efforts, there has been less of an effect on patient behavior.4,5 Patients with lower socioeconomic status (SES) appear least likely to use quality performance data when seeking medical care.6 This may contribute to disparities in care, which may then in turn increase health disparities. Low health literacy and numeracy, poorly organized websites that are only offered in English and lack of awareness that the data exist contribute to low use of quality data by consumers. Other factors not captured in quality metrics that may be important to patients, such as a practice’s proximity to home, insurance, and family recommendations also may explain the limited use.7,8 Finally, although some proprietary websites such as HealthGrades and RateMDs offer online narrative reviews and ratings of individual physicians, most philanthropic or governmental websites show performance at the practice, hospital, or insurance plan level, which may also contribute to the limited consumer use of these sites if patients prefer provider-level data.9 Understanding what factors parents consider important when deciding on a pediatric practice is critical to understanding whether and how parents might use existing quality measures in this decisional process.
Adult patients seek characteristics such as good patient care, communication skills, and friendly staff when choosing a primary care practice,10–16 but little is known about what matters to parents from lower income and racial/ethnic minority populations when choosing a pediatric practice.17–21 Three studies assessed the importance of specific traits, such as the gender of the provider or board certification; participants included primarily white middle class populations. Another study assessed the importance of online reviews, also with white middle class parents, finding that parents reported that they did use them. Finally, one review study focused on preferences for well child care for lower income racial/ethnic minority parents, finding possible support for different locations for care, such as daycare and use of non-physician providers, particularly for behavioral health issues.
The objective of this study was to understand what factors matter to low-income, racial/ethnic minority women when they choose a pediatric practice and the relative importance of publicly reported quality measures. Given the historically low use of publicly reported quality data, we hypothesized that women may focus on factors other than quality scores when choosing a pediatric practice. This led us to also assess what factors besides performance on quality measures mattered to women when they chose a pediatric practice for their newborn.
Methods
Study populations
The current study was part of a randomized controlled trial focused on public reporting of pediatric health care quality measures.22 The primary study tested the impact of a patient navigator on women’s choice of a pediatric practice. In the primary study, trained patient navigators recruited English speaking women ages 16 to 50 years who were at 20–34 weeks of gestation between May, 2013 and August, 2014 at a prenatal clinic that served a predominantly low-income, racial/ethnic minority population and that was located in an urban tertiary care center. Women were excluded if they planned to deliver their newborn at a different institution. Baseline procedures and the intervention took place in the clinic, while follow-up procedures took place in the hospital affiliated with the clinic after women delivered. The intervention consisted of two 20–30 minute in-person interactive sessions with a patient navigator, during which women learned about quality measures and viewed quality scores for local pediatric practices by viewing the Massachusetts Health Quality Partners online Quality Reports (see the Appendix for technical details).22
We excluded participants in the intervention arm of the primary study from the current study because the information gained during the intervention was intended to enhance participants’ understanding of quality measures and hence could have impacted their decision process when choosing a practice. We surveyed study participants at baseline and at follow-up, but included only follow-up measures for the current study because women having their first child were responding to a hypothetical choice at baseline. The Baystate Medical Center Institutional Review Board approved the study.
Measures
Questionnaire Development and Administration
Provisional questionnaire content was developed using existing literature18,23,24 and clinical expertise. Questionnaire content and structure were then refined through pilot testing with approximately 25 pregnant women who were patients at the prenatal clinic at which we would be recruiting for the study. Only women who were in the third trimester of their pregnancy were invited to participate in the pilot since they would then be ineligible for the actual study. We conducted cognitive interviews25,26 to test the questionnaire for clarity and completeness as well as to determine factors that women felt would be important to them when choosing a pediatric practice. Cognitive interviewing consists of a “think aloud” exercise, during which participants are asked to say what is going through their mind as they read a question and choose their response. Verbal probes, such as, “What does the term quality mean to you in this question?” and asking participants to paraphrase survey questions was used to assess understanding. Specific to this portion of the study, we identified 12 candidate factors to assess the question of, “What matters when choosing a pediatric practice”? These questions were tested with the aforementioned technique and women were asked if there were other factors we should include but no additional factors were suggested. We asked women about factors important to them when choosing a practice rather than choosing a pediatrician during pilot testing because the website used in the intervention portion of the larger study reported practice- or medical group-level quality data. We framed the final set of questions to inquire about factors that mattered when choosing either a pediatrician or a pediatric practice in response to feedback offered during pilot testing. The resulting questionnaire included the following: 1) questions asking women to rate how much 12 specific factors identified as important during piloting mattered when they chose a practice or pediatrician (Response options included: mattered a lot, mattered somewhat, mattered a little, did not matter, did not consider; please see Appendix); 2) an open-ended prompt eliciting factors that mattered other than these 12; and 3) a question asking which factors mattered the most. In response to feedback obtained during piloting we allowed women to name more than one factor that “mattered the most”.
The follow-up questionnaire was administered in the hospital prior to discharge following delivery. It was hospital policy to ask women to choose a pediatric practice for newborn care prior to discharge from the hospital. When administering the questionnaire, study staff read each question aloud to decrease the potential for misunderstanding. Oral responses were recorded by the study staff on paper data collection sheets and were later entered into an electronic data management system. We collected the following demographic data during the study: age, race/ethnicity, employment status, educational level, income, marital status, and place of birth. We also estimated participants’ level of health literacy using the Newest Vital Sign,27 in which participants are shown a picture of an ice cream food label and the interviewer reads six questions aloud related to the label. Scores are grouped into the following categories: 1) High likelihood of limited literacy; 2) Possibility of limited literacy; and 3) Almost always adequate literacy.
Quantitative Analysis
We summarized patient characteristics using counts and percentages for categorical variables and medians and inter-quartile ranges (IQR) for continuous variables. We grouped responses as “mattered a lot” versus any other choice because most factors mattered at least somewhat to the majority of women. We calculated the percentage of women for whom each factor “mattered a lot” and assessed the impact of demographic characteristics including age, race, parity, marital status, and health literacy level on the importance of given factors via bivariable chi-square analyses.
Qualitative Analysis
We conducted a qualitative content analysis of the responses to the open-ended question “What else mattered?” We first developed a code book using baseline responses to the “What else mattered?” question. In this process, two coders (HGK and LM) under the supervision of an experienced qualitative analyst (SG) independently coded all discrete responses, resolving differences through consensus. Broad themes were identified concurrently with discrete response coding. Using this provisional codebook, we reviewed responses from the follow-up survey and updated the codebook to account for newly identified concepts using the constant comparative method. The constant comparative method refers to an analytic approach in which analysts identify major concepts in concert with line coding of the data, returning iteratively to previously analyzed data as new concepts are identified to re-assess how those data fit with emerging themes.28 We derived themes deductively during the coding process. We used memos both to track coding decisions and to identify emerging themes. We triangulated (compared findings from the current study to results of a related study) the themes we identified using an existing framework of adult patients’ preferences when choosing primary care internists and family physicians,16 identifying unique categories that did not fit into this existing framework. We also calculated theme frequencies.
Results
The 367 women who participated in the control arm of the study were included in this analysis. The median age was 23 years (IQR: 20–27 years). Participants were mainly Hispanic (60.4%), White (21.2%). or Black (16.9%). (Table 1) Approximately three quarters of participants (76%) either reported that their income was less than $20,000 per year or did not know/declined to report their annual income; 66.5% had a high school education or less and 73% had either “likely” or “possibly” limited health literacy levels. (Table 1) Nearly half (47.4%) of participants had just delivered their first child.
Table 1.
Characteristics of survey participants
| Characteristic | n (%) |
|---|---|
| N=367 (100%) | |
| Parity | |
| First child | 174 (47.4) |
| Subsequent child | 193 (52.6) |
| Age, Median (IQR), years | 23 (20 – 27) |
| Employment | |
| Employed | 126 (34.3) |
| Homemaker | 34 (9.3) |
| Unemployed | 169 (46.0) |
| Student | 38 (10.3) |
| Marital status | |
| Married and/or Living together | 185 (50.4) |
| Not living together | 64 (17.4) |
| Single/Widowed/Divorced | 118 (32.1) |
| Education | |
| Less than high school/Unknown | 139 (37.9) |
| 12th GED | 105 (28.6) |
| Some college/post high school | 86 (23.4) |
| 2 year college/Associate’s Degree | 22 (6.0) |
| Bachelor’s Degree | 8 (2.2) |
| Graduate education | 7 (1.9) |
| Race/Ethnicity | |
| White | 78 (21.2) |
| Black | 62 (16.9) |
| Hispanic | 222 (59.4) |
| Other/Unknown | 5 (1.4) |
| Place of birth | |
| USA | 339 (92.4) |
| Not USA | 28 (7.6) |
| Income | |
| Not sure/Don’t know/Refused to answer | 184 (50.3) |
| $0 to $19,999 | 94 (25.7) |
| $20,000 to $39,999 | 59 (16.1) |
| >= $40,000 | 29 (7.9) |
| Newest Vital Sign | |
| Likely limited health literacy (0–1) | 100 (27.2) |
| Possible limited health literacy (2–3) | 168 (45.8) |
| Adequate health literacy (4–6) | 99 (27.0) |
Which factors “mattered a lot” to women when choosing a pediatric practice for their newborn?
Each of the 12 specific factors “mattered a lot” to at least some women, but the number of participants to whom each factor “mattered a lot” varied (n=27–342; Table 2). The highest percentage of women felt the following factors “mattered a lot”: insurance accepted (93.2%), able to contact office by phone (82.8%), already knowing the pediatrician (59.4%), knowing the practice (55.3%), or the practice being close to home (51.5%). (Table 2) Conversely, fewer women felt that whether other parents recommended the practice (7.4%), information on the practice’s website (9.0%), or information found online about how well the practice does on quality measures (11.0%) mattered a lot to them when they chose a practice. (Table 2)
Table 2.
Number and Percent of women who rated a given factor as “mattered a lot”
| Factor | 367 (100%) |
|---|---|
| Your insurance is accepted by that pediatrician/practice | 342 (93.2) |
| How easily you can contact someone in the pediatrician’s office by phone | 304 (82.8) |
| You already knew the pediatrician/practice you chose | 218 (59.4) |
| How close the office is to home | 189 (51.5) |
| How easily you can get to the office using public transportation (like a bus) | 147 (40.0) |
| Recommendation from a family member | 133 (36.2) |
| Recommendation from a doctor or health care professional | 62 (16.9) |
| Recommendation from a friend | 51(13.9) |
| Information found online about how well the office does on measures of care quality | 41(11.2) |
| Information found on the practice website | 33 (9.0) |
| Information found online about what other parents think of the practice | 27 (7.4) |
Bivariable analyses showed differences between groups within several demographic measures. When compared to women who already had a child, women having their first child were more likely to state that a family recommendation mattered a lot (43.9% vs. 29.5%; p=0.004). Conversely, more women who already had a child indicated that already knowing either the pediatrician (71.3% vs. 46.8%; p<0.001) or the office staff (66.8% vs. 42.8%; p<0.001) and information on the pediatrician’s website (13.5% vs. 4.1%; p=0.002) mattered a lot. (Figure 1) Compared to women with a high school education or higher than a high school education, women with less than a high school education were more likely to indicate that nearness of the clinic to home (62.3% vs. 46.7% vs. 43.9%; p=0.006) and recommendation from a physician (23.2% vs. 15.2% vs. 11.4%; p=0.03) were factors that mattered a lot. A greater percentage of women with high school education reported that knowing the office staff mattered a lot compared to women with less or more than a high school education (51.4% vs. 65.7% vs. 51.2%; p=0.04), A higher percentage of Hispanic women indicated that already knowing the office staff (62.9% vs. 50.0% vs. 41.0%; p=0.002) or knowing the pediatrician (64.7% vs 48.4% vs. 57.1%; p=0.05) mattered a lot to them when compared to White or Black women. Younger women (23 years of age or less) cared more about recommendations from family members (40.4% vs. 30.9%; p=0.04) while women 24 years or older were more likely to feel online data about the practice “mattered a lot” (10.3% vs. 4.7%; p=0.04). Finally, participants with the lowest scores on health literacy measures had the highest percentage of women stating that a practice being close to home (63.7% vs. 49.7% vs. 43.4%; p=0.02) and already knowing office staff (62.0% vs. 57.5% vs. 45.4%; p=0.05) “mattered a lot”. (Figure 1)
Figure 1. Percent of women to whom each of 12 factors “Mattered a lot” by parity.
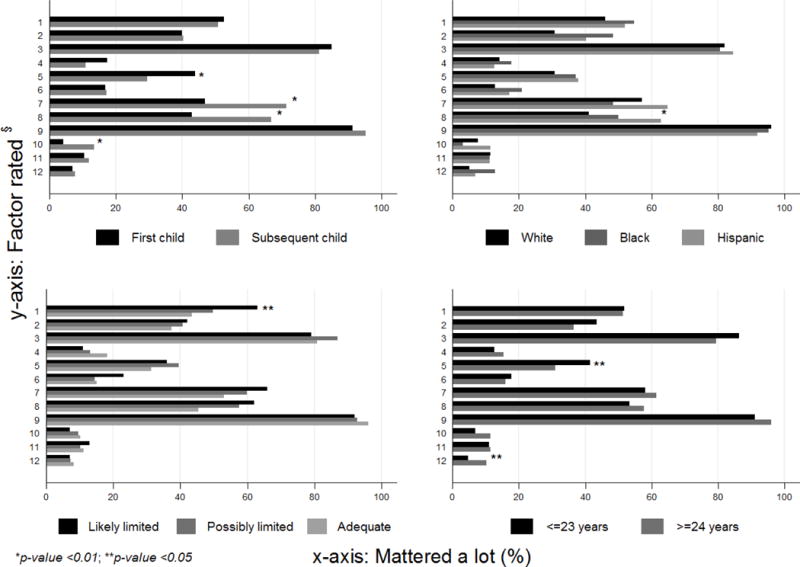
Factor rated§ 1: Office location – near home; 2: Office location – access to public transport; 3: Can easily contact someone in office; 4: Recommendation – friend; 5: Recommendation – family; 6: Recommendation – physician; 7: Already know the pediatrician; 8: Already know the office staff; 9: Office accepts patient’s insurance; 10: Information found on the pediatrician’s website; 11: Online data – clinical quality scores; 12: Online data – parent opinions
What other factors mattered when choosing a pediatric practice?
Among the 367 women included in the study, 31.3% (n=115) named “other” factors that mattered to them. Because some responses included multiple concepts, this yielded 148 coded pieces of text. Our analysis of the responses identified three broad themes: 1) Physician Factors; 2) System/Office Factors; and 3) Patient/Relational Factors. Each broad theme had associated sub-themes, shown in Table 3 along with the percentage of participants who named each sub-theme and selected illustrative quotes. When we assessed the frequencies of codes (percentages based on the number of times a code was applied to the 148 excerpts), we found that Physician Factors were cited most frequently (49.3%). Physician Interpersonal Skills was one of the most common sub-themes (23.6%), followed by Access (17.6%), a sub-theme found under the broad theme of System/Office. (Table 3) When we triangulated our results with the existing literature, the themes identified in the current study mapped onto all but two of those found in an existing framework of factors adults seek when selecting a primary care physician.16 (Table 4) We also identified six concepts that were not found in this existing framework, one of which was specific to pediatric care. These included wanting to be in a practice where there is a diverse patient population, having a provider who speaks your primary language, desire for continuity of care, offering a wide range of services, familiarity with the pediatrician, and good first impression. (Table 4)
Table 3.
Themes and sub-themes for “other” factors that mattered when choosing a pediatric practice
| Themes and Subthemes | n=148 (100 %) |
Quotes |
|---|---|---|
| Physician Factors – Demographics | 10 (6.8)* | |
| Experience | 7 (4.7) | How long they’ve been in practice – age 22, Black/African American |
| Gender | 2 (1.4) | That the doctor is a female – age 17, Other – Guatemalan |
| Race/ethnicity | 1 (0.7) | Ethnicity of pediatrician – age 30, Black/African American |
| Physician Factors – Interpersonal Skills | 35 (23.6) | |
| Communication | 6 (4.1) | How much they listen – age 31, Other – Asian |
| Positive personality traits | 5 (3.4) | How friendly they are – age 23, Other – American |
| Professionalism | 11 (7.4) | Making sure that my religious practices are valued; that they understand and still give me great care –age 36, Black/African American and American Indian/Alaska Native |
| Puts people at ease | 13 (8.8) | Good with older son/older son likes him – age 21, White/Caucasian |
| Physician Factors – Technical Skills | 8 (5.4%) | |
| Knowledgeable | 3 (2.0) | If the person is competent to take care of the baby – age 29, Black/African American |
| Provides breastfeeding support | 1 (0.7) | Supports breast feeding – age 26, Puerto Rican |
| Provides specialized care | 3 (2.0) | Good with babies coming off medications –age 26, Puerto Rican |
| Speaks patient’s preferred language | 1 (0.7) | Spoke the same language and understood me - age 21, Other – Latina |
| Physician Factors - General statements of quality and care | 20 (13.5) | If the doctors are good and do their job –age 24, Puerto Rican Other pediatrician wasn’t good –age 33, Puerto Rican |
| System/Office Factors - Access | 26 (17.6) | |
| General access | 3 (2.0) | if doctor is comfortable accepting new patient – age 28, Black/African American |
| Continuity | 4 (2.7) | Have a stable doctor – age 20, Puerto Rican |
| Easy to reach | 2 (1.4) | How fast I can talk to someone in case of an emergency –age 31, Puerto Rican |
| Efficiency | 9 (6.1) | When I call she sees you right away, never a big wait – age 29, White/Caucasian |
| Hours available for office visits | 6 (4.1) | Have two offices and extended hours – age 27, White/Caucasian |
| After-hours availability | 2 (1.4) | When you call her and kids sick and her office is closed she does home visits and hospital visits – age 29, Puerto Rican |
| System/Office Factors – Office Characteristics | 15 (10.1) | |
| Atmospherics | 5 (3.4) | Clean office – age 33, White/Caucasian |
| Office reputation | 3 (2.0) | I’ve heard of them before – age 31, White/Caucasian |
| Type of practice | 7 (4.7) | Offer a large range of services – age 40, Black/African American |
| Relational/Patient Factors – Experience or familiarity with pediatrician/practice | 31 (20.9) | |
| Cares for other children in family | 12 (8.1) | My son goes to the same pediatrics and he’s always taken care of – age 21, Puerto Rican |
| Personal or family experience with doctor/staff/office | 19 (12.8) | It was my pediatrician since I was born and I was always satisfied – always good to me. Knowing pediatrician and staff mattered most – age 19, Puerto Rican |
| Relational/Patient Factors – Recommended by someone/first impression | 3 (2.0) | |
| Recommended by someone | 2 (1.4) | Talking to other parents that bring their children to the practice – age 18, Dominican |
| Good first impression | 1 (0.7) | Personal feeling about the place – age 22, Black/African American |
| TOTAL | 148 (100) |
Bolded numbers and percentages represent the total for all sub-themes in the category Subtheme percentages are the proportion of the total sample of excerpts (n=148)
Table 4.
Mapping of current study categories and sub-categories for “other” factors that mattered to an existing adult framework for factors patients considered when choosing a primary care physician
| Categories from Current Study | Mercado Framework29 |
|---|---|
| Physician factors - Demographics | Advanced age Same sex Same race |
| Physician factors - Interpersonal | Good communication skills Very caring and shows concern |
| Physician factors – Technical Skills/Practice Style | Satisfaction with doctor’s skills Sees only children (adults in Mercado) |
| Physician factors - General | Satisfaction with doctor’s skills Good patient care |
| System/Office factors - Access | Nice, friendly, and efficient nurses and staff Short wait time in office Always available for appointments/phone calls |
| System/Office factors – Office characteristics | Nice and neat office |
| System/Office factors –Positive staff traits | Nice, friendly, and efficient nurses and staff |
| Relational/Parent factors – Recommended by someone | Recommended by friend or family member Cares for whole family |
|
Novel sub-categories: Relational/Parent factors – Familiarity with a pediatrician or a practice from prior experience Relational/Parent factors – Good first impression System/Office factors – Office characteristics - able to see the same pediatrician (continuity) System/Office factors – Office characteristics - diverse patient population System/Office factors – Office characteristics – offers a wide range of services Physician factors- Technical skills/Practice style – speaks the same language |
Not mentioned in current study: Board Certification Covered by insurance or part of HMO* |
Insurance was explicitly asked about in the current study, so we do not expect to find this among the “What else mattered?” responses.
What factors mattered the most to women when choosing a pediatric practice?
Almost all (n=366; 99.7%) participants responded to the question “What mattered the most?” Among these, 234 (63.8%) named one of the 12 factors we directly inquired about as one of the factors that “mattered the most” to them. These included, “already knowing a pediatrician at the practice” (n=76; 20.7%) and the “practice accepting the mother’s insurance” (n=36; 9.8%). Most women who had named an “other” factor and responded to the question about what mattered most (n=107) named one of their “other” factor as one that “mattered the most” to them. Using the themes and sub-themes applied in the qualitative analysis of “other” factors, we found that the factors that “mattered the most” included Physician Interpersonal Skills (e.g., communication, positive personality traits, professionalism, puts people at ease) (n=29; 27.1%), Experience or Familiarity With the Pediatrician and/or Pediatric Practice (e.g., personal experience or cares for other children in the family) (n=22; 20.6%;) and Access (e.g., doctor continuity, easy to reach, efficiency, hours available for visits, parking) (n=18; 16.8%). Factors named less often as one that “mattered the most” by this sub-group of women included a Recommendation from Someone (n=1; 0.9%) and Good First Impression (n=1; 0.9%).
Discussion
In this mixed-methods study, women from a largely low-income, racial/ethnic minority population described factors that mattered to them when choosing a pediatric practice. When asked to respond to 12 specific factors, a high percentage of women rated whether a practice accepted their insurance and the ability to get in touch with the office by phone as factors that mattered a lot. Perhaps more importantly, when given the option to name additional factors other than those specifically asked about, a high proportion of women stated that physician factors such as interpersonal and/or technical skills and issues related to access to care mattered the most to them.
Familiarity with the pediatrician and/or the pediatric practice also “mattered a lot” to many women. This was, not surprisingly, more common amongst women who already had a child, but was also noted amongst those having their first child. One possible explanation for the high ranking of this factor is the percentage of women in this population who had an existing or recent relationship with a pediatrician, either for herself or for an older child. We also found that online quality scores “mattered a lot” to fewer women, consistent with other studies of how patients make medical care choices.29 Bivariable analyses showed some important differences related to patient characteristics. For example, the finding that more participants with lower health literacy scores and lower educational attainment rated closeness of a practice to home as a factor that mattered a lot when choosing a pediatric practice may be related to absence of reliable personal transportation and may speak to limited functional choice. The finding that Hispanic women were more likely to rate familiarity with office staff or a pediatrician as a factor that mattered a lot may relate to variation in cultural practices, or could also be due to more Hispanic women in the study already having a child.
Our findings could be considered a validation of the increasing use of patient experience measures in performance measurement programs. For example, communication is a key element of the Centers for Medicare and Medicaid Services’ (CMS) Consumer Assessment of Healthcare Providers and Systems (CAHPS) survey.30 Many women named factors closely related to existing domains of patient experience measures, such as Communication and Access, as the factors that were most important to them. While measures of clinical quality, such as those found in the Healthcare Effectiveness and Data Information Set,1 have been used to measure quality performance for decades, our study suggests that these factors may not be the ones that mothers care about most. It is possible that parents assume clinical care quality does not vary and seek the best fit based on other criteria.
In addition to the need to make relevant data available, this study also reinforces the importance of patients being able to select the quality data they view so that they can tailor what they see to their individual interests. As noted in the Results section, most of the factors we asked about mattered to some degree to some women in the study, with variation in the number of women for whom they mattered a lot. Prior studies suggest that maximizing the pertinence of publicly reported quality data for patients is likely to increase use of these data.31,32 Narrative reviews are one mechanism for increasing both the pertinence and the ability to participate in assessing quality. Designing reporting systems that enable consumers to easily choose what data they view may increase utility and use of publicly reported quality data.33–35
This study’s findings should be considered in the context of prior research. A web-based survey study of 1687 parents sought to determine how important board certification was to parents when choosing a pediatrician.18 Most respondents (65%) rated assessment of care quality for common medical problems and insurance acceptance (61%) as very important, somewhat different from ratings in the current study. Differences in the populations studied, the focus of the research questions, and the modes of survey administration may explain the differences observed. In another web-based survey of 1,619 parents, 74% of respondents reported being aware of physician rating websites and 28% reported using such sites to choose a pediatrician.19 The study also differed from the current study in that it explored parent use of patient reported narratives and the population was largely White (64%). However, it suggests that consumers may have a preference for data related to patient experience, which is consistent with findings from the current study.9 Finally, emerging data also support consumer preference for provider-level data. CMS has responded to this by launching “Physician Compare”36 although provider level quality data are not yet available on the site.
This was the first study to elicit factors that mattered to mothers from low-income racial/ethnic minority populations when choosing a pediatric practice. This study complements the work by Coker at al. showing low income racial/ethnic minority women’s preferences for well child care delivery.17 The focus on a population that suffers from disparities in health and health care and that is underrepresented in research on care preferences is an important aspect of the study. Limitations of the study included the potential for social desirability bias introduced by reading questionnaire items aloud. However, this approach was deemed necessary to overcome reading challenges for lower literacy participants. Second, in the course of piloting, we learned that women preferred not to be forced to choose one “most important” factor, so we allowed women to name multiple factors that were most important to them if they felt strongly that they could not limit their response to one factor. Third, although we used cognitive testing to determine what specific factors we should ask women to rate, a large number of women named “other” factors as most important. This may have occurred for several reasons. When we asked women what factors to include during pilot testing, we emphasized choosing a practice versus choosing a pediatrician because the website used in the larger study reported quality data at the practice level and at that stage women were responding to a hypothetical question. Many of the “other” factors women named were either closely related to the 12 factors that had been derived from pilot testing or were related to pediatrician-specific traits. Finally, we did not include fathers in the study, but prior research indicates women are more likely to attend their child’s health care visits than fathers.37
Conclusions
In this survey study of women from low-income and racial/ethnic minority populations, we learned that pediatrician characteristics and factors related to patient experience, such as access to care mattered more than conventional clinical quality measures when they chose a pediatric practice or a pediatrician. This study suggests that next steps for measuring and reporting health care quality data should include not only further studies to determine what information parent groups find relevant when choosing a pediatrician, but also determining the best channels by which to communicate this information. Ongoing efforts to provide parents with quality data that is useful to them can then match these needs.
What’s New?
This study suggests that women in an underserved population may consider relational factors and issues related to access to care more important than the clinical quality data that have dominated quality measures for decades when deciding where to take their newborn for pediatric care. The addition of robust measures in these realms, possibly including patient narrative reviews, may help to align quality measures with what matters to some patients.
Acknowledgments
We would like to thank the staff at the Wesson Women’s Clinic for their gracious welcoming of our presence in their clinic during the course of this study and Massachusetts Health Quality Partners for their assistance with technical aspects of the data. This study was funded by the Agency for Healthcare Research and Quality (AHRQ) R21HS021864. AHRQ did not have any involvement in the study design, data collection, analysis, manuscript, or submission decisions. Dr. Goff is currently supported by the National Institute of Child Health and Human Development Award Number K23HD080870. Dr. Lagu is supported by the National Heart, Lung, and Blood Institute of the National Institutes of Health Award Number K01HL114745.
Appendix: Technical Details Massachusetts Health Quality Partners Data
Massachusetts Health Quality Partners Background
Massachusetts Health Quality Partners (MHQP), founded in 1995, is an independent organization whose mission is “to drive measurable improvements in health care quality, patients’ experiences of care, and use of resources in Massachusetts through patient and public engagement and broad-based collaboration among health care stakeholders.” The organization is informed by an expansive coalition of stakeholders, including physicians, hospitals, insurance companies, health plans, purchasers, patient and public representatives, academics, and government agencies. The MHQP website (www.mhqp.org) is a public resource that provides rating information about medical offices and groups in the domains of clinical quality and patient experience. The website has been changed since the study was conducted and the website used in the study is archived at http://www.reports.mhqp.org/.
Measuring Clinical Quality
MHQP uses clinical quality measures taken from the Healthcare Effectiveness Data and Information Set (HEDIS® Measure Set). The most recent clinical quality data set available at the onset of IDEAS for a Healthy Baby was based on HEDIS® 2011 measures, which generally reflect the performance of medical groups in the 2010 calendar year.
The quality data provided for clinical quality measures is reported at the medical group level. Consumers can search the clinical quality report for a specific primary care physician (PCP) or medical office, but the data reported will still be at the level of the medical group with which the PCP or medical office is associated. To meet the criteria for inclusion in the report, medical groups must have at least 3 clinicians and 2 HEDIS measures with 30 or more patients contributing to the results. Practices with one or two doctors are included if they are part of a larger medical group that meets these criteria.
Performance on selected clinical quality measures are is derived from the HEDIS measure set, for managed care members of the five participating commercial insurance carriers collaborating with MHQP: Blue Cross Blue Shield of Massachusetts, Fallon Community Health Plan, Harvard Pilgrim Health Care, Health New England, and Tufts Health Plan.
MHQP performance scores are calculated by dividing the number of people who received a recommended health care service by the number of people who should have received the service. For the purpose of the IDEAS study, we showed participants the six measures most relevant to pediatric care.
Measuring Patient Experience
Patient experience is measured through a survey that asks adults and parents of pediatric patients about their experiences with primary care during the preceding year. The most recent patient experience data set available at the onset of the IDEAS for a Healthy Baby study was collected in a 2011 statewide survey conducted by MHQP and their five member health plans. The population sampled included parents of patients at pediatric sites with at least three physicians in MHQP’s provider database who have a panel size of at least 50 eligible patients across the five participating insurance plans. The survey instrument was developed using items from The Ambulatory Care Experiences Survey (ACES) and from The Clinition/Group CAHPS® Survey. The instrument focused on two aspects of the patient experience: quality of patient-doctor interaction and organizational features of care.
About the Star Rating System
Clinical Quality
To convert raw clinical quality data to a star rating, MHQP used three benchmarks: the national average; the national 90th percentile; and Massachusetts statewide performance. If a medical group did not have a sufficient number of eligible patients (at least 30) for a specific measure, “ND” was used to indicate that MHQP has too little data to report on the measure. A medical group with sufficient eligible patients who had a rate below all three benchmarks received one star. Additional stars were awarded for each benchmark surpassed (i.e., two stars means the rate is above one benchmark, three stars means the rate is above two benchmarks, and four stars means the rate is above all three benchmarks). Benchmarks included: 1) National average for a measure; 2) National 90th percentile for a measure; and 3) State rates for a measure.
Patient Experience
The majority of the patient experience measures are assigned a star rating based on the following percentiles: above the 85th percentile (four stars); above the 50th percentile (three stars); above the 15th percentile (two stars); and below the 15th percentile (one star). These cut points shifted for some measures that had consistently high statewide performance (e.g., Communication and Knowledge of Patient). For these measures, cut points were based on absolute thresholds (80, 90, and 95 points, respectively) rather than percentiles.
Pediatric Clinical Quality Measures shown to IDEAS for a Healthy Baby Participants
| Well-Child Visits: |
| Well Visits for Children 0 to 15 Months of Age |
| Well Visits for Children Ages 3 to 6 |
| Well Visits for Adolescents Ages 12 to 21 |
| Pediatric Medications and Testing: |
| Follow-up with Children Starting Medication for ADHD |
| Correct Testing for Strep Throat (Pharyngitis) |
| Correct Antibiotic Use for Upper Respiratory Infections |
MHQP Star Ratings: A Short Guide
Want to know more about what MHQP’s stars mean? This short guide will give you more information about the data MHQP uses, and what goes into the star ratings.
Clinical Quality Stars
-
Where do the data come from?
For clinical quality measures, MHQP collects information on the services provided to patients during doctor’s visits. This allows them to see things like which patients get recommended care like appropriate medications, vaccinations, and regular check-ups.
-
What do clinical quality stars mean?
When coming up with the star ratings, MHQP use 3 benchmarks, or 3 standards, and compares all practices to these benchmarks:- Benchmark #1: The Massachusetts state average
- Benchmark #2: Average of all doctor’s offices in the country
- Benchmark #3: The top 10% of doctor’s offices in the country
This means that, when comparing practices, they look to see whether a practice did better than the average Massachusetts practice, better than the average practice in the country, and better than the top 10% of practices in the country.
The stars tell you how well a practice did when compared to these benchmarks.-
◦
 Means that the practice did better than all 3 benchmarks. That’s the best that a practice can do!
 -
◦
 Means that the practice did better than 2 of the benchmarks. That’s pretty good.
 -
◦
 Means that the practice did better than 1 benchmark. That means there’s some room for improvement on that measure.
 -
◦
 Means that the practice didn’t do better than ANY of the benchmarks. That means the practice really needs to improve that part of their care.
Patient Experiences Stars
-
Where do the data come from?
For patient experience measures, MHQP gathered information using a survey that they gave to patients at over 150 medical groups in Massachusetts. They asked about patients’ experiences with office staff, how well doctors give care and advice, and how easy it is for patients to get appointments when they need them. They combined information from individual questions on the survey to score each practice on these important patient care measures.
-
What do patient experience stars mean?
When coming up with the star ratings for patient experience, MHQP compared practices scores on these measures, and rated them according to three benchmarks:- Practices that did better than at least 85% of the other practices
- Practices that did better than at least 50% of the other practices
- Practices that did better than at least 15% of the other practices
This means that, when they were comparing practices, they looked to see how well a practice did compared to the others using these 3 benchmarks.-
◦
 Means that the practice did better than at least 85% of practices in the survey. That’s the best that a practice can do!
 -
◦
 Means that the practice did better than at least 50% of practices in the survey. That’s pretty good.
 -
◦
 Means that the practice did better than at least 15% of practices in the survey. That means there’s some room for improvement on that measure.
 -
◦
 Means that the practice did worse than at least 85% of practices in the survey. That means the practice really needs to improve that part of their care.
MHQP Website Instructions
Go to MHQP website: www.mhqp.org
-
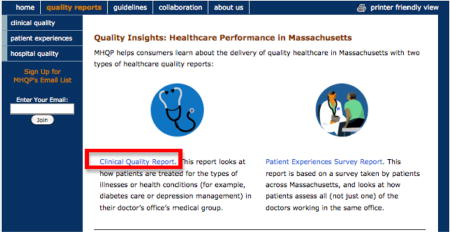
Click on the “quality reports” tab on the tool bar along the top of the screen.

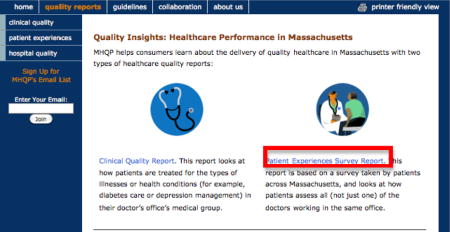
To look at Patient Experience Information (this is information like how well doctors know their patients, how easy it is to get an appointment when you need one, and whether or not another parent would recommend a practice to others), go back to the quality reports page by clicking on the “quality reports” tab on the toolbar along the top of the screen.
-
Click on the “Patient Experiences Survey Report” link.
-
Decide how you want to search for information about a doctor’s office!
- You can search for medical groups …
-
◦By location – type in a zip code and find out which doctors are closest to your home
-
◦By the name of the medical group – search for a practice based on the name of a company you already know
-
◦By doctor’s office – know the name of the practice? Type it in here!
-
◦By the name of a doctor – know your doctor’s name but not the practice?Type in the doctor’s name, and get information about the practice where he/she works!
-
◦
-
For patient experience information, you can select whether you want to search for adult medicine providers, pediatrics providers, or both. Select “Pediatrics” to narrow down your list.
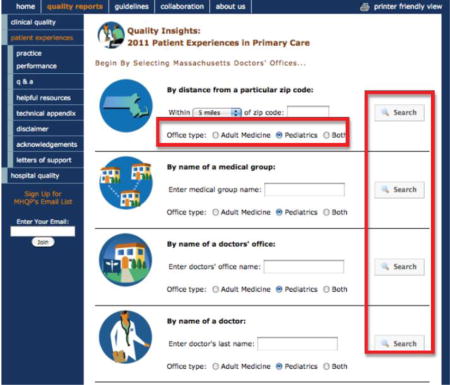
Once you have entered information into a search box and selected “Pediatrics” below that box, click the “Search” button to the right of the box.
-
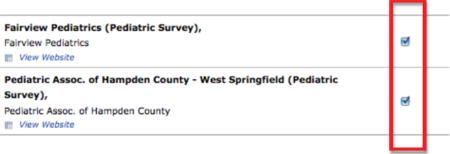
Select your practice(s).
-
Once you have searched using one of the search options, you will be able to look more closely at practices. Select practice(s) from the list.
-
-
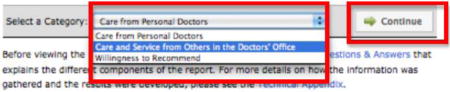
Then, use the drop-down box at the bottom of the screen to select which category you want to view information about. Click “Continue.”
-
View information about the practices you selected!
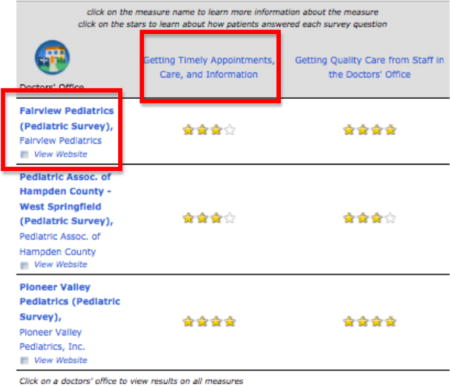
Use MHQP’s star system to see how well each practice does on important measures of healthcare quality. How easy is it to get an appointment when your child is sick? Is the staff at the office friendly and respectful? Check it out!
Want more information about the categories? Click on the blue words above the stars for an explanation of what each item measures.
Want to visit a practice’s website? Click the “View Website” link under the practice’s name (Not all practices have websites).
-
Want to see how a practice does on all Patient Experience measures? Click on the practice’s name in blue.
To look at Clinical Quality Information (this is information like whether doctors make sure that patients get the recommended number of well-child visits, whether they give patients antibiotics only when they need them, and whether they test for strep throat when they should), go back to the quality reports page by clicking on the “quality reports” tab on the toolbar along the top of the screen.
-
Click on the “Clinical Quality Report” link.
-
Click the “Search for Your Doctor’s Medical Group Results” button.

Use the same tools outlined in the Patient Experience walk-through above to view Clinical Quality information for different pediatric practices.
Survey Questions
Different people choose pediatricians for different reasons. In this next set of questions, I am going to ask you how much each of the following items MATTERED to you when you decided which pediatrician (or which office) to bring your new baby to.
-
How close the office is to your home*
-
□
Did not matter at all
-
□
Mattered a little
-
□
Mattered somewhat
-
□
Mattered a lot
-
□
Did not think about this item
-
□
Not sure/Don’t know
-
□
Refused to answer
*The same response options were offered for each question.
-
□
How easily you can get to the office using public transportation (like a bus)
How easily you can get in contact with someone in the pediatrician’s office by phone
Recommendation from a friend about a pediatrician
Recommendation from a family member about a pediatrician
Recommendation from a doctor (like your primary care doctor or OB) about a pediatrician
You already knew the pediatrician you chose
You already knew the office staff at the practice you chose
Your insurance is accepted by that pediatrician (or group of pediatricians)
Information found on the pediatrician’s website
Information found online about how well the office does on measures of care quality (such as how well patients are treated for different types of illnesses or health conditions in their doctor’s office.)
Information found online about what other parents think of the practice (such as how willing parents are to recommend the practice, and how much parents think that doctors care about their patients) m. Were there any other things that mattered to you (and how much did they matter?)
-
Were there any other things that mattered to you (and how much did they matter?)

Footnotes
Potential Conflicts of Interest/Financial disclosures: Dr. White is a consultant for Actavis.
References
- 1.NCQA > HEDIS & Quality Measurement [Internet] [cited 2013 Oct 1]; Available from: http://www.ncqa.org/HEDISQualityMeasurement.aspx.
- 2.Scholle SH, Vuong O, Ding L, et al. Development of and field test results for the CAHPS PCMH Survey. Med Care. 2012;50(Suppl):S2–10. doi: 10.1097/MLR.0b013e3182610aba. [DOI] [PMC free article] [PubMed] [Google Scholar]
- 3.Berwick DM, James B, Coye MJ. Connections between quality measurement and improvement. Med Care. 2003;41(1 Suppl):I30–38. doi: 10.1097/00005650-200301001-00004. [DOI] [PubMed] [Google Scholar]
- 4.Fung CH, Lim Y-W, Mattke S, Damberg C, Shekelle PG. Systematic review: the evidence that publishing patient care performance data improves quality of care. Ann Intern Med. 2008;148(2):111–23. doi: 10.7326/0003-4819-148-2-200801150-00006. [DOI] [PubMed] [Google Scholar]
- 5.Ketelaar NABM, Faber MJ, Flottorp S, Rygh LH, Deane KHO, Eccles MP. Public release of performance data in changing the behaviour of healthcare consumers, professionals or organisations. Cochrane Database Syst Rev. 2011;(11):CD004538. doi: 10.1002/14651858.CD004538.pub2. [DOI] [PMC free article] [PubMed] [Google Scholar]
- 6.Hibbard JH, Peters E, Dixon A, Tusler M. Consumer competencies and the use of comparative quality information: it isn’t just about literacy. Med Care Res Rev MCRR. 2007;64(4):379–94. doi: 10.1177/1077558707301630. [DOI] [PubMed] [Google Scholar]
- 7.Lagu T, Lindenauer PK. Putting the public back in public reporting of health care quality. JAMA. 2010;304(15):1711–2. doi: 10.1001/jama.2010.1499. [DOI] [PubMed] [Google Scholar]
- 8.Hibbard JH, Slovic P, Jewett JJ. Informing consumer decisions in health care: implications from decision-making research. Milbank Q. 1997;75(3):395–414. doi: 10.1111/1468-0009.00061. [DOI] [PMC free article] [PubMed] [Google Scholar]
- 9.Yegian JM, Dardess P, Shannon M, Carman KL. Engaged patients will need comparative physician-level quality data and information about their out-of-pocket costs. Health Aff Proj Hope. 2013;32(2):328–37. doi: 10.1377/hlthaff.2012.1077. [DOI] [PubMed] [Google Scholar]
- 10.Bornstein BH, Marcus D, Cassidy W. Choosing a doctor: an exploratory study of factors influencing patients’ choice of a primary care doctor. J Eval Clin Pract. 2000;6(3):255–62. doi: 10.1046/j.1365-2753.2000.00256.x. [DOI] [PubMed] [Google Scholar]
- 11.Arora R, Singer J, Arora A. Influence of Key Variables on the Patientsʼ Choice of a Physician: Qual Manag Health Care. 2004;13(3):166–73. doi: 10.1097/00019514-200407000-00003. [DOI] [PubMed] [Google Scholar]
- 12.Engstrom S, Madlon-Kay DJ. Choosing a family physician. What do patients want to know? Minn Med. 1998;81(12):22–6. [PubMed] [Google Scholar]
- 13.Harris KM. How Do Patients Choose Physicians? Evidence from a National Survey of Enrollees in Employment-Related Health Plans. Health Serv Res. 2003;38(2):711–32. doi: 10.1111/1475-6773.00141. [DOI] [PMC free article] [PubMed] [Google Scholar]
- 14.Hill C, Garner S. Factors influencing physician choice. Hosp Health Serv Adm. 1990;36(4):491–503. [PubMed] [Google Scholar]
- 15.McGlone TA, Butler ES, McGlone VL. Factors Influencing Consumers’ Selection of a Primary Care Physician. Health Mark Q. 2002;19(3):21–37. doi: 10.1300/J026v19n03_03. [DOI] [PubMed] [Google Scholar]
- 16.Mercado F, Mercado M, Myers N, Hewit M, Haller NA. Patient Preferences in Choosing a Primary Care Physician. J Prim Care Community Health. 2012;3(2):125–31. doi: 10.1177/2150131911421802. [DOI] [PubMed] [Google Scholar]
- 17.Coker TR, Chung PJ, Cowgill BO, Chen L, Rodriguez MA. Low-income parents’ views on the redesign of well-child care. Pediatrics. 2009;124(1):194–204. doi: 10.1542/peds.2008-2608. [DOI] [PMC free article] [PubMed] [Google Scholar]
- 18.Freed GL, Dunham KM, Clark SJ, Davis MM, Research Advisory Committee of the American Board of Pediatrics Perspectives and preferences among the general public regarding physician selection and board certification. J Pediatr. 2010;156(5):841–845. 845.e1. doi: 10.1016/j.jpeds.2009.11.055. [DOI] [PubMed] [Google Scholar]
- 19.Hanauer DA, Zheng K, Singer DC, Gebremariam A, Davis MM. Parental awareness and use of online physician rating sites. Pediatrics. 2014;134(4):e966–975. doi: 10.1542/peds.2014-0681. [DOI] [PubMed] [Google Scholar]
- 20.Kapphahn CJ, Wilson KM, Klein JD. Adolescent girls’ and boys’ preferences for provider gender and confidentiality in their health care. J Adolesc Health Off Publ Soc Adolesc Med. 1999;25(2):131–42. doi: 10.1016/s1054-139x(99)00050-6. [DOI] [PubMed] [Google Scholar]
- 21.Turow JA, Sterling RC. The role and impact of gender and age on children’s preferences for pediatricians. Ambul Pediatr Off J Ambul Pediatr Assoc. 2004;4(4):340–3. doi: 10.1367/A03-110R1.1. [DOI] [PubMed] [Google Scholar]
- 22.Goff SL, Mazor KM, Pekow PS, et al. Patient Navigators and Parent Use of Quality Data: A Randomized Trial. Pediatrics. 2016 doi: 10.1542/peds.2016-1140. [DOI] [PMC free article] [PubMed] [Google Scholar]
- 23.Giordano LA, Elliott MN, Goldstein E, Lehrman WG, Spencer PA. Development, implementation, and public reporting of the HCAHPS survey. Med Care Res Rev MCRR. 2010;67(1):27–37. doi: 10.1177/1077558709341065. [DOI] [PubMed] [Google Scholar]
- 24.Elliott MN, Zaslavsky AM, Goldstein E, et al. Effects of survey mode, patient mix, and nonresponse on CAHPS hospital survey scores. Health Serv Res. 2009;44(2 Pt 1):501–18. doi: 10.1111/j.1475-6773.2008.00914.x. [DOI] [PMC free article] [PubMed] [Google Scholar]
- 25.Rosal MC, Carbone ET, Goins KV. Use of cognitive interviewing to adapt measurement instruments for low-literate Hispanics. Diabetes Educ. 2003;29(6):1006–17. doi: 10.1177/014572170302900611. [DOI] [PubMed] [Google Scholar]
- 26.Carbone ET, Campbell MK, Honess-Morreale L. Use of cognitive interview techniques in the development of nutrition surveys and interactive nutrition messages for low-income populations. J Am Diet Assoc. 2002;102(5):690–6. doi: 10.1016/s0002-8223(02)90156-2. [DOI] [PubMed] [Google Scholar]
- 27.Shah LC, West P, Bremmeyr K, Savoy-Moore RT. Health literacy instrument in family medicine: the “newest vital sign” ease of use and correlates. J Am Board Fam Med JABFM. 2010;23(2):195–203. doi: 10.3122/jabfm.2010.02.070278. [DOI] [PubMed] [Google Scholar]
- 28.Glaser BG. The Constant Comparative Method of Qualitative Analysis. Soc Probl. 1965;12(4):436–45. [Google Scholar]
- 29.Victoor A, Delnoij DMJ, Friele RD, Rademakers JJDJM. Determinants of patient choice of healthcare providers: a scoping review. BMC Health Serv Res. 2012;12:272. doi: 10.1186/1472-6963-12-272. [DOI] [PMC free article] [PubMed] [Google Scholar]
- 30.Patient Satisfaction Measurement: Current Issues and Implications: Professional Case Management [Internet] LWW; [cited 2015 Feb 2]; Available from: http://journals.lww.com/professionalcasemanagementjournal/Fulltext/2002/09000/Patient_Satisfaction_Measurement__Current_Issues.6.aspx. [Google Scholar]
- 31.Marshall M, Davies H. Public release of information on quality of care: how are health services and the public expected to respond? J Health Serv Res Policy. 2001;6(3):158–62. doi: 10.1258/1355819011927413. [DOI] [PubMed] [Google Scholar]
- 32.Schlesinger M, Kanouse DE, Martino SC, Shaller D, Rybowski L. Complexity, public reporting, and choice of doctors: a look inside the blackest box of consumer behavior. Med Care Res Rev MCRR. 2014;71(5 Suppl):38S–64S. doi: 10.1177/1077558713496321. [DOI] [PMC free article] [PubMed] [Google Scholar]
- 33.Lagu T, Goff SL, Craft B, et al. Can social media be used as a hospital quality improvement tool? J Hosp Med. 2016;11(1):52–5. doi: 10.1002/jhm.2486. [DOI] [PMC free article] [PubMed] [Google Scholar]
- 34.Lagu T, Goff SL, Hannon NS, Shatz A, Lindenauer PK. A mixed-methods analysis of patient reviews of hospital care in England: implications for public reporting of health care quality data in the United States. Jt Comm J Qual Patient Saf Jt Comm Resour. 2013;39(1):7–15. doi: 10.1016/s1553-7250(13)39003-5. [DOI] [PubMed] [Google Scholar]
- 35.Emmert M, Schlesinger M. Hospital Quality Reporting in the United States: Does Report Card Design and Incorporation of Patient Narrative Comments Affect Hospital Choice? Health Serv Res. 2016 doi: 10.1111/1475-6773.12519. [DOI] [PMC free article] [PubMed] [Google Scholar]
- 36.Physician Compare Initiative - Centers for Medicare & Medicaid Services [Internet] [cited 2016 Feb 17]; Available from: https://www.cms.gov/medicare/quality-initiatives-patient-assessment-instruments/physician-compare-initiative/
- 37.Moore T, Kotelchuck M. Predictors of Urban fathers’ involvement in their child’s health care. Pediatrics. 2004;113(3 Pt 1):574–80. doi: 10.1542/peds.113.3.574. [DOI] [PubMed] [Google Scholar]