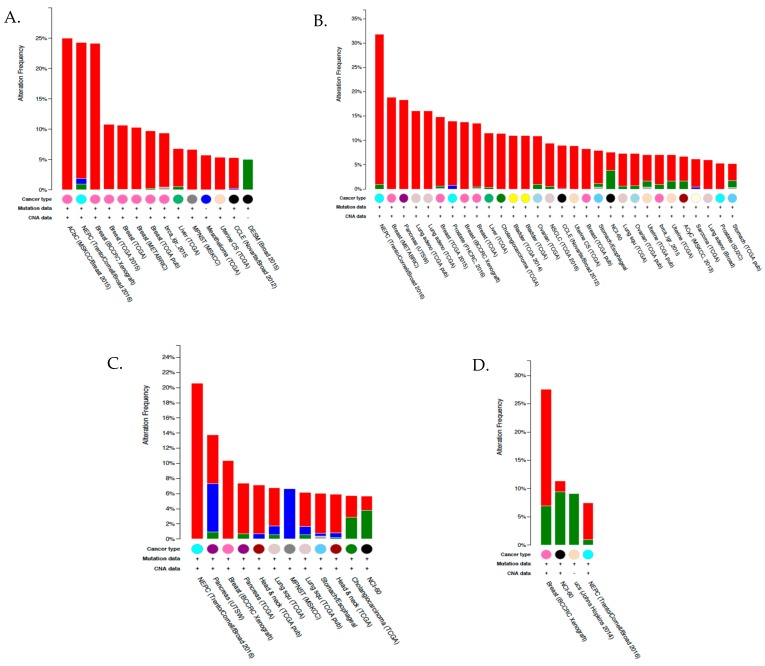
Figure 5.
Summary of cross-cancer alterations for CA isoforms. (A) GPI-anchored CA IV, (B–D) transmembrane isoforms CA XIV, CA IX, and CA XIV, respectively. Gene amplifications are shown in red, mutations in green, deletions in blue, and multiple alterations in gray. The minimum percent altered samples threshold was set to 5%. The data and results were obtained from the cBioPortal of TCGA. Experimental details of each study referenced can also be found in the TCGA database.

