Abstract
The advent of silicon photomultipliers (SiPMs) has introduced the possibility of increased detector performance in commercial whole-body PET scanners. The primary advantage of these photodetectors is the ability to couple a single SiPM channel directly to a single pixel of PET scintillator that is typically 4 mm wide (one-to-one coupled detector design). We performed simulation studies to evaluate the impact of three different event positioning algorithms in such detectors: i) a weighted energy centroid positioning (Anger logic), ii) identifying the crystal with maximum energy deposition (1st max crystal), and iii) identifying the crystal with second highest energy deposition (2nd max crystal). Detector simulations performed with LSO crystals indicate reduced positioning errors when using the 2nd max crystal positioning algorithm. These studies are performed over a range of crystal cross-sections varying from 1×1 mm2 to 4×4mm2 as well as crystal thickness of 1 cm to 3 cm. System simulations were performed for a whole-body PET scanner (85 cm ring diameter) with a long axial FOV (70 cm long) and show an improvement in reconstructed spatial resolution for a point source when using the 2nd max crystal positioning algorithm. Finally, we observe a 30-40% gain in contrast recovery coefficient (CRC) values for 1 and 0.5 cm diameter spheres when using the 2nd max crystal positioning algorithm compared to the 1st max crystal positioning algorithm. These results show that there is an advantage to implementing the 2nd max crystal positioning algorithm in a new generation of PET scanners using one-to-one coupled detector design with lutetium based crystals, including LSO, LYSO or scintillators that have similar density and effective atomic number as LSO.
1. Introduction
Detectors in commercial whole-body PET scanners typically use 20-25 mm long crystals with narrow cross-section (e.g., 4×4 mm2) arranged in rectangular arrays and have traditionally been coupled to large PMTs via a light sharing technique that has evolved from the design of the original block detector (Casey and Nutt, 1986), quadrant sharing block detector (Wong et al., 1994), or the pixelated Anger-logic detector (Surti et al., 2000). The effects of Compton scatter in the crystals, as well as light loss and optical cross-talk due to the light sharing detector design, combine with the crystal cross-section to define the detector spatial resolution. Thus, spatial resolution can potentially be improved by replacing the light sharing detector design with a detector using direct coupling of the crystal to a single channel of a photo-sensor (one-to-one coupling). In fact one-to-one coupled detector design was utilized in some of the earliest PET scanners, such as the Washington University Super PETT (Ter-Pogossian et al., 1982) or the LETI TTV (Gariod et al., 1982) scanners, which achieved excellent timing performance with this detector configuration. However, the spatial resolution was limited with the use of large 28-mm diameter PMTs. Even today, traditional, single channel PMTs are not available in sizes smaller than 10 mm. Although there have been PET detector designs based on multi-anode PMTs (Son et al., 2016, Krishnamoorthy et al., 2014), it is the more recent development and availability of SiPM arrays that has made the design of one-to-one coupled PET detectors practical with smaller crystals (Kim et al., 2012, Raylman et al., 2014, Du et al., 2016, Degenhardt et al., 2009, Frach et al., 2009). The SiPM arrays together with advancements in new ASIC designs, now makes it feasible to develop commercial whole-body PET with one-to-one coupled detectors and spatial resolution of 4-mm or better.
While weighted centroid (or Anger-logic) positioning as used in light-sharing detectors can be easily adapted to a one-to-one coupled detector for event interaction localization, there is an opportunity to utilize other positioning schemes to better estimate the first interaction point (FIP) of the annihilation photon in the detector that will lead to improved image resolution (Cho and Juh, 1991, Shao et al., 1996, Comanor et al., 1996, Miyaoka and Lewellen, 2000). In the past, researchers have investigated such ideas primarily in the context of high resolution imaging with crystal sizes smaller than those used for clinical imaging and quite often with depth-of-interaction (DOI) measurement. The results of these studies showed that FIP is best determined with an algorithm other than Anger-logic, which leads to a reduction in the percentage of annihilation photons positioned in a crystal other than the irradiated crystal (misidentification factor, or MIF).
In this work we re-visit the idea of using different positioning algorithms in one-to-one coupled detectors and study the impact it has on detector positioning accuracy as a function of incident angle, crystal size, and crystal thickness for LSO. As opposed to past work our focus is on whole-body scanners, and beyond detector accuracy, our study also investigates the impact of the different positioning algorithms on contrast recovery coefficient (CRC) of small, low uptake, spheres measured from reconstructed images. Due to partial volume effects, CRC in small, low uptake spheres will be most sensitive to any changes in image spatial resolution that we may see in this work.
We are particularly interested in the impact of the positioning algorithm on the Philips tile detector that is incorporated in their Vereos PET/CT scanners (Miller et al., 2015). This tile detector uses an 8×8 array of 3.86 × 3.86 × 19 mm3 crystals one-to-one coupled to a Philips Digital Photon Counter (PDPC) sensor (a 8×8 channel digital SiPM array) (Degenhardt et al., 2009, Frach et al., 2009). This tile detector is also being used in the PennPET XL scanner with a 70 cm axial FOV that is currently under development (Karp et al., 2017, Viswanath et al., 2017). Our system simulation work uses a scanner design analogous to the PennPET XL since: (i) we can potentially implement the best positioning approach on the scanner while it is under development, and (ii) the longer axial FOV allows oblique lines-of-response (up to ± 45°) where any errors in detector positioning will have impact in both the transverse and axial directions.
2. Methods
2.1. Detector simulations
We performed scintillation detector simulations using Montecrystal (Karp and Muehllehner 1985, Surti et al. 2000) that starts with 511 keV annihilation photons entering the detector at a pre-defined position and trajectory. Montecrystal simulation has been successfully used by our group in the development of specialized PET scintillation detectors for over three decades. While other larger simulations such as EGS4 and GEANT can be used for this work, Montecrystal offers significant flexibility and efficiency in producing results. The path and interactions of each annihilation photon are traced using Compton scatter and photoelectric cross-sections and the Klein-Nishina equation, until it deposits all its energy or exits the detector. For this work we modeled the detector as a one-to-one coupling of small discrete LSO crystals to individual photodetector (SiPM) elements without a lightguide (figure 1a). Hence, scintillation photon generation and ray tracing was not utilized. The annihilation photon angle of incidence θ was varied from 0° to 60° in 10° steps. We estimated each annihilation photon interaction position in the detector by using the energy deposited in individual crystals by that photon. Positioning was performed using (see figure 1b): (i) a weighted energy centroid (Anger-logic) algorithm based solely on the energy spread among crystals without any optical photon light spread, (ii) identification of the crystal with the highest energy deposited (1st max crystal), and (iii) identification of the crystal with the second highest energy deposited (2nd max crystal). The 1st max and 2nd max crystal algorithms were chosen because they have been investigated extensively in the past and have shown promising results for small crystal cross-sections. In particular, the detector used in Philips Vereos PET/CT uses the 1st max crystal as the default positioning algorithm. Global energy threshold in these simulations was set at 440 keV. For this work we used crystal cross-sections of 1×1 mm2, 2×2 mm2, 3×3 mm2, and 4×4 mm2, where the SiPM channel size is scaled to match the crystal cross-section in a one-to-one coupling. While we investigate smaller cross-section crystals at this stage, our primary focus subsequently will be on 4×4 mm2 crystals that represent the typical size used in whole-body PET. Crystal thickness was 1 cm, 2 cm, and 3 cm. As shown in figure 1b the positioning error across the face of the detector will be calculated for each approach, although the impact on the reconstructed spatial resolution, and image quality (e.g., measured CRC) will be influenced by a combination of the positioning error and incident angle of the line-of-response. The metrics used will be the magnitude of the mean positioning error (or bias in positioning), standard deviation of the mean position, and the root mean squared error (RMSE) calculated as the square root of the sum of squares of the mean positioning error and its standard deviation.
Figure 1.
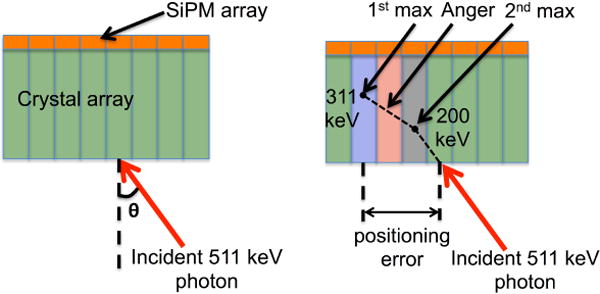
(a) Schematic diagram of 511 keV photons incident at an angle θ on a one-to-one coupled detector without any lightguide. (b) Schematic of a 511 keV photon interacting in two crystals first depositing 200 keV and then 311 keV. The three positioning algorithms define the 511 keV photon incident position as the red shaded crystal (Anger), blue shaded crystal (1st max crystal), and grey shaded crystal (2nd max crystal). The positioning error as calculated for the 1st max crystal positioning algorithm is indicated.
2.2. Scanner simulations
We performed EGS4-based system simulations (Surti et al., 2004) for a cylindrical PET scanner geometry using one-to-one coupled, 4×4×20 mm3 LSO crystals. In our specialized version of EGS4 for PET, instead of using the EGS4 framework for defining interactions within the PET detector, we have incorporated the Montecrystal simulation to specifically model the scintillation detector. Detector positioning in these simulations was performed using Anger, 1st max crystal, and 2nd max crystal positioning algorithms. The scanner ring diameter was fixed at 85 cm while the AFOV was 70 cm, approximating the dimensions of the PennPET XL scanner under development. The tile detector we are using in PennPET XL has 11-12% energy resolution and 220-315ps timing resolution (Viswanath et al., 2017, Karp et al., 2017), depending on the trigger level used (Degenhardt et al., 2009). In these simulations we model the scanner with 12% energy resolution (at 511 keV) and 300ps coincidence timing resolution, while using 440 keV lower energy threshold for event collection. For each annihilation event, the Monte Carlo simulation tracks the 511 keV photons through the phantom and the PET detector. Primary modes of interaction that are modeled are Compton and photoelectric in the water-filled phantom as well as the scintillation detector. The simulation output is a list-mode data set with time-of-flight (TOF) information.
The first set of simulations were for point sources placed in air at varying radial positions (0, 1, 5, 10, 15, and 20 cm) in the central transverse plane of the scanner to illustrate the effect of detector performance on spatial resolution. Subsequently, we simulated two lesion phantoms (35 cm diameter by 70 cm long) that emulate the distribution of a whole-body survey for an oncology study. Both true and scatter coincidences were simulated. The lesion phantoms had 16 hot lesions (spheres) placed in the central transverse slice with a water background. The lesion activity uptake ratio was set at 3:1 and 6:1 relative to the background for lesion sizes of 1 and 0.5 cm in the two phantoms, respectively. The lesion size and uptake were chosen to represent a challenging measurement for scanners where the potential impact of improved spatial resolution may be observable. In each phantom, eight lesions were uniformly distributed at a radial position of 7 cm from the center, while the other eight were uniformly distributed at a radial position of 13 cm from the center to capture the impact of parallax error. In figure 2 we show reconstructed images of the central transverse slice for these two phantoms in order to illustrate the distribution of lesions.
Figure 2.
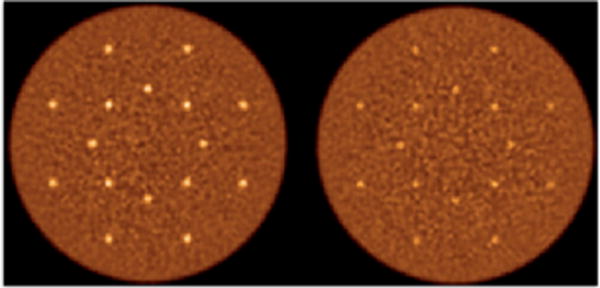
Reconstructed images of the central transverse slices for the simulated lesion phantoms with 1 cm (Left) and 0.5 cm (Right) diameter lesions. The water-filled cylinder was 35 cm diameter by 70 cm long and sphere uptake was 3:1 with respect to background. The distribution of 16 spheres in each phantom was at radial distances of 7 and 13 cm.
Point source data were reconstructed into 2×2×2 mm3 voxels using a 3D Fourier re-projection (3D-FRP) algorithm (Matej and Lewitt, 2001), with an unapodized filter (ramp filter with a cutoff at the Nyquist frequency). The choice of an analytical reconstruction algorithm (as opposed to an iterative version) was made since reconstructing point sources in air can lead to erroneous results due to the non-negative constraints present in typical iterative algorithm. This is also in accordance with the NEMA imaging standards for PET scanner system evaluation. The reconstructed images were used to form profiles in three orthogonal directions with profile width of 10 mm (≥ 2 × times the expected spatial resolution) in the orthogonal directions. Spatial resolution was measured as the equivalent width (EW) of each profile (total counts in profile/peak counts in profile, see figure 3). We used EW as a measure of the spatial resolution instead of the full-width at half maximum (FWHM) measure since it better captures the effect of non-Gaussian tails in the spatial profiles present due to detector Compton scatter.
Figure 3.
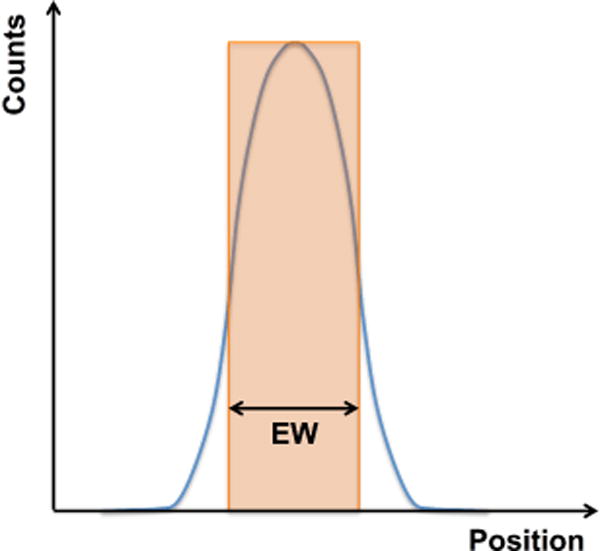
Schematic showing the spatial profile (blue curve) and the equivalent width (EW). EW is defined as the width of the rectangular region (in orange) that has height equal to the profile maximum, and width such that total counts within the region are the same as the total counts within the spatial profile.
List-mode data from the lesion phantom simulations were reconstructed using blob-basis functions for regularization (Matej and Lewitt, 1996) and our reconstruction algorithm that is implemented for clinical studies. The fully 3D list-mode TOF OSEM algorithm uses a Gaussian TOF kernel, 25 subsets, and normalization, attenuation, and scatter corrections built into the system model (Popescu, 2004). The end-points for each LOR are given by the physical location of the crystals (φ and z coordinates in a cylindrical coordinate system) where the two annihilation photons are determined to interact. The blob basis functions are on a body-centered cubic grid with an optimized blob spacing of 6 mm (blob radius of 7.5 mm). This choice of blob parameters leads to blob widths that are appropriate for the crystal size (and hence spatial resolution) used in this study (Matej and Lewitt, 1996). The reconstructed blob image is finally converted into 2 × 2 × 2 mm3 image voxels by summing the magnitude and intensity of each blob at a given image voxel center. Note that the noise characteristics of the image are determined only by the blob parameters while the 2 × 2 × 2 mm3 image voxels provide adequate sampling of the image space to determine lesion uptake. No point spread function (PSF) modeling was performed in the image reconstruction for this study. Attenuation maps were calculated analytically for a uniform water-filled cylinder with the same dimensions as the lesion phantom, and the scatter estimate was obtained using a TOF-extended single scatter simulation correction (Werner et al., 2006) that is similar in principle to the methods implemented commercially by Philips, as well as Siemens (ref to Watson). Normalization data were generated by performing uniform phantom simulations (40 cm diameter and 70 cm long) with a very high number of coincident events (an average of 5 events per line-of-response). Similar normalization techniques used clinically utilize a small diameter phantom due to the practical constraints of collecting enough coincident events from decaying activity after attenuation in the phantom in a reasonable amount of scan time. Since simulations are not limited by these practical constraints, we used a normalization phantom that is larger in size than the simulated lesion phantom, and hence requires no extrapolations to generate the normalization data for full scanner field-of-view. All data were used for image reconstruction without setting an upper limit for axial acceptance angle. Volumes-of-interest (VOIs) were drawn over each lesion, i, in an image (same diameter as the lesion) to measure the mean counts Ci. A 5 cm diameter VOI was also drawn at the center of the central transverse slice to measure the mean background counts Co. Contrast recovery coefficient (CRCi) was then calculated as , where a is the real lesion uptake ratio (3 and 6 for the 1 cm and 0.5 cm diameter lesions, respectively).
3. Results
3.1. Positioning accuracy in detector
In figure 4 we show the mean magnitude of the positioning error in 1D (difference between the estimated interaction point in the detector and the annihilation photon entry point) as a function of entrance angle of the annihilation photons. An angle of θ=0° corresponds to perpendicular incidence of the annihilation photon on the detector plane (no parallax error). Results are shown for the three positioning algorithms and the two extremes of crystal cross-section (1×1 mm2 and 4×4 mm2) but are systematically the same over all crystal sizes studied here. Our results show that overall the mean positioning error (bias in positioning) is lower for the shorter crystal for more oblique entrance angles. This is expected due to the reduced impact of Compton scatter in the thinner crystals. The mean positioning error does not change as a function of crystal size for the range investigated in this study with one-to-one coupling of crystals to photodetector channels. For direct incidence, the three algorithms have similar mean positioning error. However, as the angle of incidence increases, the 2nd max crystal positioning algorithm systematically performs better, while the Anger and 1st max crystal behave similarly (1st max crystal is slightly worse than Anger).
Figure 4.
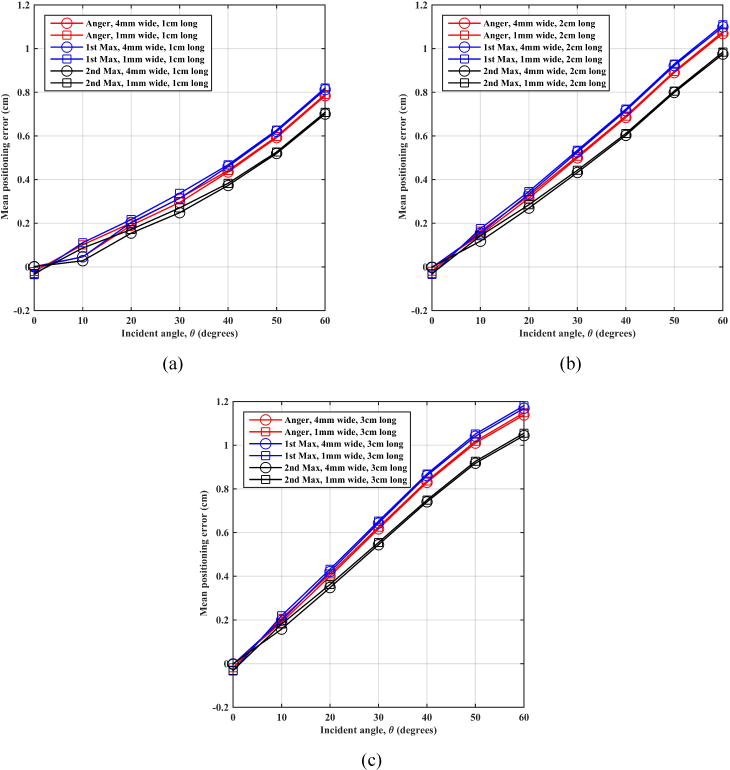
Montecrystal results for mean positioning error as a function of annihilation photon incident angle (θ) on an LSO scintillation detector using (a) 1 cm, (b) 2 cm, and (c) 3 cm thick crystals.
Figure 5 shows the standard deviation of the mean positioning error (as shown in figure 4) as a function of entrance angle of the annihilation photons. Standard deviation of the mean positioning error (detector spatial resolution) is lower for the shorter crystal for less oblique entrance angles and also for smaller crystals. As a function of positioning algorithm, the Anger and 2nd max crystal positioning algorithms have similar standard deviation values that are also lower than those for 1st max crystal positioning algorithm, especially at less oblique (lower) angles of incidence.
Figure 5.
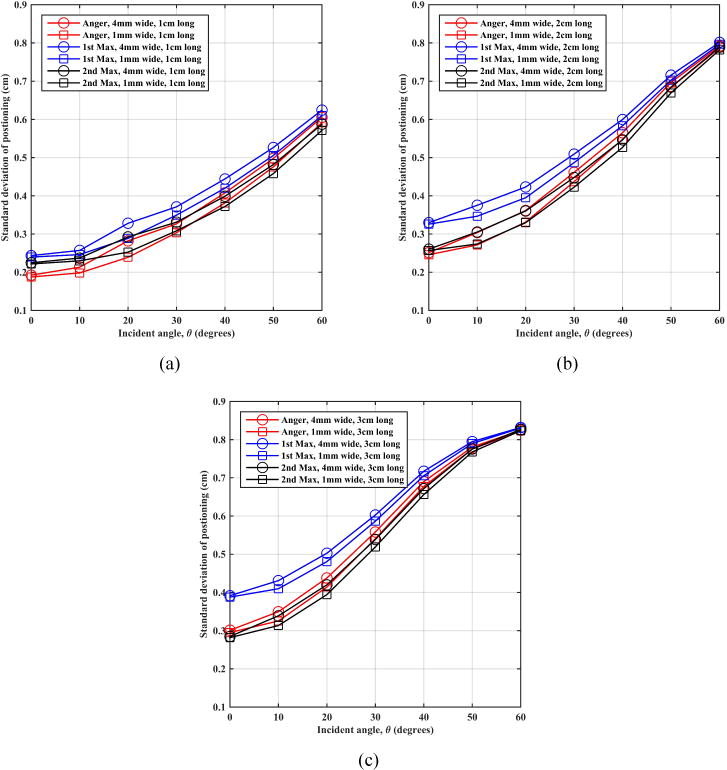
Montecrystal results for standard deviation of estimated position as a function of annihilation photon incident angle on an LSO scintillation detector using (a) 1 cm, (b) 2 cm, and (c) 3 cm thick crystals.
Figure 6 shows the root mean squared error (RMSE) in positioning as a function of entrance angle of the annihilation photons, which include the effects of the positioning error and its standard deviation (figures 4 and 5). The 2nd max crystal positioning algorithm is systematically better than the 1st max crystal positioning algorithm over all angles with a general gain of better than 1 mm (except for the smallest angle of incidence in the 1 cm long crystals). Anger positioning behaves as well as the 2nd max crystal positioning algorithm at small angles of incidence but its performance degrades for more oblique incidence angles.
Figure 6.
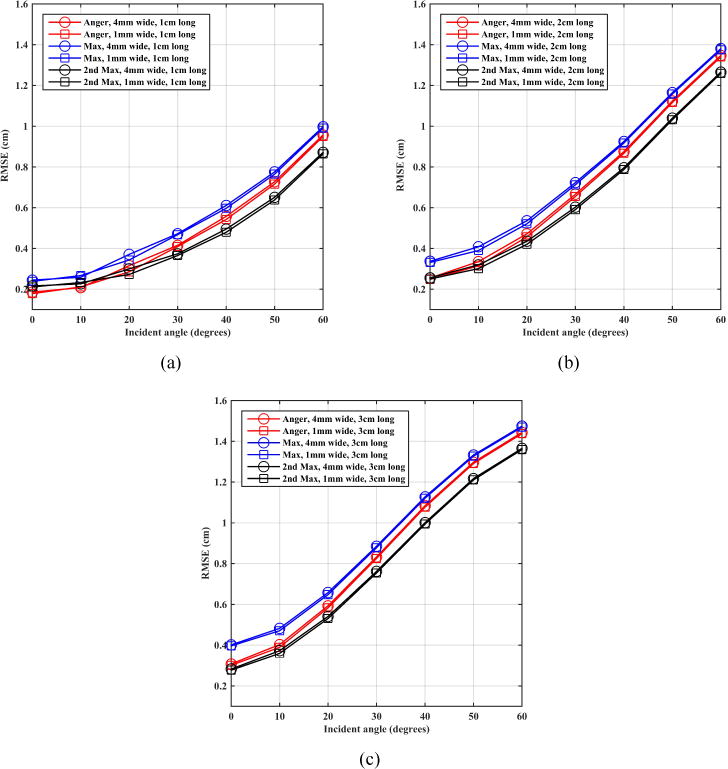
Montecrystal results for RMSE of estimated position as a function of annihilation photon incident angle on an LSO scintillation detector using (a) 1 cm, (b) 2 cm, and (c) 3 cm thick crystals.
Figure 7 shows the crystal mis-identification factor, MIF, (defined as the fraction of events that are not positioned in the entrance crystal) as a function of angle of incidence. Once again shorter crystals and 2nd max crystal positioning algorithm lead to better performance (lower MIF). In addition, for same crystal length MIF approaches the maximum value of 1 much faster for the smaller 1 mm wide crystals relative to the 4 mm wide. Since Compton scatter effect is independent of the crystal size, this difference in MIF is due to the smaller cross-section of 1 mm wide crystals leading to a larger error in positioning events in the incident crystal.
Figure 7.
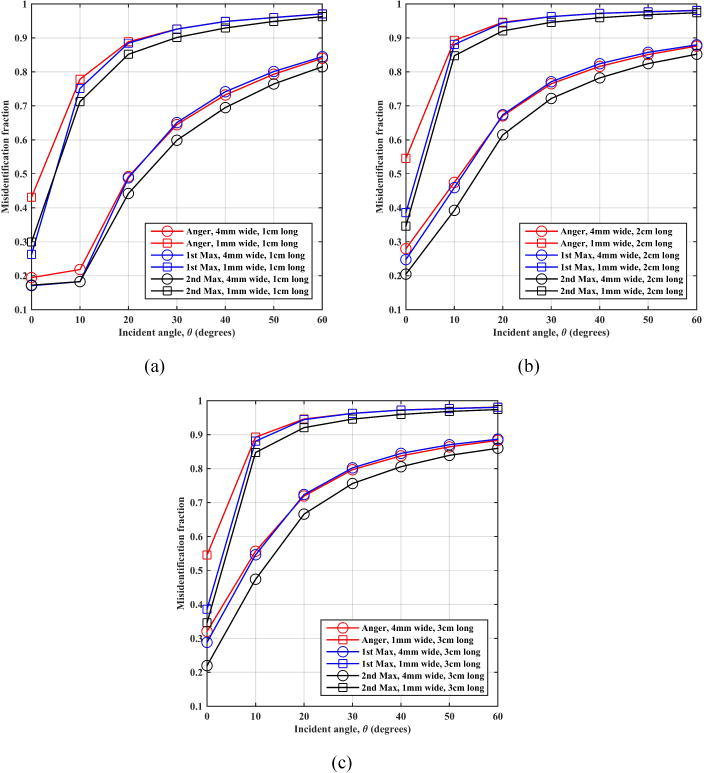
Montecrystal results for crystal mis-identification fraction (MIF) as a function of annihilation photon incident angle on an LSO scintillation detector using (a) 1 cm, (b) 2 cm, and (c) 3 cm thick crystals.
3.2. Reconstructed system spatial resolution
In figure 8 we plot reconstructed transverse and axial spatial resolution (EW) as functions of source radial position. These results show that the 2nd max crystal positioning algorithm consistently performs better than the other two algorithm at all source positions, while the Anger algorithm is slightly better than the 1st max crystal positioning algorithm. As mentioned earlier, the EW metric for spatial resolution better captures the effect of non-Gaussian tails in the spatial profiles and is a reason why the change in spatial resolution as a function of radial position looks more severe.
Figure 8.
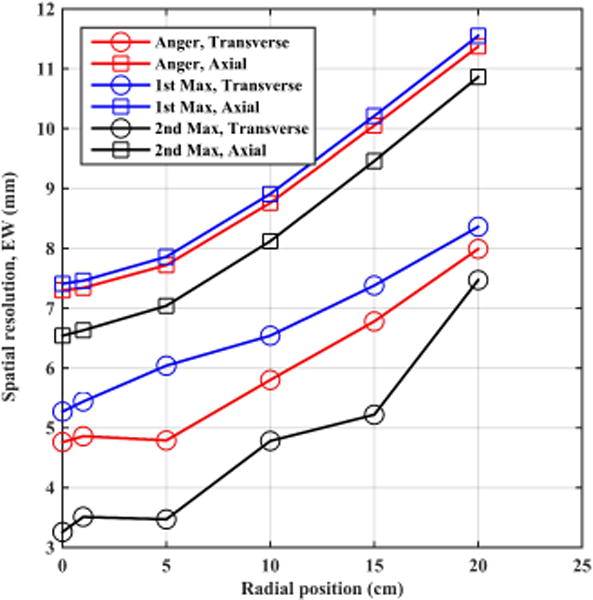
Reconstructed spatial resolution (EW) of a point source in air plotted as a function of radial position for a 70 cm long whole-body scanner using 4×4×20mm3 LSO crystals. Results are from an EGS4-based simulation.
3.3. Contrast recovery in lesion phantom
Figure 9 shows the mean CRC values as a function of iteration number for 1 cm diameter spheres: eight at radial position of 7 cm and another eight at radial position of 13 cm. As a reminder these phantom simulations are based on detectors with 4×4×20-mm3 crystals. Figure 10 shows the same plot but now for the 0.5 cm diameter spheres. While the standard deviation in CRC for the 0.5 cm spheres is higher with the 1st max and 2nd max crystal positioning algorithms relative to Anger positioning (larger error bars), these figures show a systematic gain in CRC values with 2nd max crystal positioning algorithm for both sphere sizes. Table 1 summarizes the CRC values at iteration 10 (at or close to convergence). Figure 11 shows the central transverse planes of the reconstructed images showing visually higher lesion uptake in images from the 2nd max crystal positioning algorithm for both sphere sizes.
Figure 9.
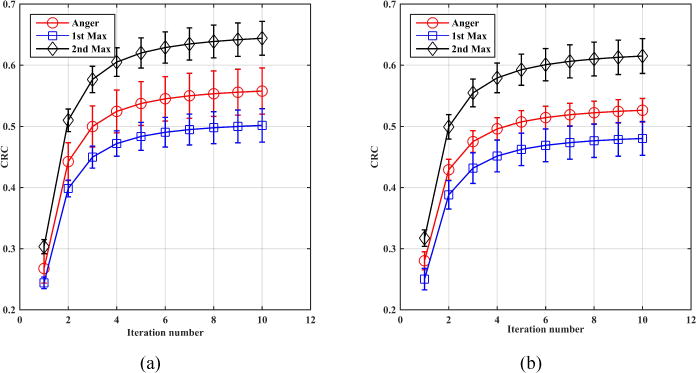
Contrast recovery coefficient (CRC) for 1 cm diameter spheres as a function of iteration number for spheres at radial position of (a) 7cm and (b) 13 cm. The sphere uptake was 3:1 relative to a background that was a 35 cm diameter by 70 cm long cylinder. Each CRC value is an average over 8 equivalent spheres, while the error bar is the ± standard deviation value calculated over the 8 sphere CRC values. Results are from an EGS4-based simulation.
Figure 10.
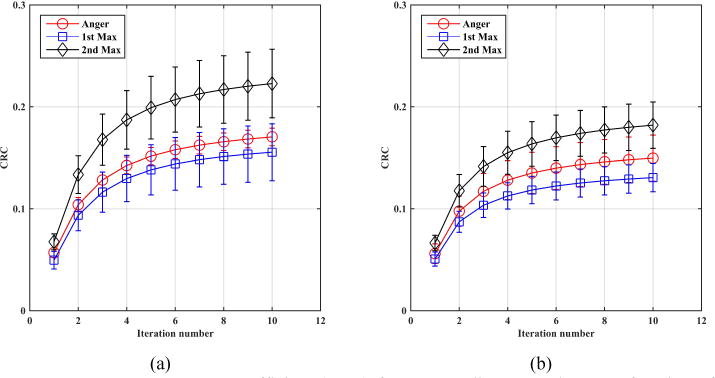
Contrast recovery coefficient (CRC) for 0.5 cm diameter spheres as function of iteration number for spheres at radial position of (A) 7cm and (B) 13 cm. The sphere uptake was 6:1 relative to a background that was a 35 cm diameter by 70 cm long cylinder. Each CRC value is an average over 8 equivalent spheres, while the error bar is the ± standard deviation value calculated over the 8 sphere CRC values. Results are from an EGS4-based simulation.
Table 1.
Summary of mean CRC values for 5 and 10 mm lesions at radial positions of 7 and 13 cm in the lesion phantoms.
| Sphere diameter (mm) | Radial position (cm) | Anger positioning | 1st max crystal positioning | 2nd max crystal positioning |
|---|---|---|---|---|
| 10 | 7 | 0.56 | 0.50 | 0.64 |
| 10 | 13 | 0.53 | 0.48 | 0.62 |
| 5 | 7 | 0.17 | 0.16 | 0.22 |
| 5 | 13 | 0.15 | 0.13 | 0.18 |
Figure 11.
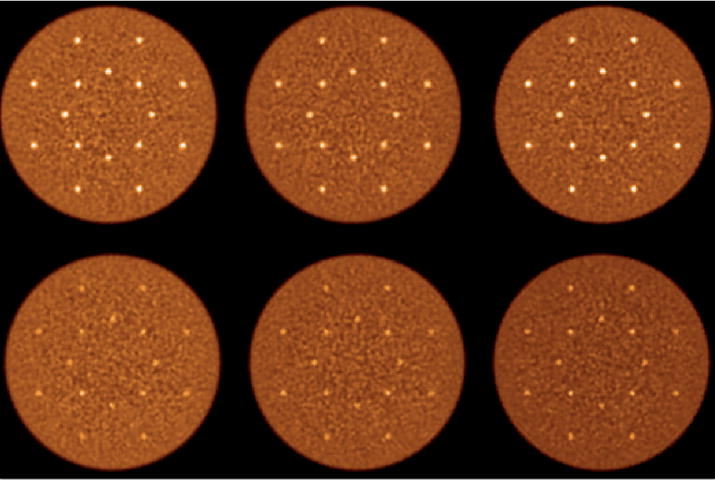
Reconstructed images of the central transverse slices for the simulated lesion phantoms with 1 cm (top row) and 0.5 cm (bottom row) diameter lesions. Moving left to right in each row are images from Anger, 1st max crystal, and 2nd max crystal positioning algorithms. The water-filled cylinder was 35 cm diameter by 70 cm long and sphere uptake was 3:1 with respect to background. The distribution of 16 spheres in each phantom was at radial distances of 7 and 13 cm. Results are from an EGS4-based simulation and images are shown for iteration number 10 of the fully 3D list-mode TOF OSEM reconstruction algorithm. All images are shown on a common color scale.
4. Discussion and conclusion
Starting with detector simulations and following through with full system simulations we show that the 2nd max positioning algorithm systematically improves spatial resolution and lesion uptake measurement relative to the Anger positioning and 1st max crystal positioning algorithms. It should be noted that these results are generally a function of the photoelectric and Compton interaction cross-section of the crystal used. While our work focused on LSO, but the results will also hold for other similar lutetium-based scintillators that are typically used in PET scanners (for example, LYSO and LGSO that have similar density and effective atomic number as LSO). The 1st max crystal and 2nd max crystal positioning algorithms require a one-to-one crystal to photodetector coupling, a detector design that is now practical in PET with the advent of SiPMs and as implemented in the Philips Vereos scanner (Miller et al., 2015).
The magnitude of the mean detector positioning error indicates the bias that will be present in positioning an interacting annihilation photon relative to its entrance point at the face of the detector. This bias is zero for all positioning algorithms for normal incidence but as expected it increases as a function of angle of incidence (figure 4). However, the effect is lower for the 2nd max crystal positioning algorithm. The standard deviation of the measured position also increases as function of incidence angle (figure 5). Since both these metrics will have an impact on reconstructed resolution, we utilize the RMSE as an overall measure of positioning error in the detector. The RMSE metric shows a systematic improvement in spatial resolution with the 2nd max crystal positioning algorithm at all angles (figure 6) that is also consistent with the reconstructed spatial resolution (figure 8). As a consequence gains in CRC are observed as shown in figures 9 and 10).
The CRC numbers summarized in Table 1 indicate a 30-40% gain in CRC values when using the 2nd max crystal positioning algorithm over the 1st max crystal positioning algorithm. The improvement is particularly noticeable for the smaller 0.5-cm diameter spheres, as shown in Fig 11. The standard deviation of the CRC values however increases with the 1st max and 2nd max crystal positioning algorithms that may have an impact on lesion detectability, an area that we plan to study in the future. These results were derived for a 70 cm long scanner but the CRC improvement will be applicable to any scanner utilizing a one-to-one coupling detector design. In particular, the Philips Vereos (Miller et al., 2015) and the PennPET XL scanner under development both utilize this detector design. Our next step will be to implement and test this algorithm experimentally.
Detectors based on the one-to-one coupling design currently utilize the 1st max crystal positioning algorithm, which, as shown in our work may underperform even compared to Anger positioning. However, please note that as implemented in our work the Anger positioning algorithm is applied to a one-to-one coupled detector without any scintillation light cross-talk. Hence, our conclusions for the Anger positioning algorithm may not directly apply to the light sharing detector designs that utilize PMTs or even SiPMs. We also note that light trapping in the crystals was not considered in this work. In practice this may impact the absolute magnitude of collected light from each crystal, and hence an accurate discrimination of the 1st max or 2nd max crystal. However, we do not expect this effect to change the rank ordering of the positioning algorithm.
Past work by other researchers (Shao et al., 1996, Comanor et al., 1996, Miyaoka and Lewellen, 2000) utilized the MIF metric to measure the advantages of different positioning algorithms. Shao, et al, (Shao et al., 1996) showed that for a fixed crystal size (2×2×10 mm3 LSO and BGO) the weighted centroid positioning algorithm performed the worst, but the MIF was no more than 5% relative to the other positioning schemes - crystal with highest energy deposition, crystal with minimum DOI, and crystal with maximum DOI. Comanor, et al (Comanor et al., 1996) showed that when using 3×3×20 mm3 BGO crystals, algorithms that attempt to correctly estimate the FIP reduce the MIF from 22% for crystal with highest energy deposition to 12% for crystal with second highest energy deposition. Miyaoka, et al, (Miyaoka and Lewellen, 2000) concluded that when using 2×2×20 mm3 LSO crystals in a DOI detector, the MIF is lower when the FIP is defined either as the crystal where highest or second highest energy gets deposited relative to traditional weighted centroid method without DOI measurement. Our MIF results are consistent with this past work, though the results differ due to differences in either crystal type, energy threshold, and the use of DOI information. However, since MIF measures only the percentage of events that are not positioned within the entrance crystal, it likely does not capture any differences present in a complete point spread function (such as the tails).
The past work also focused on smaller crystal cross-sections (< 4×4 mm2) and primarily evaluated the impact on positioning at the detector level. The work presented here covers a range of crystal sizes (1 to 4 mm wide and 1 to 3 cm long) and performs full system simulations to investigate the imaging impact of positioning algorithm with 4×4×20mm3 crystals, which are typical of what is used in clinical whole-body scanners and similar to what we will use in the PennPET XL scanner geometry. Miyaoka, et al, (Miyaoka and Lewellen, 2000) performed full PET system simulations for a small animal scanner geometry and studied the impact on reconstructed spatial resolution as well as hot sphere CRC showing smaller (and similar) gains with the 1st max and 2nd max crystal positioning algorithms compared to the Anger algorithm (~10% absolute gain over spheres ranging from 0.2 to 1 cm in diameter). However, their work utilized DOI information for 1st max and 2nd max crystal positioning algorithms (not for the Anger) and the individual crystals has some light sharing and were not fully optically isolated.
As described earlier, the EGS4 simulations are based on a model that approximates the detector and scanner geometry of the PennPET scanner under development, but we believe the results characterize the impact of the positioning algorithm on image performance and are more general for systems with other geometry. For our EGS4-based system simulations the crystal pitch was modeled as 4.3 mm, with a 0.3 mm gap between adjacent crystals representing the reflector. Pixelated detectors used in whole-body PET have smaller gaps between crystals (~ 0.07 mm). The increased pitch in our simulations was necessary due to system modeling limitations in EGS4 where the scanner design is cylindrical as opposed to modular for commercial PET. Since modular designs will have gaps (about a crystal wide) between individual modules, a cylindrical scanner with larger crystal pitch will achieve sensitivity that is similar to a modular design with smaller crystal pitch but bigger gaps between modules. Nevertheless, our conclusions from this study about the relative improvement in resolution and CRC performance achieved with the 2nd maximum crystal algorithm will apply to scanners with smaller crystal pitch as well. While we didn’t show the results for the 2-mm and 3-mm wide crystals, the results were systematic and can be inferred from the results shown for 1-mm and 4-mm wide crystals. The results with smaller crystals might become more relevant in the design of high resolution scanners, e.g., for small animal or human brain imaging, using more advanced SiPM devices with smaller size to match the crystal pitch.
The reconstructed spatial resolution results as shown in figure 8 are consistent with our past evaluation of spatial resolution in long axial FOV scanners (Schmall et al., 2016). Our results here using the EW metric show a larger degradation when compared to the past FWHM results, indicating the impact of additional spatial resolution degradation at the FWTM level (Schmall et al., 2016). This finding suggests that resolution modeling in the reconstruction algorithm would be beneficial to mitigate the degradation in axial resolution, but it is important to first optimize the intrinsic spatial resolution of the detector.
5. Conclusion
In this paper three different positioning algorithms were evaluated for application in a one-to-one coupled (one crystal coupled to one photodetector) scintillation detector where individual LSO crystals are optically isolated from each other with not scintillation light cross-talk. Our results indicate that the 2nd max crystal positioning algorithm has the lowest rmse value for incidence angles ranging from 0-60°, while the Anger positioning algorithm performs slightly better than the 1st max crystal positioning algorithm. These results were valid over four different crystal cross-sections (1×1 mm2, 2×2 mm2, 3×3 mm2, and 4×4 mm2) and three different crystal thickness (1 cm, 2cm, and 3 cm). Full system simulations with 4×4×20mm3 LSO crystals show consistent gains in the reconstructed spatial resolution with the 2nd max crystal positioning algorithm and overall gain in small lesion CRC values. Our results indicate that there may be an advantage in applying the 2nd max crystal positioning algorithm in a new generation of PET scanners, and we are encouraged to test this approach with the PennPET Explorer scanner.
Acknowledgments
This work was supported by the National Institutes of Health grant numbers R01-CA196528 and R01-CA113941, and a research agreement with Philips Healthcare.
References
- NEMA Standards Publication NU 2. Performance Measurements of Positron Emission Tomographs. Washington, DC: National Electrical Manufacturers Association; 2001. [Google Scholar]
- CASEY ME, NUTT R. A multicrystal two dimensional BGO detector system for positron emission tomography. IEEE Trans Nucl Sci. 1986;33:460–463. [Google Scholar]
- CHO ZH, JUH SC. Resolution and sensitivity improvement in positron emission tomography by the first interaction point determination; IEEE Nuclear Science Symposium and Medical Imaging Conference; Santa Fe, NM. 1991. pp. 1623–1627. [Google Scholar]
- COMANOR KA, VIRADOR PRG, MOSES WW. Algorithms to identify detector Compton scatter in PET modules. IEEE Trans Nucl Sci. 1996;43:2213–2218. [Google Scholar]
- DEGENHARDT C, PRESCHER G, FRACH T, THON A, DE GRUYTER R, SCHMITZ A, BALLIZANY R. The digital Silicon Photomultiplier; A novel sensor for the detection of scintillation light; IEEE Nuclear Science Symposium and Medical Imaging Conference; Orlando, FL. 2009. pp. 2383–2386. [Google Scholar]
- DU J, YANG Y, BAI X, JUDENHOFER MS, BERG ES, DI K, BUCKLEY S, JACKSON C, CHERRY SR. Characterization of Large-Area SiPM Array for PET Applications. IEEE Trans Nucl Sci. 2016;63:8–16. doi: 10.1109/TNS.2015.2499726. [DOI] [PMC free article] [PubMed] [Google Scholar]
- FRACH T, PRESCHER G, DEGENHARDT C, DE GRUYTER R, SCHMITZ A, BALLIZANY R. The digital silicon photomultiplier: Principle of operation and intrinsic detector performance; IEEE Nuclear Science Symposium and Medical Imaging Conference; Orlando, FL. 2009. pp. 1959–1965. [Google Scholar]
- GARIOD R, ALLEMAND R, CORMORECHE E, LAVAL M, MOSZYNSKI M. Proceedings of IEEE Workshop on Time-of-Flight Emission Tomography. Washington University; St. Louis, MO: 1982. The “LETI” positron tomograph architecture and time-of-flight improvements; pp. 25–29. [Google Scholar]
- KARP JS, GEAGAN M, MUEHHLEHNER G, WERNER ME, MCDERMOTT T, SCHMALL JP, VISWANATH V, PERKINS AE, TUNG C-H. The PennPET Explorer Scanner for Total Body Applications; IEEE Nuclear Science Symposium and Medical Imaging Conference; Oct 21–28, 2017; Atlanta, GA. 2017. [Google Scholar]
- KIM CL, GANIN A, MCDANIEL DL, MALANEY J, MCBROOM G, GUO J, ASHWIN W, IVAN A. Time-of-Flight PET-MR detector development based on silicon photomultiplier; IEEE Nuclear Science Symposium and Medical Imaging Conference; Anaheim, CA. 2012. pp. 3533–3536. [Google Scholar]
- KRISHNAMOORTHY S, LEGEYT B, WERNER ME, KAUL M, NEWCOMER FM, KARP JS, SURTI S. Design and performance of a high spatial-resolution, time-of-flight PET detector. IEEE Trans Nucl Sci. 2014;61:1092–1098. doi: 10.1109/tns.2014.2302580. [DOI] [PMC free article] [PubMed] [Google Scholar]
- MATEJ S, LEWITT RM. Practical considerations for 3-D image reconstruction using spherically symmetric volume elements. IEEE Trans Med Imag. 1996;15:68–78. doi: 10.1109/42.481442. [DOI] [PubMed] [Google Scholar]
- MATEJ S, LEWITT RM. Direct Fourier reconstruction with Fourier reprojection for fully 3-D PET. IEEE Trans Nucl Sci. 2001;48:1378–1385. [Google Scholar]
- MILLER M, ZHANG J, BINZEL K, GRIESMER J, LAURENCE T, NARAYANAN M, NATARAJAMANI D, WANG S, KNOPP M. Characterization of the Vereos Digital Photon Counting PET System. J Nucl Med. 2015;56:434P. [Google Scholar]
- MIYAOKA RS, LEWELLEN TK. Effect of detector scatter on the decoding accuracy of a DOT detector module. IEEE Trans Nucl Sci. 2000;47:1614–1619. [Google Scholar]
- POPESCU LM. Iterative image reconstruction using geometrically ordered subsets with list-mode data; IEEE Nuclear Science Symposium and Medical Imaging Conference; Rome, Italy. 2004. pp. 3536–3540. [Google Scholar]
- RAYLMAN RR, STOLIN A, MAJEWSKI S, PROFFITT J. A large area, silicon photomultiplier-based PET detector module. Nucl Instrum Meth A. 2014;735:602–609. doi: 10.1016/j.nima.2013.10.008. [DOI] [PMC free article] [PubMed] [Google Scholar]
- SCHMALL JP, KARP JS, WERNER ME, SURTI S. Parallax error in long-axial field-of-view PET scanners—a simulation study. Phys Med Biol. 2016;61:5443–5455. doi: 10.1088/0031-9155/61/14/5443. [DOI] [PMC free article] [PubMed] [Google Scholar]
- SHAO YP, CHERRY SR, SIEGEL S, SILVERMAN RW. Study of inter-crystal scatter in small scintillator arrays designed for high resolution PET imaging. IEEE Trans Nucl Sci. 1996;43:1938–1944. [Google Scholar]
- SON JW, KO GB, WON JY, YOON HS, LEE JS. Development and Performance Evaluation of a Time-of-Flight Positron Emission Tomography Detector Based on a High-Quantum-Efficiency Multi-Anode Photomultiplier Tube. IEEE Trans Nucl Sci. 2016;63:44–51. [Google Scholar]
- SURTI S, KARP JS, FREIFELDER R, LIU F. Optimizing the performance of a PET detector using discrete GSO crystals on a continuous lightguide. IEEE Trans Nucl Sci. 2000;47:1030–1036. [Google Scholar]
- SURTI S, KARP JS, MUEHLLEHNER G. Image quality assessment of LaBr3-based whole-body 3D PET scanners: a Monte Carlo evaluation. Phys Med Biol. 2004;49:4593–4610. doi: 10.1088/0031-9155/49/19/010. [DOI] [PubMed] [Google Scholar]
- TER-POGOSSIAN M, FICKE D, YAMAMOTO M, JT H. Super PETT I: A Positron Emission Tomograph utilizing photon time-of-flight information. IEEE Trans Med Imag. 1982;M1-1:179–187. doi: 10.1109/TMI.1982.4307570. [DOI] [PubMed] [Google Scholar]
- VISWANATH V, DAUBE-WITHERSPOON ME, SCHMALL JP, SURTI S, WERNER ME, MUEHLLEHNER G, GEAGAN MJ, PERKINS AE, KARP JS. Development of PET for Total-Body Imaging. Acta Physica Polonica B. 2017 in press. [Google Scholar]
- WERNER ME, SURTI S, KARP JS. Implementation and Evaluation of a 3D PET Single Scatter Simulation with TOF Modeling; IEEE Nuclear Science Symposium and Medical Imaging Conference; San Diego, CA. 2006. pp. 1768–1773. [Google Scholar]
- WONG WH, URIBE J, HICKS K, ZAMBELLI M. A 2-Dimensional Detector Decoding Study on BGO Arrays with Quadrant Sharing Photomultipliers. IEEE Trans Nucl Sci. 1994;41:1453–1457. [Google Scholar]


