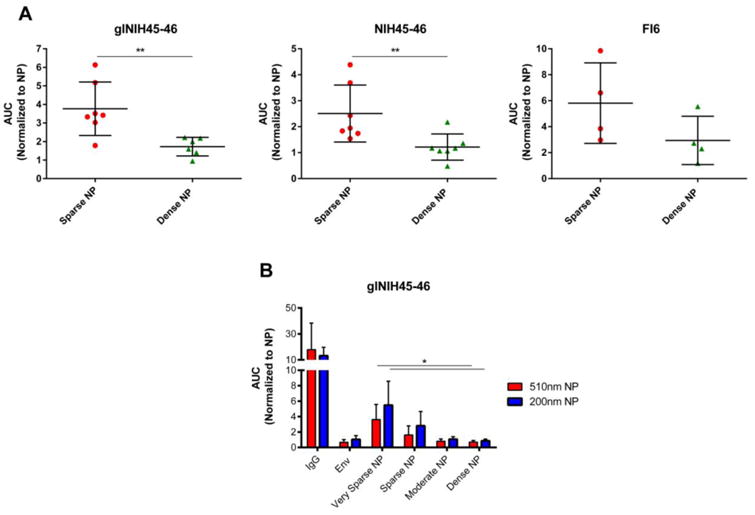
Figure 4.

Stimulation of antigen-specific B cell lines by NPs displaying HIV-1 Env. DG-75 cells were transfected with plasmids expressing the following B cell receptors: A) Left: a germline reverted derivative of the broadly neutralizing antibody NIH45-46 (low affinity). Center: the broadly neutralizing HIV-1 Env specific antibody NIH45-46 (high affinity). Right: a high affinity influenza specific antibody (FI6). Cells were loaded with Fura-red, a calcium reactive fluorescent dye, and then exposed to NPs (500 nm) displaying HIV-1 Env at high (dense) or low (sparse) density, or to NPs displaying influenza HA at the same densities. B) DG75 cells stably transduced to express the glNIH45-46 receptor were treated with NPs of 200nm or 500nm diameter decorated with various densities of HIV-1 Env (dense, moderate, sparse, very sparse; as defined in Figure 1). Data represents resulting mean calcium flux measurements, reported as Area Under the Curve (AUC), and normalized to results from cells exposed to NPs alone. Each data point represents an individual experiment with cells exposed to each of the treatments. The data is represented as the mean and standard deviation of all experimental observations. Significance was calculated using the Mann-Whitney analysis **p<0.01 (A) or the Kruskal-Wallis (ANOVA) analysis *p<0.05 (B).
