Abstract
Purpose
To explore the temperature-induced signal change in 2D multi-spectral imaging (2DMSI) for fast thermometry near metallic hardware, in order to enable MR-guided focused ultrasound surgery (MRgFUS) in patients with implanted metallic hardware.
Method
2DMSI was optimized for temperature sensitivity and applied to monitor FUS sonications near metallic hardware in phantoms and ex vivo porcine muscle tissue. Further, we evaluated its temperature sensitivity for in vivo muscle in patients without metallic hardware. In addition, we performed a comparison of temperature sensitivity between 2DMSI and conventional proton-resonance-frequency-shift (PRFS) thermometry at different distances from metal devices and different signal-to-noise ratios (SNR).
Results
2DMSI thermometry enabled visualization of short ultrasound sonications near metallic hardware. Calibration using in vivo muscle yielded a constant temperature sensitivity for temperatures below 43 °C. For an off-resonance coverage of +/−6 kHz, we achieved a temperature sensitivity of 1.45 %/K, resulting in a minimum detectable temperature change of about 2.5 K for an SNR of 100 with a temporal resolution of 6 s per frame.
Conclusion
The proposed 2DMSI thermometry has the potential to allow MR-guided FUS treatments of patients with metallic hardware and thus for a larger patient population.
Keywords: multi spectral imaging, thermometry, temperature, proton resonance frequency shift, distortion correction, metallic implants, metal artifacts, metal-induced distortions, susceptibility artifact, MR guidance, focused ultrasound
Introduction
MR thermometry [1, 2] enables safety and efficacy in thermal treatments such as hyperthermia or MR-guided focused ultrasound surgery (MRgFUS). Promising MRgFUS applications include tumor control in uterine fibroids, breast, prostate and bone cancer [3]. For the latter, MRgFUS has also been established as an effective approach for pain palliation in many of the most common sites of metastases for patients in whom standard treatments have failed [4]. In MRgFUS treatments, MR thermometry primarily fulfills two purposes: 1) visualization of the focal spot for alignment of the transducer to ensure targeted ablation, and 2), quantitative measurement of temperature change during treatment sonications, to both estimate thermal dose to predict treatment efficacy and evaluate for heating in surrounding tissues to allow for safe treatment.
Recently presented enhancements of conventionally used proton-resonance-frequency-shift (PRFS) thermometry have the potential to additionally provide noninvasive temperature measurement in the presence of moderate off-resonance of a few hundred Hertz [5–7]. However, there exists no technique for monitoring focused ultrasound sonications near larger metallic hardware such as hip arthroplasty, which typically induce off-resonance in the range of many kHz. Particularly for bone tumors, where metallic hardware is frequently used to stabilize the bone at the site of the cancer, an increasing patient population must be excluded from MRgFUS treatments.
MR thermometry near metallic hardware requires a way for fast, metal-artifact-reduced imaging that is also sensitive to temperature changes. Previous work has shown that fast, two-dimensional multi-spectral imaging (2DMSI) with inversion recovery enables quantitative measurement of the T1 relaxation time even in the presence of high off-resonance, thus allowing detection of temperature changes near metallic hardware [8]. Because this technique achieves acquisition times in the range of one minute per frame, the temporal resolution is still too low for monitoring ultrasound sonications, which typically last between 20 - 40 s.
In this work, we propose a 2DMSI-based approach for fast MR thermometry near metallic hardware with a temporal resolution of a few seconds to enable monitoring of ultrasound sonications (“2DMSI thermometry”). The 2DMSI acquisition scheme was optimized for increased temporal temperature resolution. We demonstrate the feasibility of this approach for visualizing sonications in MRgFUS treatments and evaluate its temperature sensitivity. In vivo testing of MR thermometry near metallic hardware is limited, first, because implanting metallic hardware in an animal model is extremely challenging. Second, MRgFUS treatment of patients with metallic hardware is contra-indicated by the FDA-approved device label; without proven preclinical data available, off-label treatment of these patients with MRgFUS would introduce risk of treatment failure or adverse effects. We therefore apply a logical, sequential approach, demonstrating the feasibility of 2DMSI thermometry near metallic hardware in phantom and ex vivo tissue and evaluating the in vivo temperature sensitivity of the same technique in patients without metallic hardware. We also provide a comparison with PRFS thermometry to demonstrate the limits and potential pitfalls of this commonly used approach. Figure 1 illustrates the experiments performed. Although this work focuses on MRgFUS treatments, 2DMSI thermometry might be also beneficial for other applications such as temperature monitoring close to radiofrequency or cryoablation probes or evaluation of implant heating.
Figure 1.
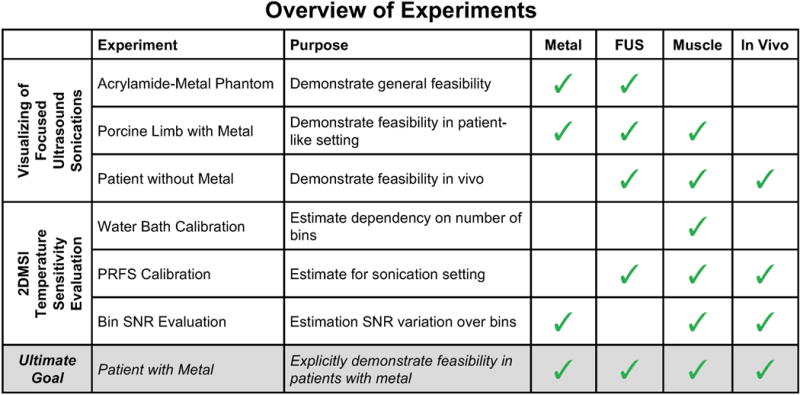
Overview of the experiments performed and their purpose. The matrix on the right shows whether the experiment was realized in the presence of metallic hardware (Metal), involved heating with focus ultrasound (FUS) and whether the material under investigation was muscle (Muscle) and in vivo (In Vivo). The ultimate goal of explicitly demonstrating the feasibility of 2DMSI thermometry in patients with metallic hardware would involve all four properties (bottom row). This manuscript describes a logical progression of experiments to demonstrate the feasibility of this goal to justify subsequent efficacy studies.
Methods
2DMSI Thermometry
2DMSI thermometry is based on the acquisition of a rapid series of artifact-reduced images with a temperature dependent signal intensity (Fig. 2). It utilizes the spin-echo-train-based 2DMSI technique [9], which enables artifact-reduced imaging by segmenting the slice to be imaged into spatial-spectral regions (“bins”) that can be imaged with minimal artifact (Fig. 2a). Individual bins are selected by inverting the amplitude of the slice selection gradient during excitation with respect to that of refocusing pulses, with the resulting bin profile defined by the overlap of the excitation and refocusing profiles (Fig. 2b). The bin is located within the desired undistorted slice and exhibits limited field inhomogeneity, reducing distortions of the readout gradient. For maximum speed, k-space is acquired using a single-shot readout with half-Fourier undersampling. For a given slice, adjacent bins are acquired by repeating the imaging process with adapted radiofrequency modulations. The composite 2DMSI image is formed by root-sum-of-squares combination of the individual bin images (Fig. 2c). The bin frequency spacing controls the gap between adjacent bin profiles. A single-shot 2DMSI image with non-overlapping bins is intrinsically T2 weighted, resulting in a low temperature sensitivity. However, rapid, repeated acquisition of a series of 2DMSI images and substantial overlapping of neighboring bin profiles introduces T1 weighting and thus increases temperature sensitivity (Fig. 2d). Temperature-induced signal change throughout the 2DMSI series is determined on a voxel-by-voxel basis with respect to the steady-state baseline image. Finally, the signal change is calibrated to a temperature change.
Figure 2.
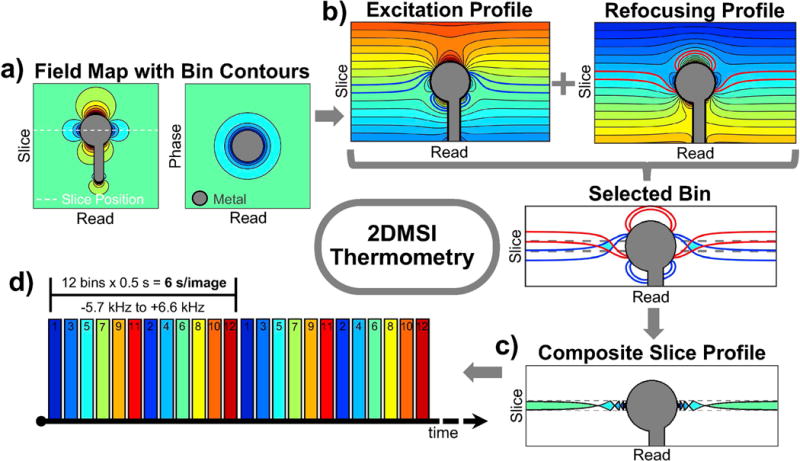
Illustration of 2DMSI thermometry: a) The slice to be imaged is segmented into spatial-spectral regions (“bins”). b) Each bin is selected individually by inversion of the slice gradient between excitation and refocusing pulses. Due to the limited off-resonance within the bin region, the bin can be imaged with minimal artifact. c) The combination of all bin profiles forms the profile of the composite 2DMSI image with the spacing of the bin profiles being controlled by the bin frequency spacing. d) Rapid acquisition of a series of 2DMSI images in combination with overlapping bin profiles results in a T1 weighting over the series which is temperature sensitive.
Data Acquisition
All experiments were performed on two 3T whole-body MRI systems from GE Healthcare, Waukesha, WI, equipped with a body focused-ultrasound system from InSightec, Tirat Carmel, Israel (phantom experiments: Discovery MR750 with ExAblate 2100, Fibroid Software V4.2; patient experiments: Discovery MR750w GEM with ExAblate 2100 with Bone Software V6.24). For both volunteer and patient experiments, informed consent was obtained. Both PRFS and 2DMSI thermometry experiments were performed from the ExAblate workstation. For the PRFS measurements, the body coil was used for both signal transmission and reception. For the 2DMSI measurements, signal was received using a 6-channel surface coil. Ultrasound sonications varied between 25 - 40 s with typical spot diameters of 5 mm and spot length of 17 mm (Spot Mode 0).
Single-slice 2DMSI images were acquired with a field-of-view of 280 × 280 mm, 5 mm slice thickness and a 256 × 128 matrix (70 phase encodes after half Fourier). The bin selection bandwidth was +/−0.65 kHz (full-width-half-maximum) and the bins were spaced by 0.9 kHz. The readout bandwidth was 970 Hz/pixel, with TE = 30 ms. Bins were acquired within 0.5 s, resulting in a duration of 6 s for a 12 bin 2DMSI frame covering −5.7 kHz to 6.6 kHz off-resonance. For PRFS thermometry, single-slice radio-frequency-spoiled gradient-recalled-echo images were acquired with matched field-of-view, slice thickness and matrix size but with fully sampled k-space and a duration of 3.4 s per frame (repetition time: 25 ms, echo time: 12.3 ms, flip angle: 30°, excitation bandwidth: 4.0 kHz, readout bandwidth: 44 Hz/pixel ms).
Processing of DICOM images was performed off-line in real-time in Matlab (MathWorks, Natick, MA). For PRFS thermometry, the phase change relative to the baseline image was determined on a voxel-by-voxel basis and converted to a temperature change [1]. For 2DMSI thermometry, the first frame of each series was rejected to ensure steady state and a series of magnitude difference images was calculated by subtracting the baseline image from each frame. SNR maps were derived from the 2DMSI image series according to the NEMA standard [10]. Signal was provided by the magnitude base line image. Noise was determined by calculating the standard deviation within a difference image while compensating for noise increase by due to the image subtraction. Off-resonance maps were determined from the individual 2DMSI bin images [11], and were converted into bin maps based on the nominal bin coverage and assuming no bin overlap.
Visualizing of Focused Ultrasound Sonications – Acrylamide-Metal Phantom
To demonstrate the general feasibility of 2DMSI thermometry for visualizing sonications near metallic hardware, we sonicated an acrylamide phantom (40 % acrylamide, 35 % egg white, 25 % H20) enclosing the titanium stem of a knee replacement for 25 s (1000 J). The cylindrical phantom had a diameter of 100 mm and a length of 190 mm and was immersed in a container with water. The focal spot was placed about 5 mm away from, and adjacent to the stem.
Visualizing of Focused Ultrasound Sonications – Porcine Limb with Metal
To evaluate the performance of 2DMSI thermometry near metallic hardware in a patient-like setting, we performed sonications in an excised rear limb of a 60 kg pig. As in a patient treatment, hair was removed from the skin and the limb was placed on the transducer table with a 2 cm gel pad between the transducer membrane and the limb. The titanium stem of a hip replacement was inserted in the muscle with orientation approximately parallel to the B0 field. We applied sonications of 30 s duration (4800 J) with the focal spots located between 40 mm and 5 mm from the implant surface. We first monitored each sonication with 2DMSI thermometry followed by repetition of the sonication with PRFS thermometry with about 10 min between sonications to allow for cooling.
Visualizing of Focused Ultrasound Sonications – Patient without Metal
To test the feasibility of 2DMSI thermometry for visualizing sonications in vivo, we monitored two 25 s (3378 J & 2918 J) sonications during a MRgFUS treatment of a 65-year old patient with metastases in the right pelvis without metallic hardware. The first sonication was aimed at a metastasis in the bone, the second on the periosteum. As in the limb experiment, we repeated each sonication with PRFS thermometry for comparison and to ensure treatment efficacy. Note that the 2DMSI image contrast and consequently the temperature sensitivity is bin-independent (and frequency independent), providing the basis to derive feasibility from an acquisition in the absence of metallic hardware.
2DMSI Temperature Sensitivity Evaluation – Water Bath Calibration
Both the 2DMSI off-resonance coverage and the acquisition time scale linearly with the number of acquired bins. Reducing the number of bins shortens the duration per frame and therefore is expected to increase the T1 weighting and hence the temperature sensitivity. To estimate the dependency of the temperature sensitivity on the number of bins, we acquired a short series of three 2DMSI frames with 12, 9 and 5 bins each in both a water and a porcine muscle sample at different temperatures. The corresponding duration per frame was 6 s, 4.5 s and 2.5 s, respectively and the off-resonance coverage −5.7 kHz – +6.6 kHz, −4.8 kHz – +4.8 kHz and −3.0 kHz – +3.0 kHz. To demonstrate the importance of the bin overlap, we also acquired 2DMSI with the on-resonance bin only but with the image repetition time matched to the frame duration of 2DMSI with 12 bins. Both samples were placed in a MR-compatible water bath and heated from 12 °C to 72 °C, followed by cooling to 12 °C over about 210 min. The slow heating and cooling ensured negligible temperature change during acquisition of each series. We monitored the temperature in each sample using a fiber optic temperature probe (STB Medical, LumaSense Technologies, Santa Clara, CA). For temperature sensitivity evaluation, we analyzed the 2DMSI signal of the last frame within a region-of-interest that included the tip of the temperature probe.
2DMSI Temperature Sensitivity Evaluation – PRFS Calibration
Changes in the tissue microstructure such as due to thermal coagulation are expected to cause non-linear and irreversible changes of the T1 temperature relationship [12, 13]. These changes are driven by the absorbed energy, which depends on both the exposed temperature and the duration of the exposure. To evaluate the 2DMSI temperature sensitivity for the specific conditions of a short ultrasound sonication, we performed a quantitative comparison with PRFS thermometry (“PRFS calibration”). For PRFS calibration, we first monitored a sonication with 2DMSI thermometry and then repeated the same sonication but with PRFS thermometry. For analysis, the PRFS time courses were interpolated at the 2DMSI acquisition times. 2DMSI temperature sensitivity was determined from the 2DMSI signal change over the PRFS temperature change on a voxel-by-voxel basis using linear fitting. For further evaluation, we also determined both the heat rate from the PRFS temperature change within the first three frames and the accumulated thermal dose in units of cumulative equivalent minutes at 43 °C (CEM43) [14] for each voxel. We performed PRFS calibration for four spots in an ex vivo porcine muscle, as well as for two spots in the muscle of a 14y old patient undergoing MRgFUS treatment of a benign tumor in the tibia, and for three spots in a 63y old patient undergoing MRgFUS treatment with metastases in the pelvis.
2DMSI Temperature Sensitivity Evaluation – Bin SNR Evaluation
The minimum temperature change detectable with 2DMSI thermometry (ΔTmin) depends on the temperature sensitivity of the 2DMSI signal, the available SNR and the minimum contrast-to-noise ratio (CNRmin) required to differentiate a temperature induced signal change from noise. To determine CNRmin, we simulated focal spots for different CNR values and analyzed their visibility. Based on the 2DMSI temperature sensitivity determined from the PRFS calibration, we simulated the resulting CNR for a range of temperature changes ΔT and SNR values according to
| [1] |
where m is the 2DMSI temperature sensitivity in %/K. The factor accounts for the fact that signal change is detected from the difference images exhibiting higher noise. Consequently, the minimum detectable temperature change ΔTmin is given by
| [2] |
The minimum detectable temperature change ΔTmin is equivalent to the temperature resolution of the 2DMSI thermometry. As depicted in Fig. 2c, the diamond-shaped bin profiles might cause a decrease in effective slice thickness and hence a reduction in SNR for increasing off resonance. To study the bin-shape dependency of ΔTmin, we acquired 2DMSI images with 12 bins in both a homogeneous phantom placed next to the cobalt-chromium head of a hip replacement and in a volunteer with a hip replacement. From the data, we calculated bin maps, SNR maps and ΔTmin.
Results
Visualization of Focused Ultrasound Sonications – Acrylamide-Metal Phantom
Figure 3 demonstrates monitoring of a 25 s ultrasound sonication in the acrylamide phantom next to the titanium knee stem. Figure 3a) shows the 2DMSI baseline image (top left) and the difference in signal intensity between the individual frames. The red cross marks the location of the focal spot at about 5 mm distant to the stem surface. Figure 3b) reveals the induced off-resonance exhibiting 2200 Hz at the focal spot and the coverage by the individual bins. The change in 2DMSI signal intensity in the voxel at the center of the focal spot and within a region-of-interest of 5 × 5 voxels is plotted in Fig. 3c. As both the difference images and the region-of-interest analysis reveal, 2DMSI signal intensity decreases during sonication and recovers afterward. As the difference images further demonstrate, the focal spot loses intensity, but continues to spread out after the sonication. Overall, 2DMSI visualizes the evolution of the focal spot with great detail.
Figure 3.
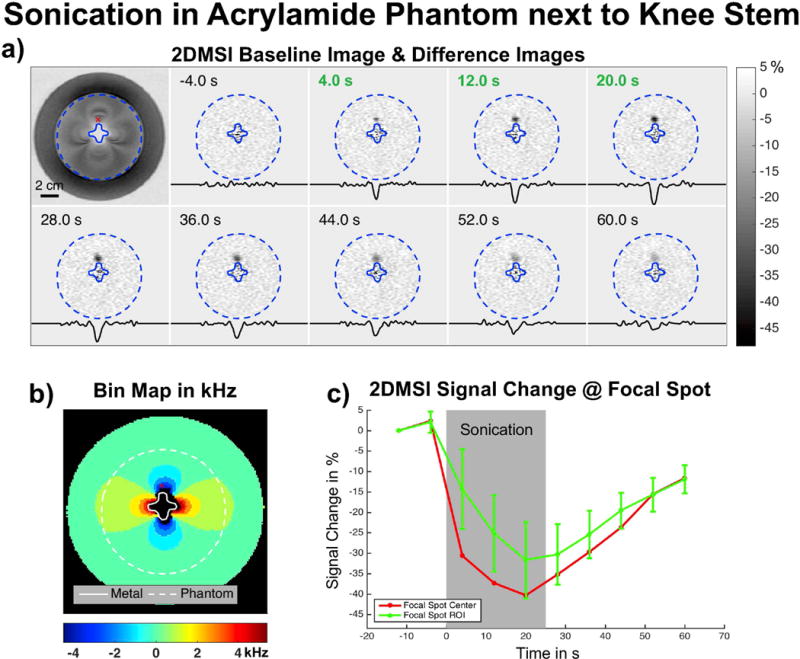
Demonstration of monitoring a 25 s ultrasound sonication in an acrylamide phantom next to a Titanium knee stem: a) 2DMSI magnitude baseline image (top left) and series of 2DMSI difference images, showing the temperature-induced signal change. The displayed time shows the acquisition time with respect to the start of the sonication and green font indicates frames acquired during the sonication. The profiles were taken horizontally through the focal spot. The SNR at the focal spot is about 50. b) The bin map shows the metal-induced off-resonance and the red cross marks the location of the focal spot about 5 mm distant to the stem surface and exhibiting an off-resonance of about 2200 Hz. c) 2DMSI signal change in the voxel at the center of the focal spot (red) and within a region-of-interest of 5 × 5 voxels (green).
Visualization of Focused Ultrasound Sonications – Porcine Limb with Metal
Supporting Figure S1 presents the results for visualizing ultrasound sonications located between 40 mm and 5 mm from the titanium hip stem in the ex vivo porcine limb with both 2DMSI thermometry and PRFS thermometry. Each map shows the 2DMSI signal change and PRFS temperature change, respectively at the end of the 30 s sonication. For the coronal maps (top), the imaging plane is oriented perpendicular to the ultrasound beam axis. For the axial maps (bottom), the imaging plane is aligned with the ultrasound beam axis. As the 2DMSI baseline images (bottom right) reveal, all focal spots were placed in muscle and there is fascia or surrounding fat tissue crossing in the axial plane. For each map, the title lists the resonance frequency at the center of the focal spot (see marker). The 2DMSI signal change map for the spots closest the implant (Spot 4 & 8) as well as the corresponding baseline images are also shown in Fig. 4.
Figure 4.
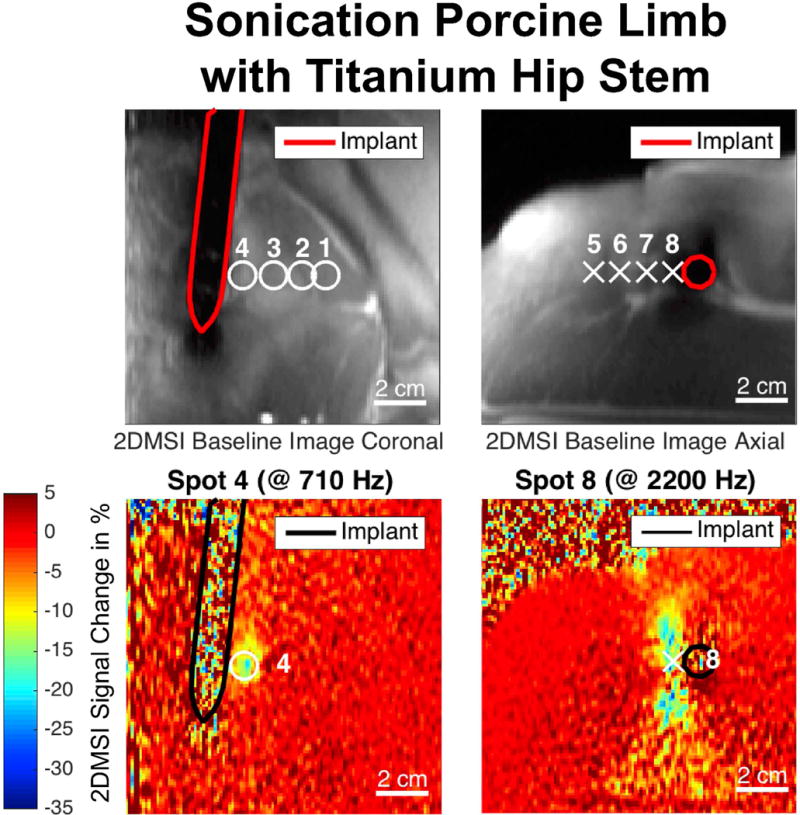
Excerpt from Supporting Figure S1, showing the 2DMSI signal change maps for the sonications in an ex vivo porcine limb closest to a Titanium hip stem. The black line marks the contour of the implant. Sonications were monitored in the coronal (left) and the axial plane (right) with the displayed frames acquired at the end of the sonication. The location of all acquired sonications are marked on the corresponding 2DMSI baseline images (top).
In the coronal maps, off-resonance increases with decreasing distance to the metallic implant from 280 Hz (Spot 1) to 710 Hz (Spot 4). The observed change in 2DMSI signal intensity (Fig. S1a) decreases with decreasing distance to the metallic implant from 18 % (Spot 1) to 14 % (Spot 4). However, the PRFS maps (Fig. S1b) only depict a temperature change for Spot 1, which exhibits the lowest off-resonance, with a temperature increase of about 13 K. Compared to the corresponding 2DMSI map, the focal spot is slightly shifted and distorted. For Spot 2, the PRFS map also shows a temperature increase but the main part of the focal spot falls into a signal void region, as evident from the high noise level. Signal void also covers the location of Spot 3. However, there is no signal void at the location of Spot 4 which is closest to the implant and exhibits the highest off-resonance and even not in the entire implant area, indicating strong geometric distortions in the PRFS map. Though, without knowing the implant location, the low noise would misleadingly suggest a high quality PRFS measurement, with no temperature change occurring.
The axial maps show a similar overall behavior, although the focal spots exhibit higher off-resonances, between 350 Hz (Spot 5) and 2200 Hz (Spot 8). Again, the induced change in 2DMSI signal intensity (Fig. S1c) decreases with decreasing distance to the implant from 33 % (Spot 5) to 22 % (Spot 10). The increased noise below the implant reflects the decreasing sensitivity of the surface coil. At the location of the surrounding fat tissue (see arrow in Spot 7 and baseline image) a different effect is happening, with the 2DMSI signal increasing instead of decreasing (see Discussion). For comparison, the PRFS maps (Fig. S1d) measure a temperature change only for a part of Spot 5, which exhibits the lowest off-resonance. As this experiment shows, 2DMSI enables visualization the focal spot near the metallic hardware also in a patient-like setting.
Visualization of Focused Ultrasound Sonications – Patient without Metal
Supporting Figure S2 presents the result for visualizing sonications in vivo in a patient without metallic hardware with both 2DMSI thermometry and PRFS thermometry. The gradient-recalled echo magnitude image reveals the location of the maps with respect to the body: the magenta line marks the outline of the right iliac bone in the pelvis in the axial plane, and red dashed lines indicate the boundaries of the ultrasound beam. The signal change and temperature change curves were measured at the location marked by the white cross. Spot 1 targets the metastases in the bone, while Spot 2 targets the periosteum on the outer surface of the bone. For both spots, the location of the heating indicated by the 2DMSI signal change visually matches that of the PRFS measurements. Within the metastases, the 2DMSI map and the signal change appears less noisy than for the PRFS measurement (see Discussion). The regions of increased instead of decreased 2DMSI signal match with the location of surrounding fat tissue, visible as high noise in the PRFS maps as fat suppression was applied for the patient PRFS acquisition. The results for Spot 1 are also shown in Fig. 5. As this experiment demonstrates, 2DMSI visualizes the focal spot also in in vivo muscle in a real patient setting.
Figure 5.
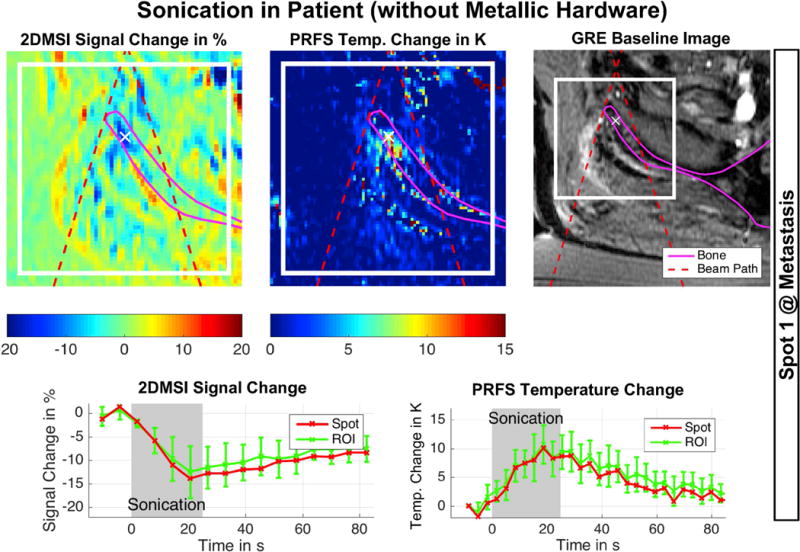
Excerpt from Supporting Figure S2, showing 2DMSI thermometry followed by PRFS thermometry for reference in a patient without metallic hardware undergoing MRgFUS treatment. The spot targets a metastasis in the pelvis. The red dashed lines mark the beam path, helping the operator to distinguish between temperature induced signal changes and artifacts. The white cross marks the location of the displayed signal curves ultimately used for evaluation of the sonication. SNR of 2DMSI is about 29.
2DMSI Temperature Sensitivity Evaluation – Water Bath Calibration
Supporting Figure S3 presents the results for the 2DMSI temperature sensitivity calibration in both water and ex vivo porcine muscle using the water bath. The localizer image (Fig. S3c) shows the sample containers and reveals the position of the temperature probes with respect to the imaging slice (marked by the red lines). The probe temperature over time is plotted in Fig. S3d. For the water sample (Fig. S3a), the 2DMSI signal intensity decreased approximately linearly with increasing temperature during heating and showed a reversible behavior during cooling. A shorter frame duration resulted in a stronger signal change, corresponding to a higher temperature sensitivity for 2DMSI with lower number of bins and thus lower off-resonance coverage. Conversely, acquiring only the on-resonant bin, but with the same image repetition time as for 2DMSI with 12 bins, resulted in a considerably lower sensitivity, likely due to reduced saturation from adjacent bins and thus reduced T1 sensitivity.
For the muscle sample (Fig. S3b), 2DMSI shows a comparable behavior during heating below a temperature of about 40 °C to 45 °C. However, above this threshold, nonlinear and irreversible effects occur with the temperature sensitivity substantially dropping and the signal following a different path during cooling. The drop in temperature sensitivity is less pronounced for the reference sequence with the on-resonant bin only. In addition to irreversible changes of the T1 temperature relationship, the different return path might also reflect a displacement of the temperature probe due to shrinking of the tissue during coagulation. Analyzing the temperature sensitivities determined from the linear signal range (Fig. S3e), reveals a 4 % and 14 % higher sensitivity when reducing the number of bins from 12 to 9 and 5, respectively. Accounting for the fact that shorter image repetition time on the one hand results in a lower SNR but on the other hand provides time to acquire more frames for averaging to increase SNR, the overall effect on ΔTmin is a decrease of 19 % for 9 bins and 30 % for 5 bins. The 2DMSI signal intensity curves for both water and muscle are also shown in Fig. 6. As this experiment reveals, the 2DMSI signal change is linear below a certain temperature threshold and the 2DMSI temperature sensitivity increases with decreasing off-resonance coverage.
Figure 6.
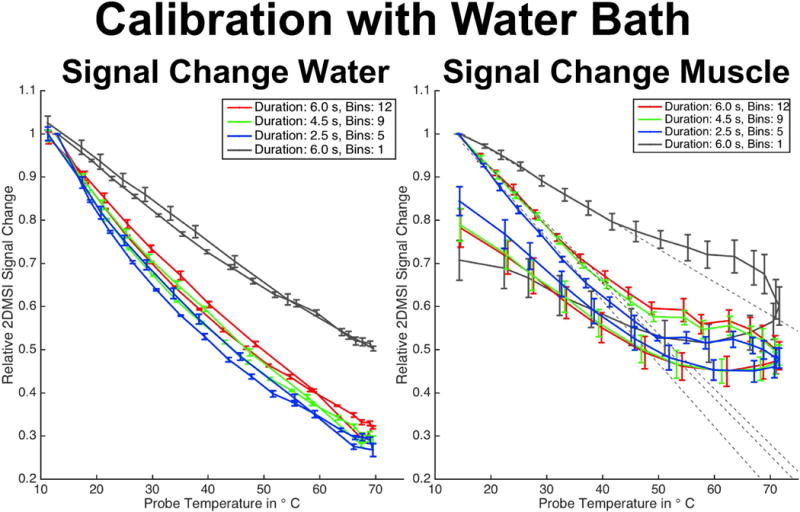
Excerpt from Supporting Figure S3, showing the 2DMSI signal change in water (left) and muscle (right) for 2DMSI with different number of bins during heating and cooling using a water bath.
2DMSI Temperature Sensitivity Evaluation – PRFS Calibration
Figures 7 - 9 present the results for the 2DMSI temperature sensitivity calibration using PRFS thermometry as a reference for both ex vivo porcine muscle and in vivo human muscle. As an example, the individual steps for a spot in the ex vivo muscle are shown in Fig. 7 and for a spot in the in vivo muscle in Fig. 8. Figure 9 summarizes the results for all analyzed spots. In Fig. 7 & 8, the first row shows both the 2DMSI maps and the PRFS maps acquired at the end of the sonication (a). The second row plots, for each voxel within the focal spot, the 2DMSI signal change and the PRFS temperature change, respectively (b). For better differentiation and comparison, the voxel courses are color-coded based on the heat rate determined from the PRFS measurement. The third row shows the 2DMSI signal change plotted over the corresponding PRFS temperature change for each voxel (c). Voxels that do not exceed the 1 CEM43 threshold are shown in the left plot, and voxels that do are shown on the right. The dotted gray line illustrates the average slope determined from the fitted slopes for voxels below the 1 CEM43 threshold. The black line describes the average signal course over all voxel courses shown.
Figure 7.
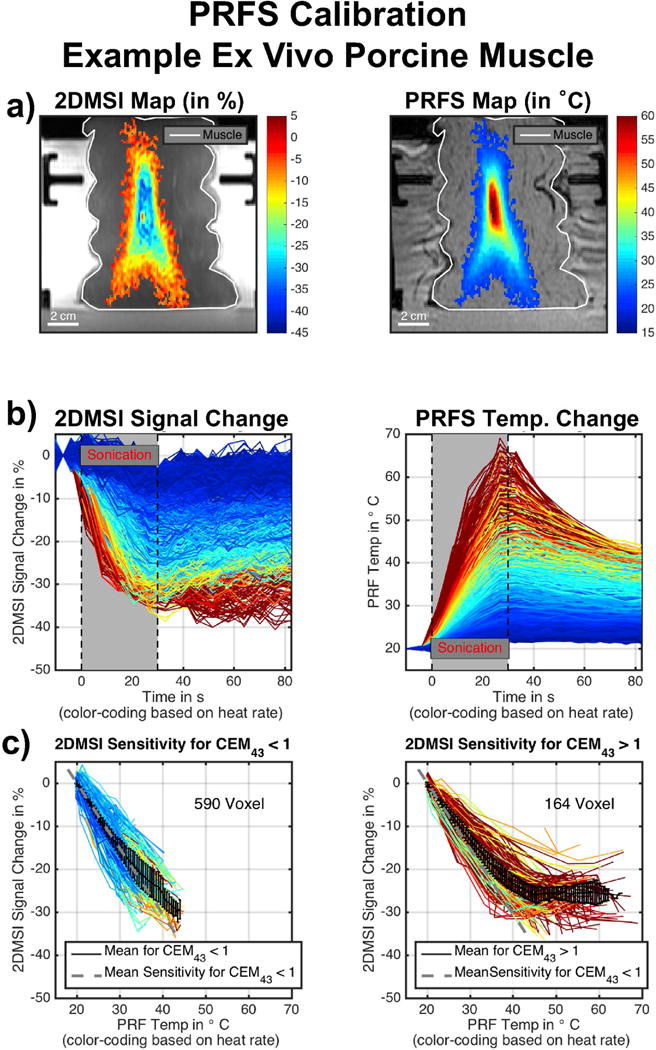
Example for PRFS calibration in ex vivo porcine muscle: a) 2DMSI signal change and PRFS temperature change at the end of the sonication. b) 2DMSI signal change and PRFS temperature change over time for each voxel within the focal spot. The color-coding is based on the heating rate, determined from the PRFS measurement. c) 2DMSI signal change over PRFS temperature change for voxel staying below (left) and exceeding (right) the 1 CEM43 threshold.
Figure 9.

Summary of the PRFS calibration, showing the average 2DMSI temperature sensitivity in % signal change per Kelvin for all analyzed spots and the average sensitivity over all spots for both ex vivo porcine muscle and in vivo human muscle. The variable N describes the number of voxel per spot.
Figure 8.
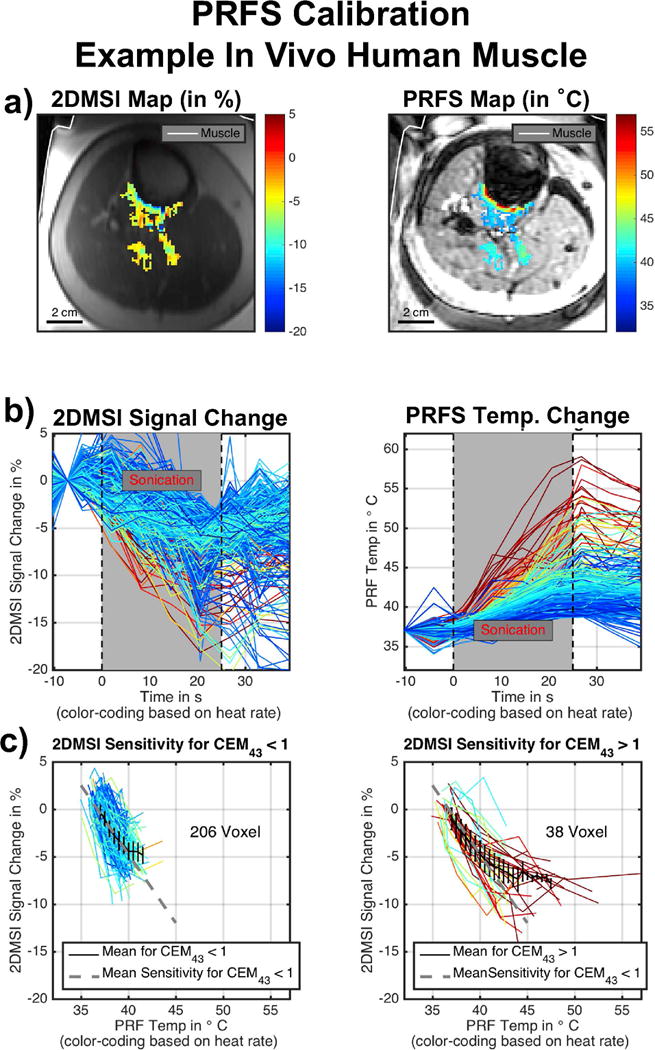
Example for PRFS calibration in in vivo human muscle: a) 2DMSI signal change and PRFS temperature change at the end of the sonication. b) 2DMSI signal change and PRFS temperature change over time for each voxel within the focal spot. The color-coding is based on the heating rate, determined from the PRFS measurement. c) 2DMSI signal change over PRFS temperature change for voxel staying below (left) and exceeding (right) the 1 CEM43 threshold.
Whereas the sonication in the ex vivo muscle enables heating of many voxels, and over a large temperature range (20 °C to about 65 °C), the nature of a patient bone treatment results in a considerably smaller number of muscle voxels heated, and over a narrower temperature range (37 °C to 55 °C). As the curves reveal, noise is also considerably higher for the sonication in the in vivo muscle. In ex vivo tissue, the 2DMSI signal intensity decreases during the sonication and recovers after the ultrasound ceases. Compared to the almost linear increase in PRFS temperature during sonication, the decrease in 2DMSI signal intensity slows down towards the end of the sonication for the voxels exhibiting higher heat rate. This is also visible in the maps acquired at the end of the sonication, with the 2DMSI map being flatter towards the focal spot center than the PRFS one. For the voxels exhibiting higher heat rate, the also the recovery curve after the sonication seems to differ from the PRFS recovery curve. In vivo, the voxel courses reveal an overall similar behavior, despite the lower quality of the data. For both ex vivo and in vivo muscle, the voxels below the 1 CEM43 threshold show a linear change in 2DMSI signal over PRFS temperature. For voxels exceeding the 1 CEM43 threshold, 2DMSI initially shows a linear change with temperature and then a deviation from linearity, corresponding to an almost complete drop in temperature sensitivity. The point of deflection is at about 43° C. This behavior is obvious for the ex vivo muscle, but is also supported by the in vivo results, despite the lower number of voxels, narrower temperature range and higher noise. Evaluation of the temperature sensitivity of all spots (Fig. 9) revealed an average value of about 1.45 %/K for both ex vivo and in vivo muscle. The fluctuation for the in vivo sonications is about 4 to 5 times higher than for the ex vivo sonications with the number of contributing voxels in vivo only about a quarter of the contributing voxels ex vivo. Overall, the PRFS calibration results in comparable 2DMSI temperature sensitivity values for ex vivo and in vivo muscle.
2DMSI Temperature Sensitivity Evaluation – Bin SNR Evaluation
Figure 10 presents the results for the estimation of the SNR-dependent 2DMSI temperature detection threshold. The maps on top (Fig. 10a) show simulated focal spots for CNR between 1 and 4 with the profile taken across the focal spot. The comparison reveals a minimum CNR of about 3 necessary to detect a signal change from noise within a frame. The plot below (Fig. 10b) shows the simulated CNR for a given temperature change ΔT and SNR, assuming a 2DMSI temperature sensitivity of 1.4 %/K. As the CNR isocontours demonstrate, higher SNR reduces the minimum detectable temperature change ΔTmin. For a typical body-coil SNR in the range of 20 to 35, this corresponds to minimum detectable temperature change ΔTmin in the range of 15 K to 9 K. Using a surface coil similar to that used in this study provides SNR values in the range of 40 to 100, achieving ΔTmin values between 7 K and 2.5 K.
Figure 10.
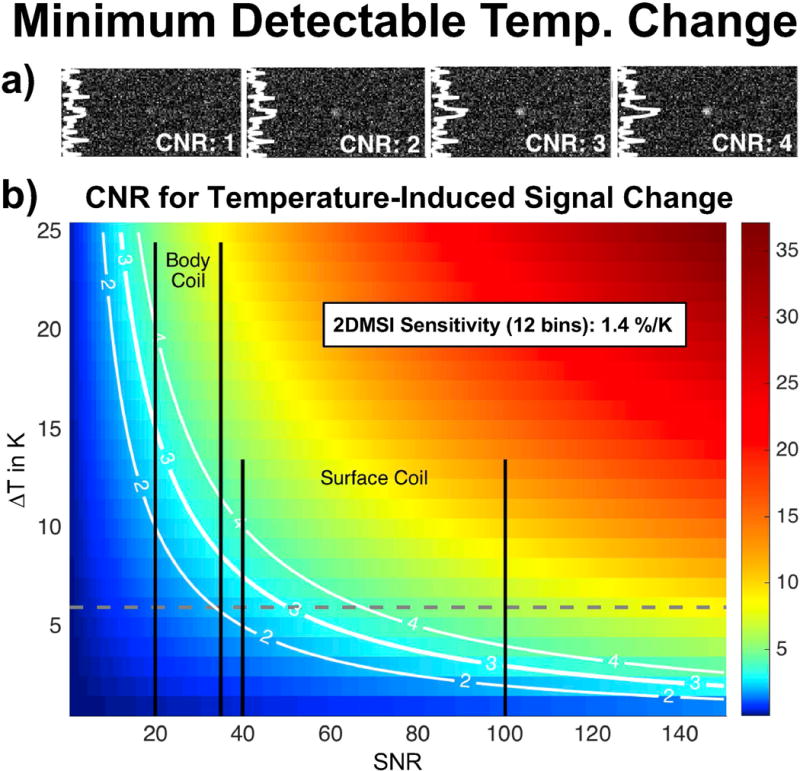
Contrast-to-noise ratio (CNR) evaluation for minimum detectable temperature change assessment: a) Simulated focal spots for varying CNR. b) CNR for 2DMSI with 12 bins in muscle for varying SNR and temperature change (ΔT). The gray dashed line marks the maximum signal-change-inducing temperature change in in vivo muscle due to the 2DMSI sensitivity drop at 43 °C. The black bars mark the SNR ranges achievable with the body coil and the surface coil used in this study.
Supporting Figure S4 presents the results for the analysis of the bin-dependent SNR variation in both a phantom (left) and in vivo (right). The top row (Fig. S4a) shows the bin map with the bin intersections highlighted. The middle row (Fig. S4b) shows the SNR map derived from the 2DMSI images with the bin intersections overlaid. The maps are normalized for better comparison of the SNR variation. The resulting variation in the normalized ΔTmin along the dotted line is plotted below (Fig. S4c). As the bin maps reveal, off-resonance increases towards the metal, with the bin area decreasing, due to increasing steepness of the off-resonance field. Within the homogeneous phantom, SNR globally decreases towards the edges of the phantom and locally at the bin intersections. The local variations at the bin intersections result in an ΔTmin increase of less than 25 %. Assuming the global variation along the read dimension to be symmetric and consequently considering the ΔTmin variation on the metal facing side relative to the one on the metal opposing side, reveals a global ΔTmin increase towards the metal which also does not exceed 25 %. Within the human subject, variations in SNR are dominated by tissue changes and no systematic SNR variation at the bin intersections or towards the metal could be identified. Whereas ΔTmin varies with SNR, the contribution of the bin-related SNR variation on ΔTmin is low.
Discussion
In this work, we have demonstrated the visualization of short ultrasound sonications near metallic hardware using 2DMSI thermometry. Further, we have evaluated the method’s temperature sensitivity for in vivo muscle and the dependency of the minimum detectable temperature change ΔTmin on the available SNR. The calibration revealed a constant temperature sensitivity for temperatures below 43 °C. For an off-resonance coverage of +/−6 kHz, we achieved a temperature sensitivity of 1.45 %/K, resulting in a minimum detectable temperature change ΔTmin of about 2.5 K with an SNR of 100. The experiments also revealed a failure of conventional PRFS above approximately 400 Hz off-resonance due to signal loss, including the potential risk of misinterpreting the PRFS maps due to geometric distortion.
Feasibility Near Metallic Hardware In Vivo
Although we have yet to explicitly demonstrate the feasibility of 2DMSI thermometry near metallic hardware in a patient, the experiments performed in this work allow us to estimate the performance in patients with good confidence, using PRFS thermometry as a reference. The ability of 2DMSI thermometry to detect temperature changes depends on both the temperature sensitivity of the 2DMSI series and the available SNR. The interleaved and continuous acquisition of bins ensures a bin-independent T1 weighting and thus an off-resonance-independent temperature sensitivity. This bin independence of the temperature sensitivity was also confirmed in a dedicated experiment (data not shown). The observed decrease in signal change in the limb experiment with decreasing distance to the implant does not correlate with the bin regions and we believe it reflects the increased absorption of the ultrasound by the metallic body. With a temperature sensitivity in the range of 1-2 %/K, the minimum detectable temperature change ΔTmin, and thus the applicability of 2DMSI thermometry, is highly SNR dependent.
As the simulation in Fig. 2c indicates, the bin profiles become increasingly diamond-shaped with increasing off-resonance. This reduces the effective slice thickness locally at the bin intersections but also globally towards the metal, and consequently increases ΔTmin. The phantom experiment suggests that the bin-shape-related ΔTmin increase does not exceed 25 %. Although the in vivo experiment showed a considerably higher increase in ΔTmin towards the metal, we believe that this effect is primarily attributed to the general variation in SNR throughout the body. In practice, the SNR variation due to variation in slice thickness is expected to play a minor to negligible role compared to sensitivity-related SNR variation of the receiver coils.
Temperature Sensitivity Variation with Off-Resonance Coverage
Both temperature sensitivity and temporal resolution of 2DMSI thermometry improve with decreasing off-resonance coverage. This gives the opportunity to optimize the settings for the given metallic hardware. The temperature-induced 2DMSI signal change in aqueous tissue is caused by the temperature sensitivity of both the proton density [15] and the T1 relaxation time [16], with the latter dominating. As the water bath experiment showed, reducing off-resonance coverage by reducing the number of acquired bins increases the frame repetition rate and thus the T1 weighting, resulting in an increased temperature sensitivity. The comparison with the single-bin curve also highlights the impact of the bin overlap on the temperature sensitivity. Whereas reducing the off-resonance coverage seemed to cause only a modest increase in temperature sensitivity, using the available time for averaging is expected to decrease ΔTmin considerably.
PRFS Calibration
Compared to the conventional water bath approach, the PRFS calibration enables studying the temperature sensitivity on the time scale of an ultrasound sonication and in vivo. However, the second sonication might face an altered ultrasound absorption (e. g. due to coagulation), thus biasing the calibration. In a reproducibility study (data not shown), we observed an about 4 % higher temperature increase with the second sonication for ex vivo muscle that exceeded a thermal dose of 1 CEM43 in the first sonication. In vivo, a physiological response to the first sonication such as increased perfusion might also bias the outcome of the second sonication. However, compared to the noise-induced uncertainties in 2DMSI thermometry, this potential bias seems negligible.
Quantitative 2DMSI Thermometry
In muscle, both calibration approaches revealed a linear decrease in 2DMSI signal with increasing temperature - corresponding to a constant temperature sensitivity – followed by a sudden drop in sensitivity. In addition to this nonlinear behavior, the water bath calibration also showed that these changes are irreversible. Note that the measured recovery of the 2DMSI signal change during cooling might be biased by displacement of the temperature probe due to shrinking of the tissue during coagulation. However, the comparison of T1 maps acquired before heating and after cooling (data not shown) confirmed irreversible T1 changes.
Despite the lower quality of the in vivo data, the PRFS calibration also suggests that the temperature behavior in vivo is qualitatively and quantitatively similar to the ex vivo case. The PRFS calibration also revealed that the 2DMSI sensitivity drops at a temperature as low as 43 °C and thus rather for >= 1 CEM43 than for >= 240 CEM43. Although nonlinear changes of the T1 temperature sensitivity are known [12, 13], we would have expected them to occur during coagulation and thus at a higher temperature. However, the findings are in accordance with previous attempts to measure T1 temperature behavior in muscle during hyperthermia [17].
The drop in temperature sensitivity above a certain threshold effectively limits the dynamic range of the 2DMSI thermometry approach, resulting in erroneously flattened temperature profiles above the threshold. For application in vivo, the temperature sensitivity drop limits the signal-change-inducing temperature range to 6 K (37 °C – 43 °C) and thus increases the SNR level required to visualize a sonication. For the estimated temperature sensitivity of 1.4 %/K for 12-bin 2DMSI and a minimum CNR of 3, this corresponds to a minimum SNR of about 45, usually exceeding the body coil SNR. In this study, we achieved SNR values of about 80 in the treatment area, resulting in a minimum detectable temperature change ΔTmin of about 3 K. Further, the ΔTmin analysis assumes noticing a temperature change in a single frame. However, analyzing the entire signal course (see e. g. Fig. 5) as is done in the clinical routine allows detection of temperature changes below the CNR = 3 threshold.
As previously reported [18], the T1 temperature behavior varies with tissue, resulting in a tissue-dependent temperature sensitivity for 2DMSI thermometry. Within this study, we have focused on the temperature sensitivity in muscle, as this is the tissue primarily used for temperature evaluation in MRgFUS treatments of bone metastases. Analysis of the 2DMSI signal change in the benign tumor indicated a lower but constant temperature sensitivity over the entire temperature range, although the low PRFS quality in the tumor limited the analysis. 2DMSI also showed a temperature-induced signal change in fatty tissues, with the 2DMSI signal increasing instead of decreasing with increasing temperature. As in fatty tissues the T2 increase with increasing temperature is no longer negligible [19], the 2DMSI temperature sensitivity seems to be primarily driven by T2. 2DMSI thermometry therefore has the potential to also detect temperature changes in fatty tissues.
Conclusion
We have demonstrated the feasibility of 2DMSI thermometry to monitor focused ultrasound sonications near metallic hardware. In muscle, 2DMSI thermometry enables quantitative measurement of temperature changes up to 43 °C. This is promising for the safety-relevant calibration of the transducer and to ensure that tissue outside the treatment area is not critically heated. Above this threshold, qualitative temperature measurements are still possible. Clinical feasibility is highly SNR dependent and challenging with the current receive coil technology for treatment areas towards the body center. 2DMSI thermometry is expected to greatly benefit from ultrasound-transparent receive coils or coil arrays that can be placed between transducer and patient for minimal distance to the treatment area. Overall, 2DMSI thermometry has the potential to allow MRgFUS treatment of patients with metallic hardware and thus expand its reach to a larger patient population.
Supplementary Material
Supporting Figure S1: Both 2DMSI signal change maps (a) & c)) and PRFS temperature change maps (b) & d)) for sonications in an ex vivo porcine limb with decreasing distance to a Titanium hip stem. The black line marks the contour of the implant. Sonications were monitored in the coronal (top) and the axial plane (bottom) with the displayed frames acquired at the end of the sonication. The location of the focal spots is also marked on the 2DMSI baseline images (bottom right).
Supporting Figure S2: 2DMSI thermometry followed by PRFS thermometry for reference in a patient without metallic hardware undergoing MRgFUS treatment. Spot 1 (top) targets a metastasis in the pelvis, Spot 2 (bottom) the periosteum. The red dashed lines mark the beam path, helping the operator to distinguish between temperature induced signal changes and artifacts. The white cross marks the location of the displayed signal curves ultimately used for evaluation of the sonication. SNR of 2DMSI is about 29 at Spot 1 and about 40 at Spot 2.
Supporting Figure S3: Evaluation of the 2DMSI temperature sensitivity using a water bath: a) 2DMSI signal change in water for 2DMSI with different number of bins for both heating and cooling. b) The same sequences achieve a different behavior in ex vivo porcine muscle. c) Setup with sample tubes and location of the imaging slice. d) Sample temperature throughout the experiment. e) Both relative temperature sensitivity and relative minimum detectable temperature change (ΔTmin) in muscle for different number of bins.
Supporting Figure S4: Evaluation of the SNR variation over bins in both a homogenous phantom next to a metal implant (left) and a volunteer with a hip replacement (right): a) Bin map with highlighted bin intersections, showing the decreasing bin area for increasing off-resonance. b) Normalized SNR map with the white lines marking the bin intersections. Whereas the SNR variation in vivo is dominated by tissue changes and in the phantom by B1 inhomogeneity, the phantom also reveals an SNR decrease at the bin intersections. c) Relative variation in minimum detectable temperature change (ΔTmin) along the red dashed line shown above, primarily driven by the B1 inhomogeneity (phantom) and tissue changes (human). The variation in ΔTmin at the bin intersections (marked by black bars) for the phantom suggest that the bin-induced increase in ΔTmin is below 25 %.
Acknowledgments
The authors like to acknowledge Russel Sanchez and Dr. Nick Giori from the Palo Alto VA as well as Stuart Goodman from Stanford Hospital for providing implant parts, Dr. Linsey Moyer for manufacturing the acrylamide phantom, Elias Godoy, Dr. Yamil Saenz and Dr. Donna Bouley from the Department of Comparative Medicine, Stanford University for providing animal tissues, Dr. Yeruham Shapira, Dr. Asaf Hertz and Dr. Itay Rachmilevitch from InSightec for help with the integration on the ExAblate system and Dr. Rachelle Bitton for support in running the ultrasound system. This work was supported by NIH (R01 EB017739, R21 EB019723, P01 CA159992) and GE Healthcare.
Grant: NIH (R01 EB017739, R21 EB019723, P01 CA159992), GE Healthcare
Abbreviation
- MRI
Magnetic Resonance Imaging
- MSI
Multi Spectral Imaging
- MRgFUS
MR-guided Focused UltraSound
- SNR
Signal-to-Noise Ratio
- CNR
Contrast to noise ratio
References
- 1.Ishihara Y, Calderon A, Watanabe H, Okamoto K, Suzuki Y, Kuroda K, Suzuki Y. A precise and fast temperature mapping using water proton chemical shift. Magn Reson Med. 1995;34:814–823. doi: 10.1002/mrm.1910340606. [DOI] [PubMed] [Google Scholar]
- 2.Rieke V, Pauly KB. MR thermometry. J Magn Reson Imaging. 2008;27:376–390. doi: 10.1002/jmri.21265. [DOI] [PMC free article] [PubMed] [Google Scholar]
- 3.Napoli A, Anzidei M, Ciolina F, Marotta E, Cavallo Marincola B, Brachetti G, Di Mare L, Cartocci G, Boni F, Noce V, Bertaccini L, Catalano C. MR-guided high-intensity focused ultrasound: Current status of an emerging technology. Cardiovasc Inter Rad. 2013;36:1190–1203. doi: 10.1007/s00270-013-0592-4. [DOI] [PubMed] [Google Scholar]
- 4.Hurwitz MD, Ghanouni P, Kanaev SV, Iozeffi D, Gianfelice D, Fennessy FM, Kuten A, Meyer JE, Leblang SD, Roberts A, Choi J, Larner JM, Napoli A, Turkevich VG, Inbar Y, Tempany CMC, Pfeffer RM. Magnetic resonance-guided focused ultrasound for patients with painful bone metastases: Phase III trial results. J Natl Cancer I. 2014;106:1–9. doi: 10.1093/jnci/dju082. [DOI] [PMC free article] [PubMed] [Google Scholar]
- 5.Zur Y. A new time shifted fast spin echo thermometry sequence. Proc Intl Soc Mag Reson Med. 23(2015):4054. [Google Scholar]
- 6.Poorman ME, Grissom WA. Orientation-independent z-shimmed temperature mapping near ablation probes. Proc Intl Soc Mag Reson Med. 25(2017):2586. [Google Scholar]
- 7.Zhang Y, Poorman ME, Grissom WA. Dual-echo Z-shimmed proton resonance frequency-shift magnetic resonance thermometry near metallic ablation probes: Technique and temperature precision. Magn Reson Med. 2017 doi: 10.1002/mrm.26634. [DOI] [PMC free article] [PubMed] [Google Scholar]
- 8.Weber H, Taviani V, Yoon D, Ghanouni P, Pauly KB, Hargreaves BA. MR thermometry near metallic devices using multispectral imaging. Magn Reson Med. 2017;77:1162–1169. doi: 10.1002/mrm.26203. [DOI] [PMC free article] [PubMed] [Google Scholar]
- 9.Hargreaves BA, Taviani V, Litwiller DV, Yoon D. 2D multi-spectral imaging for fast MRI near metal. Magn Reson Med. 2017 doi: 10.1002/mrm.26724. [DOI] [PMC free article] [PubMed] [Google Scholar]
- 10.NEMA Standards Publication. MS 1-2001 Determination of Signal-to-Noise Ratio (SNR) in Diagnostic Magnetic Resonance Imaging. 2001 [Google Scholar]
- 11.Koch KM, Brau AC, Chen W, Gold GE, Hargreaves BA, Koff M, McKinnon GC, Potter HG, King KF. Imaging near metal with a MAVRIC-SEMAC hybrid. Magn Reson Med. 2011;65:71–82. doi: 10.1002/mrm.22523. [DOI] [PubMed] [Google Scholar]
- 12.Lewa CJ, Majewska Z. Temperature relationships of proton spin-lattice relaxation time T1 in biological tissues. Bulletin du Cancer. 1980;67:525–530. [PubMed] [Google Scholar]
- 13.Graham SJ, Bronskill MJ, Henkelman RM. Time and temperature dependence of MR parameters during thermal coagulation of ex vivo rabbit muscle. Magn Reson Med. 1998;39:198–203. doi: 10.1002/mrm.1910390206. [DOI] [PubMed] [Google Scholar]
- 14.Sapareto SA, Dewey WC. Thermal dose determination in cancer therapy. Int J Radiat Oncol Biol Phys. 1984;10:787–800. doi: 10.1016/0360-3016(84)90379-1. [DOI] [PubMed] [Google Scholar]
- 15.Chen J, Daniel BL, Pauly KB. Investigation of proton density for measuring tissue temperature. J Magn Reson Imaging. 2006;23:430–434. doi: 10.1002/jmri.20516. [DOI] [PubMed] [Google Scholar]
- 16.Bottomley PA, Foster TH, Argersinger RE, Pfeifer LM. A review of normal tissue hydrogen NMR relaxation times and relaxation mechanisms from 1-100 MHz: dependence on tissue type, NMR frequency, temperature, species, excision, and age. Medical physics. 1984;11:425–448. doi: 10.1118/1.595535. [DOI] [PubMed] [Google Scholar]
- 17.Peller M, Kurze V, Loeffler R, Pahernik S, Dellian M, Goetz AE, Issels R, Reiser M. Hyperthermia induces T1 relaxation and blood flow changes in tumors. A MRI thermometry study in vivo. Magn Reson Imaging. 2003;21:545–551. doi: 10.1016/s0730-725x(03)00070-5. [DOI] [PubMed] [Google Scholar]
- 18.Nelson TR, Tung SM. Temperature dependence of proton relaxation times in vitro. Magn Reson Imaging. 1987;5:189–199. doi: 10.1016/0730-725x(87)90020-8. [DOI] [PubMed] [Google Scholar]
- 19.Baron P, Ries M, Deckers R, de Greef M, Tanttu J, Köhler M, Viergever MA, Moonen CTW, Bartels LW. In vivo T2-based MR thermometry in adipose tissue layers for high-intensity focused ultrasound near-field monitoring. Magn Reson Med. 2013;1064:1057–1064. doi: 10.1002/mrm.25025. [DOI] [PubMed] [Google Scholar]
Associated Data
This section collects any data citations, data availability statements, or supplementary materials included in this article.
Supplementary Materials
Supporting Figure S1: Both 2DMSI signal change maps (a) & c)) and PRFS temperature change maps (b) & d)) for sonications in an ex vivo porcine limb with decreasing distance to a Titanium hip stem. The black line marks the contour of the implant. Sonications were monitored in the coronal (top) and the axial plane (bottom) with the displayed frames acquired at the end of the sonication. The location of the focal spots is also marked on the 2DMSI baseline images (bottom right).
Supporting Figure S2: 2DMSI thermometry followed by PRFS thermometry for reference in a patient without metallic hardware undergoing MRgFUS treatment. Spot 1 (top) targets a metastasis in the pelvis, Spot 2 (bottom) the periosteum. The red dashed lines mark the beam path, helping the operator to distinguish between temperature induced signal changes and artifacts. The white cross marks the location of the displayed signal curves ultimately used for evaluation of the sonication. SNR of 2DMSI is about 29 at Spot 1 and about 40 at Spot 2.
Supporting Figure S3: Evaluation of the 2DMSI temperature sensitivity using a water bath: a) 2DMSI signal change in water for 2DMSI with different number of bins for both heating and cooling. b) The same sequences achieve a different behavior in ex vivo porcine muscle. c) Setup with sample tubes and location of the imaging slice. d) Sample temperature throughout the experiment. e) Both relative temperature sensitivity and relative minimum detectable temperature change (ΔTmin) in muscle for different number of bins.
Supporting Figure S4: Evaluation of the SNR variation over bins in both a homogenous phantom next to a metal implant (left) and a volunteer with a hip replacement (right): a) Bin map with highlighted bin intersections, showing the decreasing bin area for increasing off-resonance. b) Normalized SNR map with the white lines marking the bin intersections. Whereas the SNR variation in vivo is dominated by tissue changes and in the phantom by B1 inhomogeneity, the phantom also reveals an SNR decrease at the bin intersections. c) Relative variation in minimum detectable temperature change (ΔTmin) along the red dashed line shown above, primarily driven by the B1 inhomogeneity (phantom) and tissue changes (human). The variation in ΔTmin at the bin intersections (marked by black bars) for the phantom suggest that the bin-induced increase in ΔTmin is below 25 %.


