

Abstract
The aim of this research was to determine the effect of composition (dietary fiber = DF, fat = F, and gluten = G) and baking time on the target microstructural parameters that were observed using images of potato and wheat starch biscuits. Microstructures were studied Scanning Electron Microscope (SEM). Non-enzymatic browning (NEB) was assessed using color image analysis. Texture and moisture analysis was performed to have a better understanding of the baking process. Analysis of images revealed that the starch granules retained their native form at the end of baking, suggesting their in complete gelatinization. Granules size was similar at several different baking times, with an average equivalent diameter of 9 and 27 µm for wheat and potato starch, respectively. However, samples with different levels of DF and G increased circularity during baking to more than 30%, and also increasing hardness. NEB developed during baking, with the maximum increase observed between 13 and 19 min. This was reflected in decreased luminosity (L*) values due to a decrease in moisture levels. After 19 min, luminosity did not vary significantly. The ingredients that are used, as well as their quantities, can affect sample L* values. Therefore, choosing the correct ingredients and quantities can lead to different microstructures in the biscuits, with varying amounts of NEB products.
Electronic supplementary material
The online version of this article (10.1007/s13197-017-3008-7) contains supplementary material, which is available to authorized users.
Keywords: Cookies, Starch, Image analysis, Non-enzymatic browning
Introduction
In today’s fast-paced world, the intake of processed foods has outstripped the consumption of fresh fruit and vegetables. This is partly due to the need for nutritious, long-lasting, easy-to-carry and easy-to-store foods (Manley 2011). Among processed foods, starchy foods such as biscuits, cereals and snacks are experiencing increased levels of consumption. “Cookies” or “biscuits” are small starchy products that are baked using hot dry air to a moisture content of less than 5%. These products are mainly composed of wheat flour (a main source of starch and protein), fat and sugar (Dapčević et al. 2015). Wheat flour is the major ingredient in biscuits and functions as a structure builder in order to provide texture, shape and hardness (Chavan et al. 2016). The wheat flour forms a viscoelastic network to bind the ingredients that are distributed throughout the dough. The major proteins in wheat flour are gliadins and glutenins, which produce gluten. Some non-gluten flours are also used in the baking of biscuits, including rice, maize, barley and millet (Chavan et al. 2016).
Sugar is often the second major ingredient in biscuit production and is added to provide sensory characteristics such as flavor, appearance, color and texture, as well as to increase the product’s shelf life (Aggarwal et al. 2016; Chavan et al. 2016). Sugar also allows air to enter the fat during the preparation of the dough, decreasing the viscosity of the dough and affecting the structure, texture and volume of the final product (Mieszkowska and Marzec 2016).
The fat that is used to make biscuits is typically added in solid or semi-solid form, predominantly as hydrogenated or saturated fat. Such fats often account for up to 20% of the dough. As a result, biscuits have a high content of saturated fatty acids (Dapčević et al. 2015). The function of fat in biscuit manufacturing is to interrupt the gluten network by surrounding the flour particles, thus providing softness (Chavan et al. 2016). In addition to giving biscuits a soft and crisp texture, the fat can also affect the flavor, lubricity, mouth-feel, aeration and taste (Aggarwal et al. 2016).
Biscuits are a good source of energy and are ready-to-eat foods. It is therefore not surprising that they have become one of the most popular snacks worldwide. Biscuits have a low manufacturing cost and are shelf-stable due to their low water activity. Moreover, biscuits can be produced in large quantities in minimal time, enabling widespread distribution (Cheng and Bhat 2016).
However, consumers are now demanding foods with additional health benefits. Due to the prevalence of diseases such as diabetes, cancer, high blood cholesterol, coronary heart disease and obesity, a recent focus of food science has been the development of formulations with reduced sugar levels (e.g. by replacing sugar with sweeteners such as polyols and intensely sweet compounds) and less fat (Chavan et al. 2016; Kutyla-Kupidura et al. 2015). The food industry has made a significant effort to produce biscuits with reduced fat and/or sugar levels (Dapčević et al. 2015). Furthermore, alternatives have been developed to replace the wheat flour in biscuits so as to address the prevalence of celiac disease, an inflammatory disease of the small intestine triggered by gluten proteins. It has been estimated that sales of gluten-free products have grown at an annual rate of 28% in recent years (Kaur et al. 2015). Cereals such as rice, maize, barley and millet have been used to replace wheat flour in biscuits (Chavan et al. 2016; Kaur et al. 2015). However, these gluten-free flours produce biscuits that have different physico-chemical characteristics to those made from wheat flour. In addition to these ingredients, dietary fiber can also be added to biscuits. The benefits of dietary fiber ingestion include a reduced risk of heart disease, as well as certain types of cancer, obesity, and diabetes. Dietary fiber resists digestion and absorption in the small intestine and undergoes total or partial fermentation in the large intestine. Soluble fiber increases gut viscosity and controls glucose and lipid metabolism. Insoluble fiber acts through its ability to ferment (Serial et al. 2016). However, the use of fiber (as a solid component) in cookie or biscuit dough has serious implications with regards to the structure of the biscuit. There are therefore certain technological limitations when it comes to the total fiber content (Raimundo et al. 2014).
The Maillard reaction (MR) is a type of NEB that occurs among reducing sugars and mostly free amino acids and peptides (usually from proteins) when heated. MR is a whole class of reactions as opposed to a single reaction, while MR products are a heterogeneous group. In biscuit production, MR is important for the production of brown hues on the surface of the foodstuff and contributes to its texture and flavor. If excessive MR occurs, it may be difficult to dry the biscuit without too much darkening of the product (Manley 2011). MR also has an impact on the final composition of the food. This is due to a decrease in nutritionally relevant substrates (such as essential amino acids), as well as the inhibition of various enzymes that are needed to digest food. It is also due to the development of new compounds that have both healthy (e.g. antioxidant melanoidins) and harmful (e.g. acrylamide, furan, hydroxy methyl furfural, heterocyclic amines) properties (Chavan et al. 2016; Patrignani et al. 2016).
In general, developing new products that satisfy the aforementioned requirements requires a combination of controlled food structures in which the role of each component is clearly understood (Aguilera 2006). There is no published data available on the structure and MR development of biscuit formulations containing only alternative sources of starch (potato and wheat) mixed with varying amounts of fiber, fat and gluten. Therefore, the aim of this research was to determine the effect of composition (dietary fiber, fat and gluten) and baking time on the image-observed microstructure and physical appearance of starch granules (from two botanical sources). Furthermore, color image analysis was also used to determine the non-enzymatic browning development of these matrices.
Materials and methods
Materials
Matrices (biscuit models) were prepared using either potato starch (Quimatic, Huechuraba, Chile) or wheat starch (Roquette, Lestrem, France). Furthermore, dietary fiber (Inulin, Terrium, Belgium), fat (Hornito Margarine for baking, Watt’s S.A., San Bernardo, Chile), vital wheat gluten (Asitec S.A., Maipú, Chile), glucose (Sigma-Aldrich, USA), sodium chloride (fine salt, Sociedad Punta de Lobos, Iquique, Chile), and distilled water were used in the formulation.
Sample preparation
To evaluate the effect of the formulation of a dough on biscuit structure and NEB development, the levels of dietary fiber, fat and gluten were used as the variables in different formulations (Table 1). Furthermore, two botanical sources of starch were assessed: potato and wheat starch.
Table 1.
Amount of samples (g) corresponding to each level of the variables
| Ingredient | Level | ||
|---|---|---|---|
| 0 | 1 | 2 | |
| Dietary fiber (DF) | 0 | 5 | 10 |
| Fat (F) | 0 | 20 | 40 |
| Gluten (G) | 15 | 20 | 30 |
The doughs were prepared by mixing the fiber (10 g), gluten (30 g), starch (178 g), glucose (20 g), and sodium chloride (0.2 g) with distilled water (117 g), in a blender (Premier Chef 4.6L, Kenwood Ltd.) for 9 min. To assess the influence of each variable, the amount of each ingredient was adjusted according to the desired level. The dough was allowed to rest for 30 min at 4 °C and then sheeted (MAL-1006, Malta) to a final thickness of 0.5 mm. The sheeted dough was cut into 4-cm diameter discs using a mold.
The dough was placed on a silicone sheet in order to prevent sticking and baked at 230 °C. The samples were stored in hermetically-sealed plastic bags and refrigerated until the analysis took place.
Scanning electron microscopy (SEM)
The samples were examined using a scanning electron microscope (LEO 1420VP, Carl Zeiss, Oberkochen, Germany). The samples were fixed onto the holders using double-sided tape and gold-coated (~ 20 nm) using a Varian Vacuum Evaporator (PS 10E, Evey Engineering’s Warehouse, New Jersey, USA). The microstructure of the samples was analyzed using the SEM images at an accelerating voltage of 25 kV.
The images were processed and analyzed using ImageJ 1.45 s software (National Institute of Health, USA). Two-dimensional shape and size descriptors of starch granules were then determined based on this image analysis. The equivalent diameter (Deq) of starch granules was calculated using the following expression (Russ 1999):
| 1 |
The equivalent diameter is a parameter that allows for size to be easily compared (Russ 1999). In addition, circularity (C) was determined as follows (Ferreira and Rasband 2012):
| 2 |
Circularity is a shape parameter where a value of 1.0 indicates a perfect circle, while a lower value approaching 0.0 indicates an increasingly elongated shape (Ferreira and Rasband 2012).
Optical microscopy
The mesostructure of the samples was assessed using optical microscopy. The samples were deposited on a glass slide and observed under a stereomicroscope (SMZ 2B-2T, Nikon Corp., Japan). Images were then acquired using a digital camera (ToupCam TM, Touptek Photonics, China) and ToupView 3.5 (ToupTek, Zhejiang, China). Two images were acquired for each sample.
Colorimetry
The color parameters (L*, a*, b*) of the samples were determined using a computer vision system (DVS-Lab, Digital Vision Solutions, Santiago, Chile) (Mery et al. 2013). The L* (black 0 to white 100), a* (green − 120 to red 120) and b* (blue − 120 to yellow 120) values correspond to the lightness, redness and yellowness on the CIELAB color scale, respectively. Each measurement was taken four times. Leiva-Valenzuela and Aguilera’s (2013) method was used to obtain information from the correlative images of the samples.
Moisture content
Moisture content was determined gravimetrically (Dueik et al. 2010). Samples of level 0 and level 2 of each analyzed ingredient, baked for 7, 13 and 19 min, were dried in a forced air oven at 105 °C to constant weight.
Texture analysis
The texture of the samples was determined using a texture analyzer (TA XT2, Stable Microsystems, UK). A three-point test was performed using a support span of 16 mm. The samples were fractured at a constant rate of 10 mm/s using a steel blade with a flat edge with a thickness of 2.5 mm. The force (N) at the fracture point (highest value on the graph) was then determined (Dueik et al. 2010). Texture analysis was carried out on eight examples from each sample. The texture was measured in samples of levels 0 and 2 of each analyzed ingredient, baked for 7, 13 and 19 min.
Statistical analysis
Differences between samples were detected using ANOVA and Tukey’s test with version 15.1.02 of the StatGraphics Centurion XV software (StatPoint Inc., VA, USA).
Results
Biscuit structure
The microstructure of the biscuits after baking is presented using the SEM images (Fig. 1). The average size of the starch granules (i.e. equivalent diameter) differed significantly between the two botanical sources, with 9 ± 4 µm for wheat starch and 27 ± 13 µm for potato starch. Theses sizes fall within the range that was reported for native starch from wheat (4–39 µm) and potato (21–81 µm) (Muñoz et al. 2015). The circularity of the samples also revealed significant differences as it was 0.57 ± 0.19 for the wheat samples, while it was 0.73 ± 0.16 for the potato samples. This means that the wheat starch granules were less round than the potato granules during baking. In order to better understand this trend, multiway ANOVAs were subsequently performed.
Fig. 1.
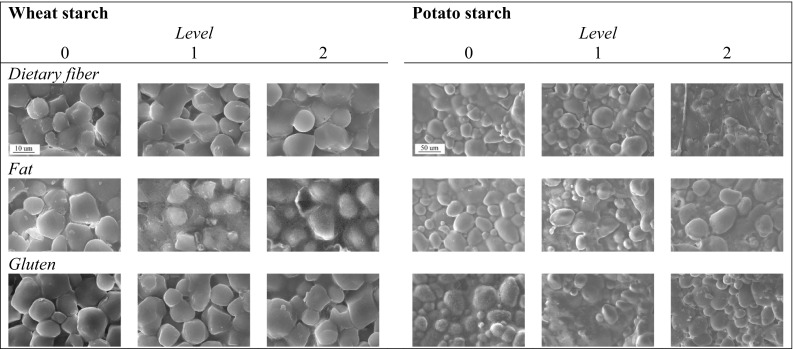
SEM images of matrices elaborated with wheat starch (5K× of magnification) and potato starch (1K× of magnification), after 25 min of baking
A multiway ANOVA was performed in the matrices that were supplemented with wheat starch. The independent variables were ingredient type, ingredient level and bake time. As a result of this analysis, ingredient type was shown to have a significant effect on Deq and C. The Deq and C values were lower in biscuits with fat (F), followed by dietary fiber (DF) and then gluten (G). Table 2 shows the average Deq and C for wheat starch granules, as well as the results from the two-way ANOVA and Tukey’s test, using ingredient level and bake time as independent variables for each ingredient type. For matrices with different levels of DF, the level of DF significantly influenced Deq and C: higher levels of DF led to higher Deq and higher C. Bake time only had a significant effect on the C values: C increased as bake time increased. However, for matrices with varying levels of F, the level of F had a significant effect on Deq and C, although no clear trend could be observed. Finally, for matrices with G, the level of G significantly influenced C as the C values increased as G increased.
Table 2.
Values of equivalent diameter (µm) and circularity of starch granules from two botanical sources
| Equivalent diameter | Circularity | ||||||||
|---|---|---|---|---|---|---|---|---|---|
| Time | Time | ||||||||
| 7 | 13 | 19 | 25 | 7 | 13 | 19 | 25 | ||
| Wheat | |||||||||
| Dietary fiber | 0 | 8 ± 5Aa | 7 ± 4Aa | 9 ± 5Aa | 8 ± 3Aa | 0.57 ± 0.31Aab | 0.47 ± 0.27Aa | 0.56 ± 0.18Aab | 0.63 ± 0.09Ab |
| 1 | 10 ± 2ABa | 10 ± 4ABa | 11 ± 1ABa | 10 ± 3ABa | 0.60 ± 0.07ABab | 0.59 ± 0.09ABa | 0.60 ± 0.12ABab | 0.72 ± 0.05ABb | |
| 2 | 9 ± 4Ba | 11 ± 4Ba | 11 ± 3Ba | 11 ± 3Ba | 0.58 ± 0.10Bab | 0.64 ± 0.14Ba | 0.66 ± 0.06Bab | 0.82 ± 0.05Bb | |
| Fat | 0 | 13 ± 1Ba | 11 ± 1Ba | 9 ± 3Ba | 13 ± 2Ba | 0.56 ± 0.09Ba | 0.60 ± 0.12Ba | 0.75 ± 0.04Ba | 0.68 ± 0.12Ba |
| 1 | 8 ± 3Aa | 10 ± 3Aa | 6 ± 4Aa | 5 ± 4Aa | 0.40 ± 0.13Aa | 0.72 ± 0.09Aa | 0.41 ± 0.13Aa | 0.36 ± 0.10Aa | |
| 2 | 14 ± 0Ba | 11 ± 4Ba | 7 ± 3Ba | 10 ± 3Ba | 0.59 ± 0.11Aa | 0.34 ± 0.14Aa | 0.29 ± 0.20Aa | 0.65 ± 0.10Aa | |
| Gluten | 0 | 11 ± 2Aa | 13 ± 0Aa | 8 ± 4Aa | 10 ± 3Aa | 0.51 ± 0.09Aa | 0.53 ± 0.07Aa | 0.53 ± 0.23Aa | 0.70 ± 0.07Aa |
| 1 | 11 ± 5Aa | 11 ± 3Aa | 11 ± 3Aa | 11 ± 2Aa | 0.64 ± 0.10ABa | 0.66 ± 0.10ABa | 0.55 ± 0.12ABa | 0.65 ± 0.11ABa | |
| 2 | 10 ± 4Aa | 12 ± 4Aa | 10 ± 7Aa | 9 ± 4Aa | 0.79 ± 0.07Ba | 0.68 ± 0.13Ba | 0.74 ± 0.09Ba | 0.57 ± 0.22Ba | |
| Potato | |||||||||
| Dietary fiber | 0 | 43 ± 14Aa | 35 ± 7Aa | 45 ± 9Aa | 22 ± 9Aa | 0.63 ± 0.09Aab | 0.52 ± 0.16Aab | 0.65 ± 0.11Aa | 0.64 ± 0.17Ab |
| 1 | 26 ± 16Aa | 25 ± 13Aa | 29 ± 14Aa | 28 ± 11Aa | 0.65 ± 0.17Bab | 0.71 ± 0.11Bab | 0.65 ± 0.18Ba | 0.78 ± 0.06Bb | |
| 2 | 27 ± 8Aa | 28 ± 10Aa | 23 ± 10Aa | 20 ± 8Aa | 0.84 ± 0.04Cab | 0.82 ± 0.05Cab | 0.71 ± 0.14Ca | 0.83 ± 0.01Cb | |
| Fat | 0 | 26 ± 12Aa | 27 ± 12A | 26 ± 16Aa | 26 ± 11Aa | 0.73 ± 0.11Aa | 0.75 ± 0.07Aa | 0.78 ± 0.07Aa | 0.76 ± 0.13Aa |
| 1 | 28 ± 14ABa | 27 ± 8ABa | 30 ± 18ABa | 22 ± 14ABa | 0.79 ± 0.09Aa | 0.71 ± 0.12Aa | 0.77 ± 0.07Aa | 0.81 ± 0.04Aa | |
| 2 | 26 ± 16Ba | 27 ± 3Ba | 40 ± 15Ba | 44 ± 8Ba | 0.83 ± 0.04Ba | 0.88 ± 0.02Ba | 0.86 ± 0.03Ba | 0.80 ± 0.08Ba | |
| Gluten | 0 | 25 ± 12Aa | 22 ± 13Aa | 27 ± 15Aa | 31 ± 14Aa | 0.71 ± 0.11Aa | 0.53 ± 0.20Aa | 0.73 ± 0.13Ab | 0.83 ± 0.06Ab |
| 1 | 26 ± 12Aa | 27 ± 7Aa | 26 ± 11Aa | 26 ± 11Aa | 0.64 ± 0.20Ba | 0.87 ± 0.03Ba | 0.80 ± 0.18Bb | 0.85 ± 0.03Bb | |
| 2 | 23 ± 11Aa | 28 ± 14Aa | 28 ± 12Aa | 29 ± 9Aa | 0.65 ± 0.19Ba | 0.82 ± 0.09Ba | 0.82 ± 0.09Bb | 0.81 ± 0.06Bb | |
Means with different superscript letters in columns of each ingredient are significantly different (P < 0.05) for two-way ANOVA and Tuckey test with bake time (small letters) and level of ingredient (capital letters), for each formulation
When the food matrices with potato starch were analyzed using multiway ANOVA, the independent variables ingredient type, ingredient level and baking time were all found to have a significant effect on C. In this sense, the C values increased as the baking time and level of each ingredient increased. The matrices with DF had lower C, followed by G; F had the highest value. The two-way ANOVA, taking the level of ingredient and bake time as the independent variables, revealed that the level of DF and bake time had a significant effect. C was higher when there were higher levels of DF and longer bake times. For matrices with F, the level of F significantly influenced Deq and C, i.e. a higher level of F revealed higher Deq and C. Finally, for matrices supplemented with G, the level of G and bake time had an effect on C, i.e. C values increased as the level of G and bake time increased.
The physical state of the biscuit starch depends on the composition and processing conditions. During manufacturing, starch gelatinization can usually be restricted by low availability of water and high levels of fat and sugar. However, in formulations with high levels of water and low levels of sugar, starch gelatinization can often be prevalent (Sozer et al. 2014). Gelatinization is defined as the process through which starch undergoes an order–disorder phase transition. In this transition, the starch’s intermolecular bonds are broken down, allowing engaging water molecules. This process destroys the starch granule’s structure (Schuchardt et al. 2016; Ng et al. 2017). Several techniques have often been used to characterize starch gelatinization. These techniques include differential scanning calorimetry, where the gelatinization range is determined, as well as X-ray diffraction and polarized light microscopy (Ng et al. 2017; Ovalle et al. 2013; Mamat et al. 2010). Some researchers have found a correlation between SEM images and gelatinization. As complete gelatinization involves the destruction of starch granules and SEM images can reveal the physical state of such granules, it is therefore suggested that SEM images can be used to approximate the degree of gelatinization (Chen et al. 2017). In this case, the SEM images showed that the morphologic features of the granules were unaltered. As such, the granules maintained their shape and size throughout the entire period of baking, suggesting that the granules had not completely gelatinized.
On the other hand, starch granules from matrices with different levels of DF and G (for potato starch) increased in C by as much as 33% as the bake time increased. This may be due to the swelling from water absorption (Ng et al. 2017) that occurred during baking with these formulations.
The effect of the ingredients that were added, as well as their quantities, was different in each case. In the case of F, this ingredient competes with water (or aqueous phase) in terms of surface area when it comes to flour. The presence of F surrounding the starch granules of the wheat can be identified in wheat starch biscuits in Fig. 1. In the case of potato starch-based biscuits, the presence of F is also detected in the SEM images at 5 K magnification (images not shown), while cracks were also observed. At high levels of F, little gluten is formed, while starch swelling and gelatinization is reduced (Manley 2011). This was reflected in low Deq and C values for matrices containing wheat starch with F.
The DF (soluble) added to the dough can reduce starch gelatinization by limiting water availability (Sozer et al. 2014). A low Deq would therefore be expected in matrices with high DF. However, the Deq at different levels of DF was similar across the samples.
Incorporating G into the biscuits has a significant impact due to its high capacity for water absorption. Furthermore, G allows gas bubbles to be retained during baking, leading to an open texture (Manley 2011). In our case, the size of the starch granules remained stable during baking, while the C values tended to increase.
The physical state of the starch granules in food has an impact on health. The presence of ungelatinized starch in foods can allow for a low glycemic index (GI) or postprandial blood glucose level (Englyst et al. 1999; Garsetti et al. 2005; Kawai et al. 2013; Sozer et al. 2014). However, Garsetti et al. (2005) have noted that the presence of slowly available glucose (SAG) and rapidly available glucose better explains the variation in GI in different types of biscuits than their macronutrient composition. High SAG levels may be linked to low starch gelatinization. Partially-intact starch granules in the end product are less susceptible to the actions of amylolytic enzymes. As a perspective, it may therefore be suggested that aiming for high SAG content in biscuits is a good strategy for lowering GI (Englyst et al. 1999, 2003; Garsetti et al. 2005; Sozer et al. 2014). Low-GI diets may also help to reduce the risk of obesity and type 2 diabetes (Garsetti et al. 2005; WHO/FAO 2003).
Optical microscopy (Online Resource 1) reveals the effect of the ingredients on the sample structure. At the levels of magnification used in this study large air bubbles are clearly visible. This is especially true in biscuits supplemented with wheat starch, while the air bubbles are smaller in biscuits made with potato starch. The images for biscuits supplemented with potato starch are only provided for the final bake time as no changes were observed during baking.
The addition of DF revealed that this component may result in fewer air bubbles in the end product. At higher levels of DF, the samples contained fewer air bubbles. Furthermore, large air bubbles appeared toward the end of baking in samples with higher levels of DF. Incorporating F into biscuits did not prevent the development of air bubbles in the structure, while at higher levels the bubbles were smaller. In addition, the air bubbles appeared toward the end of baking, especially with high levels of F. The final part of Online Resource 1 clearly shows the effect of G on biscuits. The G network can retain gas during the baking process (Anderson et al. 2011). Therefore, more air bubbles can observed with high levels of G. Additionally, air bubbles were also observed during baking.
Color development
The L* value of the samples (luminosity) decreased over time as the samples became darker. The L* parameter is critical in heat-treated foods as it is the first parameter of quality that is evaluated by consumers. Furthermore, L* values are mainly associated with nonenzymatic browning reactions, i.e. low L* values indicate a darker color and the development of browning (Dueik et al. 2010; Yuan et al. 2016).
The largest decrease in L* occurred between 13 and 19 min of baking (Fig. 2). Following this, the L* value remained constant. In addition, the biscuits made with potato starch had the lowest L* values.
Fig. 2.

L* values of wheat (a, c, e) and potato cookies (b, d, f)
In biscuits supplemented with wheat starch, the lowest L* values were obtained in samples containing F and after 19 to 25 min of baking. When the levels of each ingredient were assessed, different trends could be observed. In the samples with DF, the lowest L* was found at level 1, while in the samples with F, the lowest L* level was found at levels 0 and 2. In the samples with G, L* was also lowest at levels 0 and 2.
As with the wheat samples, differences were found for each ingredient that was used in the potato samples. In the samples with DF, the lowest L* value was found for level 1, followed by level 0; in the samples with F and G, the lowest L* values were found at levels 0 and 2.
NEB can be influenced by many factors, including temperature, reactant concentration, reaction time, and water content (Sharma and Gujral 2013). For example, a high protein concentration in biscuits can promote NEB, expressed as a decrease in lightness values (Jan et al. 2016). In line with this trend, the L* value for samples with G was lower at level 2 than it was for level 1. On the other hand, the moisture content can influence the generation of NEB in foods as it affects molecular mobility and chemical reactivity, which may or may not favor the Maillard reaction (Cécile et al. 2016). In our case, when adding DF, the L* value was lower at level 1 than at level 2. However, samples without DF (level 0) were similar to samples with level 2 DF. In this sense, DF most likely has a larger effect on the water availability for the biscuit dough, while its influence on NEB may or may not be favorable, depending on the level of DF.
The a* and b* values (results not shown) also varied with the changes to the ingredients. The samples with wheat starch were redder (lower a* value) when DF was added and after the shortest baking times. The biscuit samples with potato starch and F were yellower (lower b* values).
The browning of biscuits and baked products is mainly caused by the Maillard reaction, which can be stimulated at high temperatures and with low water content (Kawai et al. 2016). However, as was revealed, this depends on the level of water and the composition of the biscuit. Non-enzymatic browning is related with high sensorial quality, including the development of flavor, aroma, texture and color. However, as mentioned previously, this reaction can lead to the formation of harmful or toxic compounds, such as furan and its derivatives, as well as acrylamide (Mariotti et al. 2017; Pedreschi et al. 2005). It has been suggested that there is a strong correlation between the L* value and the logarithm of 5-hydroxymethylfurfural concentration in cookies. This compound, which is usually the result of MR or caramelization, has a potentially cytotoxic and carcinogenic effect on humans (Kowalski et al. 2013).
It appears that browning can be prevented by a certain (adequate) level of each ingredient, e.g. level 1 of F, level 2 or 0 of DF and level 1 of G.
In the same way, browning can be prevented slightly by choosing a botanical starch source (in our case, potato). As the baking time influences the development of browning, comparisons were made after the same amount of baking in order to detect differences. Samples that were baked for 13–19 min (Fig. 2) had adequate color and quality. To avoid excessive browning, some samples could be baked for shorter times, providing that other sensory parameters such as texture are not affected.
Future work should analyze the influence of other compositional parameters of biscuits on additional sensory and quality parameters, such as texture and flavor. This research may reveal the parameters and ingredients that are required in order for biscuits to contain starch with a low level of gelatinization (low GI) and minimal Maillard reactions (low presence of harmful compounds), at the same time as retaining positive sensory qualities.
Moisture content
As expected, the moisture content of biscuits significantly decreased with thermal processing (two-way ANOVA). After 7 min of baking, the moisture content for the two botanical sources and the different variations of DF, F and G ranged between 8.31 and 2.46%. This was statistically significant (Tukey test, P ≤ 0.05) when compared with 13 or 19 min of baking, which had extreme values of 5.18 and 1.21%, respectively. This behavior was the same for the two botanical sources, where no statistical differences were found (Table 3). For biscuits made with wheat or potato starch, only G had a significant effect. In this sense, the moisture content was higher in the level 2 than the level 0. During matrix formation, gluten proteins are hydrated and form permanent cross-linking structures. These absorb water and delay water delivery from the matrix to the environment during baking (Manley 2011).
Table 3.
Values of texture (N) and moisture (%) of starch samples from two botanical sources
| Texture (N) | Moisture (%) | ||||||
|---|---|---|---|---|---|---|---|
| Time (min) | Time (min) | ||||||
| 7 | 13 | 19 | 7 | 13 | 19 | ||
| Wheat | |||||||
| Dietary fiber | 0 | 26.30 ± 7.19Aa | 28.19 ± 5.98Aa | 33.19 ± 6.87Aa | 7.83 ± 0.26Aa | 3.06 ± 0.66Ab | 1.30 ± 0.34Ab |
| 2 | 33.21 ± 4.15Aa | 30.93 ± 4.89Aa | 29.24 ± 5.21Aa | 8.75 ± 0.65Aa | 2.02 ± 0.01Ab | 2.71 ± 0.76Ab | |
| Fat | 0 | 32.14 ± 4.18Aa | 30.87 ± 4.15Aa | 29.27 ± 4.22Aa | 8.31 ± 0.40Aa | 2.02 ± 0.24Ab | 2.04 ± 0.10Ab |
| 2 | 14.15 ± 2.80Ba | 16.75 ± 1.53Ba | 15.81 ± 3.10Ba | 4.63 ± 0.29Aa | 3.43 ± 0.02Ab | 1.21 ± 0.60Ab | |
| Gluten | 0 | 20.75 ± 3.45Aa | 14.86 ± 2.08Aa | 27.63 ± 4.76Aa | 2.86 ± 0.02Aa | 1.59 ± 0.35Ab | 1.23 ± 0.02Ab |
| 2 | 32.70 ± 4.34Ba | 31.99 ± 6.28Ba | 29.24 ± 5.21Ba | 7.65 ± 0.30Ba | 2.59 ± 0.25Bb | 1.89 ± 0.18Bb | |
| Potato | |||||||
| Dietary fiber | 0 | 15.53 ± 5.07Aa | 20.63 ± 5.23Aa | 14.34 ± 2.44Aa | 6.79 ± 0.54Aa | 2.32 ± 0.51Ab | 2.85 ± 1.58Ab |
| 2 | 37.01 ± 3.75Ba | 42.91 ± 7.36Ba | 42.54 ± 14.08Ba | 12.18 ± 0.36Aa | 3.06 ± 0.42Ab | 1.27 ± 0.40Ab | |
| Fat | 0 | 25.60 ± 4.15Aa | 14.81 ± 2.12Ab | 19.63 ± 5.12Aab | 6.05 ± 0.81Aa | 2.57 ± 0.89Aab | 2.09 ± 1.15Ab |
| 2 | 11.89 ± 2.85Ba | 10.91 ± 1.81Bb | 11.92 ± 2.45Bab | 5.46 ± 0.18Aa | 5.18 ± 0.05Aab | 4.00 ± 1.32Ab | |
| Gluten | 0 | 14.96 ± 2.05Aa | 19.52 ± 6.10Aa | 14.10 ± 2.44Aa | 2.46 ± 0.29Aa | 2.46 ± 0.19Aab | 2.40 ± 0.86Ab |
| 2 | 25.67 ± 5.21Ba | 15.05 ± 2.11Ba | 18.68 ± 4.86Ba | 6.28 ± 0.68Ba | 3.05 ± 0.21Bab | 2.22 ± 0.38Bb | |
Means with different superscript letters in columns of each ingredient are significantly different (P < 0.05) for two-way ANOVA and Tuckey test with bake time (small letters) and level of ingredient (capital letters), for each formulation
There is a positive correlation between moisture and L* values in samples containing F at level 2 (R2 = 0.928 and R2 = 0.839 for potato and wheat samples, respectively) and G at level 0 (R2 = 0.999 for samples containing wheat). We have already discussed the effect of water content on NEB development. In this sense, the maximum increase of NEB was observed between 13 and 19 min. This is in line with the drying process that was observed in our experiment.
Texture development
The texture behavior during baking for wheat and potato biscuits can be observed in Table 3. No overall differences in texture (maximum breaking force) were found between the two botanical sources. On the other hand, significant differences were observed in the texture of the samples prepared with different levels of F and G for wheat biscuits, as well as DF, F and G for potato biscuits (Tukey test, P ≤ 0.05). In general, while adding G leads to a significant increase in hardness (i.e. a higher value of maximum breaking force), adding DF leads to only a slight increase. Interestingly, increasing F from level 0 to level 2 leads to a decrease of ~ 50% in the hardness values. The effect of G reported by our study is in line with previous research, where the firmness of biscuits was increased by adding protein. Furthermore, the DF content helps make the matrix harder by incorporating structures that interact with the G and gelatinized starch. On the other hand, adding F to biscuits prevents the formation of gluten strands, thus enhancing their textural sensory attributes or softness (Raimundo et al. 2014).
The baking times that were tested (7, 13 and 19 min) do not seem to affect the texture when each component is compared. This suggests that the biscuit crust, which is mainly responsible for its hardness (Dueik et al. 2010), is formed before 7 min of baking. However, the core of the biscuit at this time is still moist, i.e. the biscuit’s moisture value has not yet reached its minimum.
A negative correlation was found between the maximum breaking force and moisture in samples with DF at level 0 in samples with wheat (R2 = 0.826) and at level 2 in samples with potato and wheat (R2 = 0.957 and R2 = 0.743 for potato and wheat samples, respectively). This means that samples with a low moisture value had a high level of maximum breaking force.
Conclusion
The image analysis of different types of dough is one potential tool that allows us to study changes in starch. Analysis of SEM images suggests that starch granules remain in their native form in biscuits that are supplemented with wheat or potato starch and baked for 25 min at 230 °C. During baking, starch granules absorb water to varying extents. This was reflected in the increase of C that could be observed in our formulation. The addition of DF at higher levels, as well as G (in potato starch samples), allowed for matrices with starch granules with a high value of C (and therefore most likely higher degrees of gelatinization).
The biscuit color changed during baking, with increasing levels of browning, where the L* values decreased, which means that the luminosity decreased. Baking times of between 13 and 19 min demonstrated the highest ratio of change. The final L* value was lower in samples supplemented with potato starch. The L* values decreased in the same way as the moisture during baking.
The texture and moisture of the samples was directly affected by the level G content, and inversely affected by the level of F. The texture value did not vary much after 7, 13 and 19 min of baking, suggesting that the crust is formed before 7 min of baking.
Electronic supplementary material
Below is the link to the electronic supplementary material.
Acknowledgements
The authors would like to acknowledge the support they received from FONDECYT Projects 1110510 and 1150146. Gabriel A. Leiva-Valenzuela would like to thank FONDECYT Postdoctoral Fellowship 2014 N° 3140606.
Footnotes
Electronic supplementary material
The online version of this article (10.1007/s13197-017-3008-7) contains supplementary material, which is available to authorized users.
References
- Aggarwal D, Sabikhi L, Sathish MH. Formulation of reduced-calorie biscuits using artificial sweeteners and fat replacer with dairy–multigrain approach. NFS J. 2016;2:1–7. doi: 10.1016/j.nfs.2015.10.001. [DOI] [Google Scholar]
- Aguilera JM. Food products engineering: building the right structures. J Sci Food Agric. 2006;86:1147–1155. doi: 10.1002/jsfa.2468. [DOI] [Google Scholar]
- Anderson H, Öhgren C, Johansson D, Kniola M, Stading M. Extensional flow, viscoelasticity and baking performance of gluten-free zein-starch doughs supplemented with hydrocolloids. Food Hydrocoll. 2011;25:1587–1595. doi: 10.1016/j.foodhyd.2010.11.028. [DOI] [Google Scholar]
- Cécile R, Delphine L, Emilie R, Carole P, Thierry S. Mitigation strategies of acrylamide, furans, heterocyclic amines and browning during the Maillard reaction in foods. Food Res Int. 2016;90:154–176. doi: 10.1016/j.foodres.2016.10.037. [DOI] [PubMed] [Google Scholar]
- Chavan RS, Sandeep K, Basu S, Bhatt S. Biscuits, cookies, and crackers: chemistry and manufacture. In: Caballero B, Finglas PM, Toldrá F, editors. Encyclopedia of food and health. Oxford: Academic Press; 2016. pp. 437–444. [Google Scholar]
- Chen X, Du X, Chen P, Guo L, Xu Y, Zhou X. Morphologies and gelatinization behaviours of high-amylose maize starches during heat treatment. Carbohydr Polym. 2017;157:637–642. doi: 10.1016/j.carbpol.2016.10.024. [DOI] [PubMed] [Google Scholar]
- Cheng YF, Bhat R. Functional, physicochemical and sensory properties of novel cookies produced by utilizing underutilized jering (Pithecellobium jiringa Jack.) legume flour. Food Biosci. 2016;14:54–61. doi: 10.1016/j.fbio.2016.03.002. [DOI] [Google Scholar]
- Dapčević T, Hadnađev M, Pojić M, Rakita S, Krstonošić V. Functionality of OSA starch stabilized emulsions as fat replacers in cookies. J Food Eng. 2015;167:133–138. doi: 10.1016/j.jfoodeng.2015.02.002. [DOI] [Google Scholar]
- Dueik V, Robert P, Bouchon P. Vacuum frying reduces oil uptake and improves the quality parameters of carrot crisps. Food Chem. 2010;119:1143–1149. doi: 10.1016/j.foodchem.2009.08.027. [DOI] [Google Scholar]
- Englyst K, Englyst HN, Hudson GJ, Cole TJ, Cummings JH. Rapidly available glucose in foods: an in vitro measurement that reflects the glycemic response. Am J Clin Nutr. 1999;69:448–454. doi: 10.1093/ajcn/69.3.448. [DOI] [PubMed] [Google Scholar]
- Englyst K, Vinoy S, Englyst H, Lang V. Glycaemic index of cereal products explained by their content of rapidly and slowly available glucose. Br J Nutr. 2003;89:329–339. doi: 10.1079/BJN2002786. [DOI] [PubMed] [Google Scholar]
- FAO/WHO (2003) Diet, nutrition and prevention of chronic diseases. In: WHO Technical Report Series 916 [PubMed]
- Ferreira T, Rasband W (2012) ImageJ user guide. IJ 1.46r. http://imagej.nih.gov/ij/docs/guide/. Accessed Oct 2016
- Garsetti M, Vinoy S, Lang V, Holt S, Loyer S, Brand-Miller J. The glycemic and insulinemic index of plain sweet biscuits: relationships to in vitro starch digestibility. J Am Coll Nutr. 2005;24:441–447. doi: 10.1080/07315724.2005.10719489. [DOI] [PubMed] [Google Scholar]
- Jan R, Saxena DC, Singh S (2016) Physico-chemical, textural, sensory and antioxidant characteristics of gluten-free cookies made from raw and germinated Chenopodium (Chenopodium album) flour. LWT Food Sci Technol 71:281–287
- Kaur M, Sandhu K, Arora A, Sharma A. Gluten free biscuits prepared from buckwheat flour by incorporation of various gums: physicochemical and sensory properties. LWT Food Sci Technol. 2015;62:628–632. doi: 10.1016/j.lwt.2014.02.039. [DOI] [Google Scholar]
- Kawai K, Matsusaki K, Hando K, Hagura Y. Temperature-dependent quality characteristics of pre-dehydrated cookies: structure, browning, texture, in vitro starch digestibility, and the effect on blood glucose levels in mice. Food Chem. 2013;141:223–228. doi: 10.1016/j.foodchem.2013.02.103. [DOI] [PubMed] [Google Scholar]
- Kawai K, Hando K, Thuwapanichayanan R, Hagura Y. Effect of stepwise baking on the structure, browning, texture, and in vitro starch digestibility of cookie. LWT Food Sci Technol. 2016;66:384–389. doi: 10.1016/j.lwt.2015.10.068. [DOI] [Google Scholar]
- Kowalski S, Lukasiewicz M, Juszczak L, Kutyla-Kupidura E. Dynamics of 5-hydroxymethylfurfural formation in shortbreads during thermal processing. Czech J Food Sci. 2013;1:33–42. [Google Scholar]
- Kutyla-Kupidura EM, Sikora M, Krystijan M, Dobosz A, Kowalsky S, Pysz M, Tomasik P. Properties of sugar-free cookies with xylitol, sucralose, acesulfame k and their blends. J Food Process Eng. 2015;39:321–329. doi: 10.1111/jfpe.12222. [DOI] [Google Scholar]
- Leiva-Valenzuela GA, Aguilera JM. Automatic detection of orientation and diseases in blueberries using image analysis to improve their postharvest storage quality. Food Control. 2013;33:166–173. doi: 10.1016/j.foodcont.2013.02.025. [DOI] [Google Scholar]
- Mamat H, Hardan MOA, Hill SE. Physicochemical properties of commercial semi-sweet biscuit. Food Chem. 2010;121:1029–1038. doi: 10.1016/j.foodchem.2010.01.043. [DOI] [Google Scholar]
- Manley D. Technology of biscuits, crackers and cookies. 3. Cambridge: Woodhead Publishing Ltd; 2011. [Google Scholar]
- Mariotti MS, Zúñiga R, Cortés P, Pedreschi F. A kinetic study of furan formation in wheat flour-based model systems during frying. J Food Sci. 2017;82:232–239. doi: 10.1111/1750-3841.13552. [DOI] [PubMed] [Google Scholar]
- Mery D, Pedreschi F, Soto A. Automated design of a computer vision system for visual food quality evaluation. Food Bioprocess Technol. 2013;6:1093–2108. doi: 10.1007/s11947-012-0934-2. [DOI] [Google Scholar]
- Mieszkowska A, Marzec A. Effect of polydextrose and inulin on texture and consumer preference of short-dough biscuits with chickpea flour. LWT Food Sci Technol. 2016;73:60–66. doi: 10.1016/j.lwt.2016.05.036. [DOI] [Google Scholar]
- Muñoz L, Pedreschi F, Leiva A, Aguilera JM. Loss of birefringence and swelling behavior in native starch granules: microstructural and thermal properties. J Food Eng. 2015;152:65–71. doi: 10.1016/j.jfoodeng.2014.11.017. [DOI] [Google Scholar]
- Ng SH, Robert SD, Wan Ahmad WAN, Wan Ishak WR. Incorporation of dietary fibre-rich oyster mushroom (Pleurotus sajor-caju) powder improves postprandial glycaemic response by interfering with starch granule structure and starch digestibility of biscuit. Food Chem. 2017;227:358–368. doi: 10.1016/j.foodchem.2017.01.108. [DOI] [PubMed] [Google Scholar]
- Ovalle N, Cortés P, Bouchon P. Understanding microstructural changes of starch during atmospheric and vacuum heating in water and oil through online in situ vacuum hot-stage microscopy. Innov Food Sci Emerg. 2013;17:135–143. doi: 10.1016/j.ifset.2012.11.006. [DOI] [Google Scholar]
- Patrignani M, Rinaldi GJ, Lupano CE. In vivo effects of Maillard reaction products derived from biscuits. Food Chem. 2016;196:204–210. doi: 10.1016/j.foodchem.2015.09.038. [DOI] [PubMed] [Google Scholar]
- Pedreschi F, Moyano P, Kaack K, Granby K. Color changes and acrylamide formation in fried potato slices. Food Res Int. 2005;38:1–9. doi: 10.1016/j.foodres.2004.07.002. [DOI] [Google Scholar]
- Raimundo A, Fradinho P, Nunes MC. Effect of psyllium fibre content on the textural and rheological characteristics of biscuit and biscuit dough. Bioact Carbohydr Diet Fibre. 2014;3:96–105. doi: 10.1016/j.bcdf.2014.03.001. [DOI] [Google Scholar]
- Russ JC. The image processing handbook. Berlin: Springer; 1999. [Google Scholar]
- Schuchardt JP, Wonik J, Brindrich U, Heinemann M, Kohrs H, Schneider I, Möller K, Hahn A. Glycemic index and microstructure analysis of a newly developed fiber enriched cookie. Food Funct. 2016;7:464–474. doi: 10.1039/C5FO01137J. [DOI] [PubMed] [Google Scholar]
- Serial MR, Blanco MS, Carpinella M, Valentinuzzi MC, León AE, Ribotta PD, Acosta RH. Influence of the incorporation of fibers in biscuit dough on proton mobility characterized by time domain NMR. Food Chem. 2016;192:950–957. doi: 10.1016/j.foodchem.2015.07.101. [DOI] [PubMed] [Google Scholar]
- Sharma P, Gujral HS. Extrusion of hulled barley affecting β-glucan and properties of extrudates. Food Bioprocess Technol. 2013;6:1374–1389. doi: 10.1007/s11947-011-0777-2. [DOI] [Google Scholar]
- Sozer N, Cicerelli L, Heiniö R, Poutanen K. Effect of wheat bran addition on in vitro starch digestibility, physico-mechanical and sensory properties of biscuits. J Cereal Sci. 2014;60:105–113. doi: 10.1016/j.jcs.2014.01.022. [DOI] [Google Scholar]
- Yuan Y, Chen D, Liu H, Wu S, Yan H. A comparison study of frying conditions on furan formation in 3 potato varieties. J Food Sci. 2016;81:T2114–T2121. doi: 10.1111/1750-3841.13386. [DOI] [PubMed] [Google Scholar]
Associated Data
This section collects any data citations, data availability statements, or supplementary materials included in this article.