Abstract
Background:
Dengue is a disease related to the environment that spreads rapidly. Prevention movement is considered ineffective; therefore, a more efficient early warning system is required. It is required strongly correlated variables to as predictor in early warning system. This study aims to identify the environmental conditions associated with dengue.
Materials and methods:
This ecological study was conducted on five sub-districts selected based on the trend of the incidence. Data land cover and elevation obtained using GIS. Climate data were obtained from Meteorology and Climatology and Geophysics Agency of Yogyakarta.
Results:
There were 1.150 dengue cases from 2008-2013 obtained from District Health Office. The spatial pattern is clustered in all sub-districts (Z-score < -2.58). There is a positive correlation between land cover and dengue (p 0.000; r 0.284) and a negative correlation between elevation areas and dengue (p 0.000; r - 0.127). Multiple Regression Test shows the effect of humidity (p 0.000) and rainfall (p 0.002) with a contribution of 13.5% - 27.4% (r2 0.135 – 0.274), while temperature has no effect in all sub-districts (p > 0.05). There is no effect of climate parameters in sporadic dengue areas (p > 0.05).
Conclusion:
It is concluded that dengue in Sleman is clustered and associated with the environment parameter, even though it does not have close correlation. High elevated and small building area is consistent with the lower dengue cases. Humidity and rainfall affect dengue, but temperature does not affect dengue.
Keywords: dengue, climate, land cover, elevation, spatial patter
Introduction
Dengue Hemorrhagic Fever (DHF) becomes a health problem in the world, particularly in tropical areas, including Indonesia even the number of incidents is increasing, even though the mortality rate is decreasing (Directorate CD&EH, Dept. of Health RI., 2010). The incidents of dengue fever in Indonesia increased from 0.05/100.000 in 1968 to 35-40/100.00 in 2013. The highest epidemic was in 2010 (85.70/100/000), even though the mortality rate decreased from 41% in 1968 to 0.73% in 2013 (Karyanti et al., 2014).
In Asia, Aedes aegypti is the main vector of dengue and Aedes albopictus is the secondary vector (De Melo et al., 2012). Geographically, Aedes aegypti spread in both tropical and subtropical areas and has living environment close to human (Kraemer et al., 2015). Aedes albopictus is more tolerant to cold temperature so that it has geographical spread larger to sub-tropical areas (Brady et al., 2013). Aedes aegypti lives optimally in 26-30○C and humidity of 70-80% (Mourya et al., 2004) along with the availability of breeding place (Espinosa et al., 2016) and food sources (Arrivillaga and Barrera, 2004).
Dengue transmission occurs through the bites of mosquito that contains virus. The infected mosquito will contain virus for its whole life and it can transmit virus through ovarium (Lee and Rohani, 2005; Espinosa et al., 2014). This transovarian transmission will make the pre-adult stadium contain virus as well, so that it can increase the number of mosquitos that contain virus in mosquito population which eventually will preserve even trigger the epidemy (Hartanti et al., 2010). Environment is an important factor for DHF to occur besides socio-ecological factors (Naish et al., 2014a).
Sleman district has various geographical characteristics and in these recent years it undergoes rapid change of land use. The rapid change of land use is in accordance with the development of Yogyakarta province as a tourism destination (Nurhadi et al., 2011) and as the center of higher education in Indonesia (Ramdhani et al., 2012). The change of land use can affect the environmental changes including climate (Kalnay and Cai, 2003). The climate change can result in a disease incident which is related to environment, including dengue. The climate parameters related to dengue among others are temperature, humidity and rain fall (Naish et al., 2014b).
Eight out of 17 sub-districts in Sleman are dengue endemic areas. The dengue incidents in Sleman from 2002 – 2012 were fluctuate and tended to increase with the highest number of cases (755 cases) occurred in 2007. The environmental changes in Sleman district and the dengue incidents which tend to increase make it important to conduct a study related to the environmental effects towards dengue in this district. The environmental conditions being studied are climate including temperature, humidity and rainfall; topography and land cover. This study aims to gain information related to environmental characteristics that contribute to the incidents of dengue. It is expected that this information could be used as a consideration in developing the area regarding its impacts towards the spread of dengue. Academically, this information can be used as a further reference to develop early warning system for the dengue outbreak.
Materials and methods
Study Sites
Sleman district is in Java Island, Indonesia ranges between 110° 33’ 00″ and 110° 13’ 00″ BT, 7° 34’ 51″ and 7° 47’ 03″ LS (Figure 1). The width of Sleman district is 57.482 acre or around 18% of the width of Yogyakarta province. Sleman district consists of 17 sub-districts, 86 villages and 1,212 hamlets. Based on its elevation, Sleman District region is divided into four classes which are < 100 m, 100 – 499 m, 500 – 999 m and > 1000 m above sea level (a.s.l.). Most of Sleman regions are on the height of < 1000 m a.s.l and only 2.6% that occupy the areas above 1000 m a.s.l.
Figure 1.
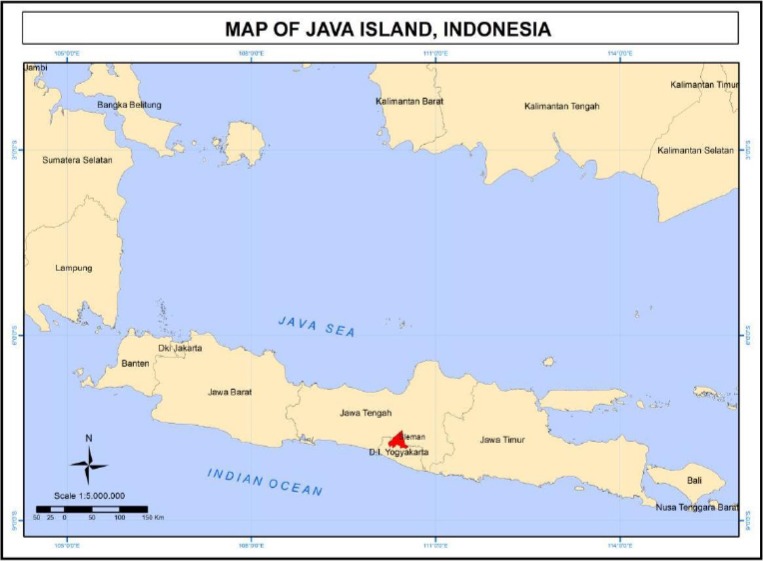
Sleman district is located in north part of Yogyakarta, Java Island of Indonesia
The use of land in Sleman shows degradation of 0.46% of wetlands and 6.6% of dry lands. There was an increase of yards for 0.7% during 2010-2013. The degradation of wetlands and dry lands along with the increased of yards is probably related to high number of newcomers. The number of newcomers in Sleman district in 2013 was higher (14,464 people) compared to the number of residents who moved out (11,121 people). The high number of newcomers result in the increased of settlements’ needs and other facilities, therefore, it increases the yards.
Sleman district region is classified into three kinds of growth center based on the area position and the society mobility which are Yogyakarta city agglomeration, sub-urban and buffer zone. (1) The area of city agglomeration is on the border of Yogyakarta city, so that it develops rapidly as the center of education, industry, service and trade along with the development of Yogyakarta city. The city agglomeration areas include Gamping, Depok and Mlati sub-districts. (2) The sub-urban area is a region which is located quite far from Yogyakarta city and develops into intended activities of the communities surround it so that it becomes the center of growth. Godean and Sleman sub-districts are included in sub-urban. (3) The buffer zone is a border of city development viewed from Yogyakarta city, but it also becomes the center of growth for its surrounding areas. Pakem sub-district is the buffer zone of Yogyakarta city.
Data collection
Monthly data of dengue cases in 2008-2013 become the secondary data gained from Health Department of Sleman District. The dengue case discussed in this study is Dengue Hemorrhagic Fever (DHF) and Dengue Shock Syndrome (DSS), not dengue fever (DF). The records of dengue cases both in Public Health Center and Health Department of Sleman district were conducted manually, so that there were differences in both data. Possible error was minimized by conducting cross check to confirm the data used for further analysis.
The determination of dengue patients’ coordinate point was conducted using Global Positioning System (GPS) Garmin. The record of patient’s address which was incomplete made it difficult to determine the patient’s house coordinate point so that it needed the help from village or hamlet officers or being excluded from the research.
The data of monthly climate, such as average temperature, the amount of rainfall and the average of humidity in 2008-2013 were gained from Indonesian Agency of Meteorology, Climatology and Geophysics (BMKG) of Yogyakarta Province. Spatial data processing was conducted using a software of ArcGIS 10.1. The land cover data used in this research were obtained by digitizing each building and appearance of vegetation in high resolution image (QuickBird) which are included in the buffer area, then the coverage was counted. Buffer area is a circle area with 200 m diameter in which the patient’s coordinate point as the center. Two hundred m diameter is determined based on twice of maximum flying distance of Aedes aegypti mosquitos. Data of elevation was collected using contour data interpolation method with 0.5 m interval. The map contour was obtained by downloading from Inageoportal in which the web address is http://tanahairindonesia.go.id.
Data analysis
Spatial pattern test Average Nearest Neighbour was used to discover the spatial patterns of dengue patients’ points. This kind of test is based on the average distance of a point with the nearest point for all points. If the average distance is smaller than a hypothetical random distribution, then it is called as clustered, if it is bigger than a hypothetical random distribution then it is called spread. Critical number to be stated as clustered or spread is when the value of Z-core is 2.58 or -2.58. If the value of Z-score >2.58 or < - 2.58 the coordinate points have a clustered pattern. Land cover data was classified into four based on the percentage of building area towards the total of building area and vegetation in the buffer area which are <30%; 31-6-%; 61-90% and >90%.
Spearman correlation test was used to assess the correlation between the land cover and the dengue incidents. Pearson correlation test was used to assess the correlation between the elevation and the dengue incidents. Multiple regression was used to gather information of the climate factors that affected the dengue incidents in five sub-districts of the research sites.
Permission Letter
We have the permission letter from District Health Office (Permission Letter No. 070/Bappeda/775/2015) and The Agency of Meteorology, Climatology and Geophysical, Station of Geophysical Class I, Yogyakarta Province (KT.401/490/YGI/III/2015) to conduct the research.
Results
Dengue Case
There are 1,150 dengue cases in five sub-districts of the research location during 2008-2013 periods. Serial data of dengue incidents from 2008 – 2013 show that those five sub-districts of research location have different trends of incident, even though in 2011 and 2012 all areas had decreasing cases. Gamping sub-district has a trend of high steady, Godean has a trend of increasing from moderate, Depok has a trend of stable moderate. Pakem is a sporadic area of dengue (Figure 2).
Fig. 2.
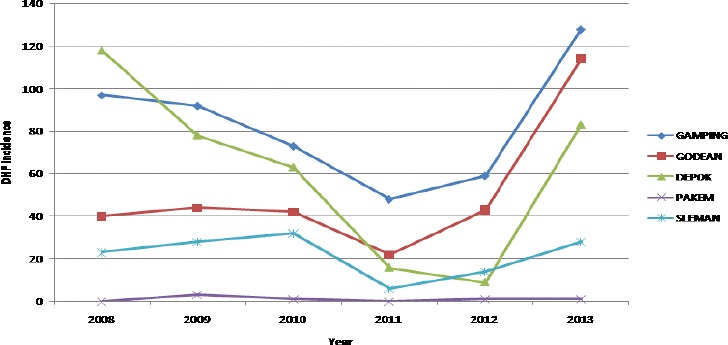
The DHF cases trend in periods of 2008-2013.
Gamping: steady high endemic area; Godean: moderate tend to increase; Depok: high tend to decrease; Pakem: sporadic area; Sleman: steady moderate endemic area
Spatial pattern:
Geographical distribution of dengue during 2008 – 2013 is shown in Figure 3. Average Nearest Neighbour (ANN) is used to assess whether the dengue cases are clustered or spread. The value of Z-score in this study is < -2.58 in all sub-districts, every year from 2008 – 2013 (Table 1). It can be interpreted that the dengue incidents in all sub-districts, are clustered every year.
Fig. 3.
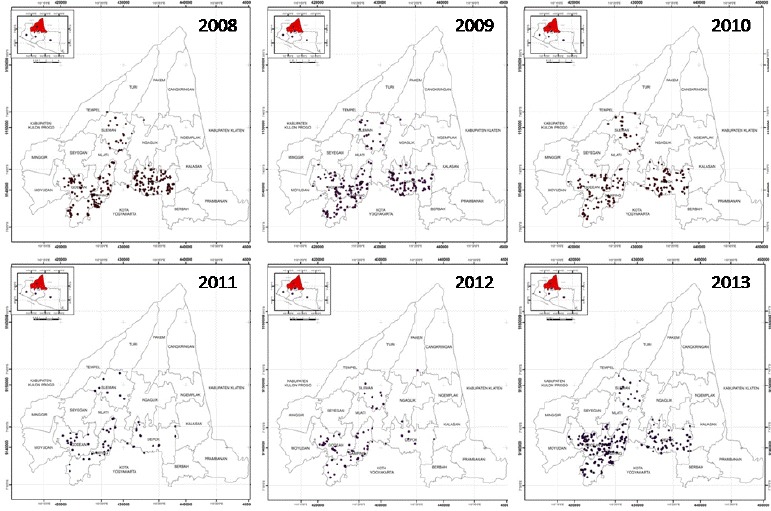
The spreading of DHF points in the periods of 2008 – 2013 in study site
Table 1.
The Result of Average Nearest Neighbour Analysis for Dengue Cases from Year 2008 – 2013 in All Research Sites
| Year | Z-score | P value |
|---|---|---|
| 2008 | -18,966 | 0,000 |
| 2009 | -16,084 | 0,000 |
| 2010 | -16,629 | 0,000 |
| 2011 | -6,755 | 0,000 |
| 2012 | -7,192 | 0,000 |
| 2013 | -18,293 | 0,000 |
Climate–dengue incidence
Sleman district has a wet tropical climate in which the rainy season is between November to April and the dry season is between May to October. The climate data shows that the lowest rainfall average is in August (0 mm) and the highest is in January (496.6 mm). The relative humidity is 73%-89%, in which the lowest is in August and the highest is in February. The temperature is 24.0° C-27.4 °C, the lowest is in June and the highest is in October. The result of regression test shows that humidity has significant effect towards the dengue incidents in Godean and Gamping sub-districts, while the rainfall affects the dengue incidents in Depok and Sleman.
The monthly dengue cases occurring throughout the year from 2008 – 2013 appear in accordance with the climate factors in all sub-districts (Figure 4 – 8). It is seen that the dengue cases increase during the rainy season (November-April) with the peak case occurs in January – February. It also shows that the temperature decreases in the peak of rainy season (December – January), but the lowest temperature is in dry season (June – July). The humidity fluctuation is seen along with the amount of rainfall which the humidity increases in the rainy season and decreases in the dry season.
Fig. 4.
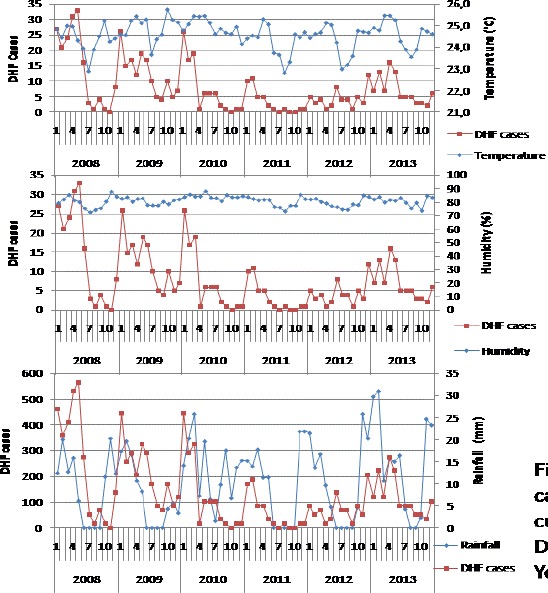
Monthly distribution of DHF cases, mean temperature, humidity and cumulative rainfall in sub-district of Depok, District of Sleman, Yogyakarta, Indonesia
Fig. 5.
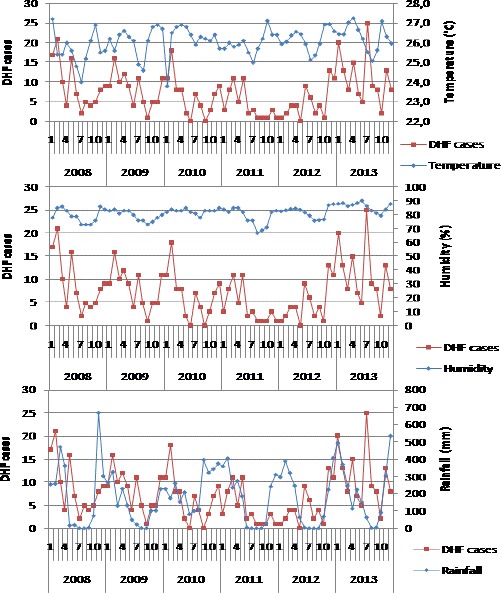
Monthly distribution of DHF cases, mean temperature, humidity and cumulative rainfall in sub-district of Gamping, District of Sleman, Yogyakarta, Indonesia
Fig. 6.
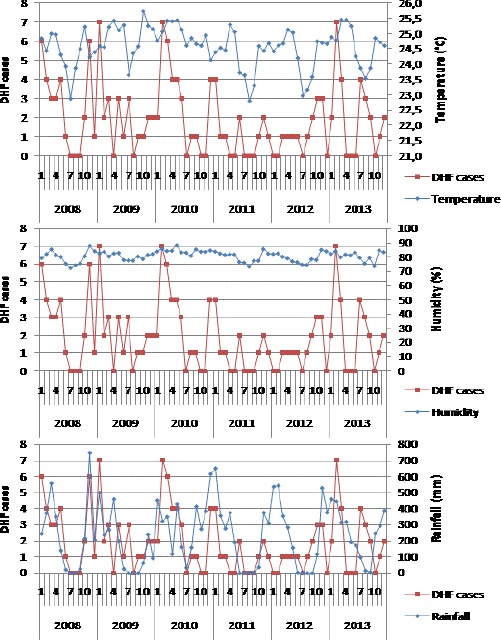
Monthly distribution of DHF cases, mean temperature, humidity and cumulative rainfall in sub-district of Sleman, District of Sleman, Yogyakarta, Indonesia
Fig. 7.
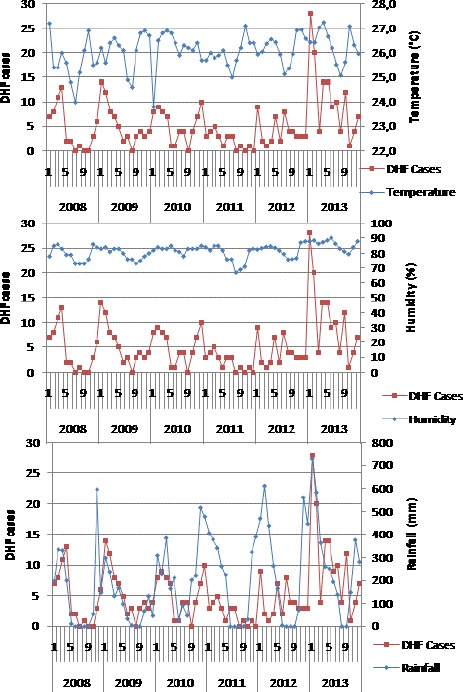
Monthly distribution of DHF cases, mean temperature, humidity and cumulative rainfall in sub-district of Godean, District of Sleman, Yogyakarta, Indonesia
Fig. 8.
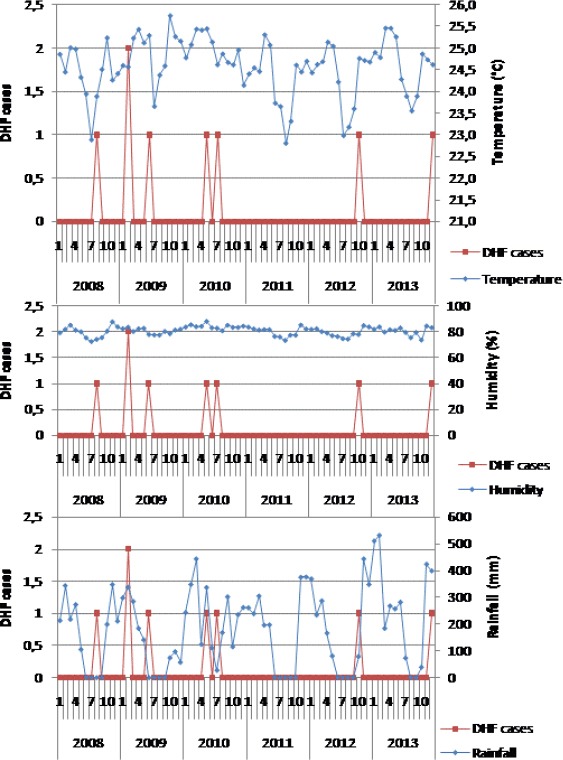
Monthly distribution of DHF cases, mean temperature, humidity and cumulative rainfall in sub-district of Pakem, District of Sleman, Yogyakarta, Indonesia
The regression tests show that the climate factors correlate significantly with dengue cases in most endemic areas studied, although the types of climate factors are different for different sub-districts. The dengue cases in Godean and Gamping are correlated with humidity factor (p 0.000), whereas in Depok and Sleman, the dengue cases are correlated with rainfall (p 0.002). The dengue cases in all sub-districts are not correlated with the temperature factor and all climate parameters are not correlated with dengue cases in sporadic areas. The determinant coefficient (r2) ranges from 0.135-0.274 depending on the location of the sub-districts. It means that the three climate parameters studied contribute to the dengue case together by 13.5%-27.4%, while the rest is affected by other factors not investigated in this study. Humidity is the most important climate factor that affects dengue cases in Sleman. Dengue cases in sporadic areas (Pakem) are not affected by climate (p > 0.05) (Table 2).
Table 2.
The Result of Multiple Regression Analysis for Climate – Dengue Cases
| Sub-district | P value of Temperature | P value of Humidity | P value of Rainfall | R2 |
|---|---|---|---|---|
| Gamping | P = 0,258 ns) | P = 0,000 *) | P = 0,377 ns) | 0,218 |
| Depok | P = 0,254 ns) | P = 0,940 ns) | P = 0,021*) | 0,135 |
| Godean | P = 0,894 ns) | P = 0,002 *) | P = 0,575 ns) | 0,274 |
| Sleman | P = 0,630 ns) | P = 0,827ns) | P = 0,014*) | 0,168 |
| Pakem | P = 0,458 ns) | P = 0,670 ns) | P = 0,569 ns) | 0,016 |
Land cover-dengue incidence
The distribution of dengue cases in 2008-2013 indicates that most cases occur in buffer areas that have a percentage of building area of 25%-75% of total building and vegetation area of 967 cases from 1,172 cases (82.51%) and only 83 (7.08%) occurs in areas with a percentage of buildings >75%. There are not any dengue cases that occur in the buffer area with 100% of the building, without vegetation. The Pearson correlation test proved that there is a positive correlation between land cover and dengue cases (p 0.000; r 0.284; α 0.01). This suggests that the larger area of the building is consistent with high dengue cases, but the correlation is weak.
Elevation-dengue incidence
The dengue cases in Sleman district with high category (50-80 cases/year) and very high (> 80 cases/year) occur at an elevation of less than 200 m a.s.l., especially at an elevation of 50-125 m a.s.l. Dengue cases still occur at an elevation of 300-425 m a.s.l. although with low category (Figure 9). The Pearson correlation analysis shows a negative correlation between the elevation of the site and the dengue case despite the weak correlation strength (p=0.000; r=-0.127). The higher a region, the lower the incidence of dengue.
Fig. 9.
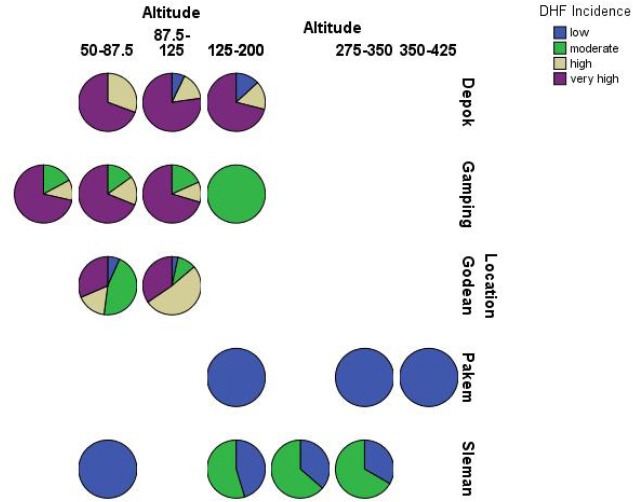
The distribution of DHF cases year 2008-2013 by altitude in study site
Discussion
Spatial pattern
The spatial pattern test using Average Nearest Neighbours shows that the incidence of dengue in five sub-districts in the study sites has a clustering pattern (Table 1). Dengue cluster patterns also occur in other places, such as the city of Yogyakarta in 2007-2008 periods (Indriani et al., 2011), and Queensland Australia period 1993-2012 (Naish et al., 2014b).
The character of clustered spatial patterns on dengue incidents is supported by Aedes mosquito bionomic. Aedes aegypti as the main vector has anthropophilic biting habits (Ponlawat and Harrington, 2005), endophage and endophilic (Rodrigues et al., 2015). Although Aedes albopictus as a secondary vector is generalist, exophilic and exophage (Delatte et al., 2010), both species have very short flying distances, maximum 65 m (Bergero et al., 2013). Aedes aegypti (Harrington et al., 2014) and Aedes albopictus (Delatte et al., 2010) also have a habit of biting to change hosts before they are full of blood (interrupted feeding).
Epidemiologically, clustered spatial patterns facilitate the determination of disease sources (Lai et al., 2009) because adjacent areas tend to have similar physical and social environment characteristics (Wieczorek and Delmerico, 2009). In the epidemiology of dengue disease, the characteristics of the physical and social environments in question are those that support transmission.
Several studies in Indonesia show that human attitudes and behavior can affect the environment in relation to dengue cases (Sibe et al., 2010; Nugrahaningsih et al., 2010). In sub-urban areas, the level of community education (Kesetyaningsih et al., 2012) and lower-middle-income but well-educated people (Hardayati et al., 2011) have a positive effect on Free Larva Rate. Free Larva Rate is an indicator to monitor Aedes aegypti infection level. Free Larvae Rate represents the risk of dengue transmission. A high Free Larva Rate (> 95%) indicates that in an area in question it is safe from dengue transmission. Thus, the cases of dengue fever in suburban areas including Sleman district can be prevented through efforts to increase knowledge about dengue and ways of its prevention.
Climate-dengue incidence
The result of multiple regression test of monthly climate data of 2008-2013 shows that humidity affects the dengue case in Gamping with p 0.000 and Godean with p 0.002, while the rainfall affects the dengue case in Depok with p 0.021 and Sleman with p 0.014. The average monthly temperature does not affect dengue cases in all sub-districts. The effect of three climate parameters on dengue cases was 13.5%-27.4% depending on the sub-district (Table 2). The weak climate effects on dengue cases may be due to the multifactorial nature of dengue. In addition to climate, dengue cases are also influenced by host conditions such as socio-economic factors (Hu et al., 2012), mobility (Subagia et al., 2013), and neighborhoods of settlements (Sarfraz et al., 2012; Murray et al., 2013) and viruses circulating in the environment (Murray et al., 2013).
In the Aedes aegypti system-dengue virus, daily survival and incubation periods of extrinsic pathogen are the most influential factors on the vector capacity (Luz et al., 2003; Maciel de Frietas, 2010). The daily survival is affected by humidity. According to Mourya et al. (2004), optimal humidity (70 - 80%) is required for the trachea to function properly so that the mosquito’s survival increases. Mosquito’s high endurance is important for virus multiplication to reach a sufficient number for infection. The incubation time in the mosquito body (EIP) ranges from 8-12 days (Lambrechts et al., 2011), so it takes a female mosquito that has longer life over that time span. Mosquito’s high survival and short extrinsic incubation will increase vector capacity.
In this study, the rainfall affects dengue incidence in Sleman and Depok sub-districts (Table 2). Rainfall affects humidity where high rainfall will increase the humidity (Umoh et al., 2013). In addition to increasing the humidity, rain will also cause an increase in breeding places outside the home (Bergero et al., 2013), but otherwise, heavy or long rain will damage the breeding place and wash away larvae or kill larvae (Mellor and Leake, 2000). The rainfall that reaches 140 mm a week can wash away larvae in breeding place (Suroso, 2000 cit. Wirayoga, 2013) so it decreases the number of larvae. High rainfall will also lower the environment’s temperature (Cong and Brady, 2012). Low environmental temperatures will prolong the mosquito reproduction cycle thus decreasing the frequency of blood sucking. Low environmental temperatures will also prolong the EIP of dengue virus (Goindin et al., 2015) thereby decreasing the vector capacity. The optimal temperature for mosquito survival is about 26°C-30°C (Mourya et al., 2004) but the best temperature is 27°C (Goindin et al., 2015).
The average temperature in Sleman District ranges from 22.8°C-27.2°C, depending on the season and elevation. Lower temperatures occur in highland areas during the dry season (June-July). Higher temperatures occur in lowland areas at the beginning of the rainy season (October) and the end of the rainy season (April). The weak rainfall effects on dengue cases in Sleman (Table 2) is likely to be that rainfall can have a negative or positive impact on the capacity of mosquito’s vectors. More in-depth research is needed to discover the effects of precipitation on dengue cases more precisely.
The results show that the temperature of the environment had no significant effect on dengue incident (Table 2). This is probably because the temperature factor used for the analysis is the monthly average, so the daily temperature fluctuations are not visible. Sharp maximum and minimum temperature fluctuations can decrease the mosquito’s survival (Carrington et al., 2013a) and accelerate extrinsic incubation of virus in the mosquito’s body in the laboratory (Carrington et al., 2013b). Day and night temperature differences are quite high during the dry season (June-November) in Indonesia. Kesetyaningsih (article submitted for publication) states that the minimum-maximum temperature difference affects the incidence of DHF in Sleman district. The higher the minimum-maximum temperature difference is, the lower the incidence of DHF. This indicates that in nature, minimum-maximum temperature fluctuations have a greater effect on mosquito’s survival than accelerate the extrinsic incubation of virus in the mosquito’s body. However, if Aedes mosquitoes adapt to high environmental temperature fluctuations, outbreak may occur because mosquitoes survive, while extrinsic incubation of the virus becomes faster.
Pakem is a sporadic dengue area (Figure 2), where dengue cases are not affected by climate factors (Table 2). Pakem is a highland area with relatively low average temperature (24°C) which unsuitable for Aedes’ life but has good humidity for Aedes’ life (72%-88%). It should be realized that Pakem can be an endemic area if the physical development is not followed by adequate community knowledge about dengue disease. Physical development can increase temperatures (Tokairin, 2006) and increase the number of breeding places (Saleeza et al., 2011), thus forming an environment suitable for the development of Aedes mosquitoes.
Land cover-dengue incidence
In Table 3, it appears that 92.92% of dengue cases in Sleman district occurred in buffer area with the percentage of building area ≤ 75% of total building area and tree vegetation. Only 7.08% of cases occurred in the buffer area with a percentage of the building area >75% of the total building area and tree vegetation, and no dengue cases occurred in the buffer area which is 100% in the form of building. Pearson correlation test shows a positive correlation (p 0.007; r 0.284; α 0.01) between percentage of building area and dengue case. The greater the percentage of the building area in the buffer area is, the more the dengue cases are. However, data suggest that dengue cases always occur in buffer areas that have tree vegetation. In this study, the calculated vegetation is trees, not grass or rice field. This is based on the knowledge that the existence of trees is relatively the same throughout the year and impacts on the maintenance of local humidity (microenvironment) (Wong and Peck, 2005; Tahir and Yousif, 2013a; Obi, 2014) and decreases the wind speed in the area around trees (Leenders et al., 2007; Tahir and Yousif, 2013b). Aedes aegypti chooses shading places (Prado et al., 2017), cold places and humid (Champion and Vitek, 2014), and low wind speed (Cheong et al., 2013) as a resting place.
Table 3.
Number of Dengue Cases by Land Cover Classification 2008-2013
| Percentage of building area | Cases | |
|---|---|---|
| No | (%) | |
| -25 % | 122 | 10,41 |
| 25,01 -50% | 527 | 44,97 |
| 50,01-75% | 440 | 37,54 |
| 75,01-100% | 83 | 7,08 |
| Total | 1172 | 100 |
Several studies have shown that the type of land cover is related to the density of mosquitoes or dengue cases. Sarfraz et al. (2012) prove that the type of land use affects the density of Aedes mosquitoes in Thailand. Settlements around horticulture relate to the house index (HI) in May (p=0.05), whereas perennial vegetation is significantly correlated with the container index (CI) (p<0.05). Vanwambeke et al. (2006) also state that the presence of trees and aquatic lands is an important factor in the incidence of DHF in Thailand. Extensive settlements affect dengue cases in urban areas (Li et al., 2014), but horticulture affects dengue in sub-urban areas (Cheong et al., 2014). The presence of vegetation around the dengue patient dwellings in this study indicates that dengue in Sleman District belongs to the sub-urban type category. The trees around the house become a factor to consider in controlling dengue disease in Sleman District.
Elevation-dengue incidence
Sleman region has a considerable different height among one area with others which affects the spread of dengue. Northern Sleman is a highland, which is along the slopes of Mount Merapi. Some reports indicate that the maximum elevation of Aedes sp. is different at different places. In Sumatra, Aedes sp. is only up to 700 m a.s.l. (Anwar et al., 2014). In Mexico City, Aedes aegypti was discovered up to 1,700 m a.s.l. (Fuentes et al., 2012). No data of the highest location has been found by Aedes in Sleman. Sleman has an area with an elevation of >1000 m a.s.l. of 1,495 ha (2.60%). Dengue cases in Sleman occurred up to 425 m a.s.l. and most cases occurred at 50-200 m a.s.l. (Figure 9).
Pearson correlation test shows that there is a negative correlation between the height of the incidence of dengue with moderate strength (p 0.000; r -0.260). This indicates that the higher the area, the lower the dengue case. According to Andrian et al. (2014), the higher the area the lower the environmental temperature but the rainfall increases. The average temperature in the highlands of Sleman (Pakem) year 2008-2013 is recorded 24°C, under optimal temperature for mosquito breeding (Mourya et al., 2004). In terms of the humidity factor, Pakem has the optimum humidity for Aedes’ life throughout the year (2008-2013) which is the lowest 72% and the highest 88%. According to Brady et al. (2013), Aedes albopictus is more tolerant to low temperatures than Aedes aegypti, so that the presence of Aedes albopictus as vector is needed to watch out for in this area.
Dengue disease is multifactorial. There are many factors that influence the incident of dengue case among others from the environmental factor, human being as host or virus as agent. The results of this study indicate that none of the environmental factors studied are prominent and closely related to dengue cases in Sleman.
Land cover and elevation factors have been shown to be related to dengue cases even though they have only weak strength. Humidity and rainfall factors affect dengue cases in different areas, with weak to moderate strength. This shows that the dengue incidence is local.
The limitations of climate data, especially temperatures and humidity, which only originate in two observation posts, are likely to cause less accurate data, especially in areas that are beyond the scope of observation. With respect to climate data that is sometimes incomplete, so data interpolation should be done which cause the data to be less accurate. The correlation between dengue incidents with environmental factors and the possible influence of the distance factor indicate that the need for spatial analysis in revealing the role of environmental factors to be more representative.
Conclusion
The spatial pattern of dengue in Sleman is clustered. No environmental factors are closely related to dengue incidence. The most prominent environmental factor associated with dengue cases is humidity, with moderate strength. Land cover, elevation, and rainfall have weak correlation with dengue cases. Temperature does not affect dengue cases. All climate parameters do not affect dengue cases in sporadic areas.
Acknowledgements
This research is supported by the Ministry of RISTEK-DIKTI (SP DIPA-23.04.1.673453/2015). We are grateful to the Health Office of Sleman district for the availability of dengue case data and patient’s address. We are grateful to BMKG of DIY Province for the availability of climate data. We are also grateful to Lufti Gita Iriani, Puji Utami and Yosi Andika for their help to process the spatial data and my students Siti Fajrini Amir, Mentari Indah Bramantyas, Mustika Noor Ramadhani, Yeni Rahma Resty, Nova Dwi Tyas Saputri, Dian Kartikasari and Musafaro Mauludi for the excellent field work.
Footnotes
Conflict of Interest: There is no conflict of interest among the authors related to the publication of this manuscript.
References
- 1.Andrian Supriadi, Marpaung P. Effect of Altitude and Slope towards the Production of Rubber (Hevea brasiliensis muell. Arg.) in The Hapesong Garden PTPN III. Online Journal of Agroecotechnology June 2014. 2014;2(3):981–989. [Google Scholar]
- 2.Anwar C, Lavita RA, Handayani D. Identification and Distribution of Aedes sp. as DHF Vector in Some Areas in South Sumatera. Majalah Kedokteran Sriwijaya April 2014. 2014;46(2):111–117. [Google Scholar]
- 3.Arrivillaga J, Barrera R. Food as a Limiting Factor for Aedes aegypti in Water-storage Containers. Journal of Vector Ecology, 2004. 2004;29(1):11–20. [PubMed] [Google Scholar]
- 4.Bergero PE, Carlos A, Ruggerio CA, Lombardo R, Schweigmann NJ, Solari HG. Dispersal of Aedes aegypti Field Study in Temperate Areas Using a Novel Method. Journal Vector Borne Disease. 2013 Sep;2013:163–170. [PubMed] [Google Scholar]
- 5.Brady OJ, Johansson MA, Guerra CA, Bhatt S, Golding N, Pigott DM, Delatte H, Grech MG, Leisnham PT, Maciel-de-Freitas R, Styer LM, Smith DL, Scott TW, Gething PW, Hay SI. Modeling Adult Aedes aegypti and Aedes albopictus Survival at Different Temperatures in Laboratory and Field Settings. Parasites and Vectors, 2013. 2013;6(351) doi: 10.1186/1756-3305-6-351. [DOI] [PMC free article] [PubMed] [Google Scholar]
- 6.Carrington LB, Armijos MV, Lambrechts L, Barker CM, Scott TW. Effects of Fluctuating Daily Temperatures at Critical Thermal Extremes on Aedes aegypti Life-History Traits. Public Library of Science One, 2013a. 2013a;8(3):e58824. doi: 10.1371/journal.pone.0058824. [DOI] [PMC free article] [PubMed] [Google Scholar]
- 7.Carrington LB, Armijos MV, Lambrechts L, Scott TW. Fluctuations at a Low Mean Temperature Accelerate Dengue Virus Transmission by Aedes aegypti. Public Library of Science Neglected Tropical Diseases. 2013b. 2013b;7(4):e2190. doi: 10.1371/journal.pntd.0002190. [DOI] [PMC free article] [PubMed] [Google Scholar]
- 8.Champion SR, Vitek CJ. Aedes aegypti and Aedes albopictus Habitat Preferences in South Texas, USA. Environmental Health Insights. 2014. 2014;8(Suppl):35–42. doi: 10.4137/EHI.S16004. [DOI] [PMC free article] [PubMed] [Google Scholar]
- 9.Cheong YL, Burkart K, Leitão PJ, Lakes T. Assessing Weather Effects on Dengue Disease in Malaysia. International Journal of Environmental Research and Public Health. 2013. 2013;10:6319–6334. doi: 10.3390/ijerph10126319. [DOI] [PMC free article] [PubMed] [Google Scholar]
- 10.Cheong Y.L, Leitão PJ, Lakes T. Assessment of Land-use Factors Associated with Dengue Cases in Malaysia Using Boosted Regression Trees. Spatial and Spatio-temporal Epidemiology. 2014. 2014;10:75–84. doi: 10.1016/j.sste.2014.05.002. [DOI] [PubMed] [Google Scholar]
- 11.Cong RG, Brady M. The Interdependence between Rainfall and Temperature: Copula Analyses. The Scientific World Journal. 2012. 2012 doi: 10.1100/2012/405675. Article ID 405675, 11 pages. [DOI] [PMC free article] [PubMed] [Google Scholar]
- 12.De Melo DPO, Scherrer LR, Eiras A.´E. Dengue Fever Occurrence and Vector Detection by Larval Survey, Ovitrap and MosquiTRAP: A Space-Time Clusters Analysis. Public Library of Science One. 2012;7(7):e42125. doi: 10.1371/journal.pone.0042125. [DOI] [PMC free article] [PubMed] [Google Scholar]
- 13.Delatte H, Desvars A, Boue´tard A, Se´verine B, Gimonneau G, Vourc'h G, Fontenille D. Blood-Feeding Behavior of Aedes albopictus a Vector of Chikungunya on La Re ´union. Vector-Borne and Zoonotic Diseases. 2010. 2009;10(3) doi: 10.1089/vbz.2009.0026. [DOI] [PubMed] [Google Scholar]
- 14.Directorate CD&EH Dept. of Health RI. Dengue Hemorrhagic Fever in Indonesia Year 1968-2009. Bulletin of Epidemiology Window. August 2010. 2010;2:1–31. [Google Scholar]
- 15.Espinosa M, Giamperetti S, Abril M, Seijo A. Vertical Transmission of Dengue Virus in Aedes aegypti Collected in Puerto Iguazú, Misiones, Argentina. The Revista do Instituto de Medicina Tropical de Sao Paulo (Journal of the Institute of Tropical Medicine of Sao Paulo) 2014. 2014;56(2):165–167. doi: 10.1590/S0036-46652014000200013. [DOI] [PMC free article] [PubMed] [Google Scholar]
- 16.Espinosa M, Weinberg D, Rotela CH, Polop F, Abril M, Scavuzzo CM. Temporal Dynamics and Spatial Patterns of Aedes aegypti Breeding Sites, in the Context of a Dengue Control Program in Tartagal (Salta Province, Argentina) Public Library of Science Neglected Tropical Diseases. 2016. 2016;10(5):e0004621. doi: 10.1371/journal.pntd.0004621. [DOI] [PMC free article] [PubMed] [Google Scholar]
- 17.Fuentes SL, Hayden MH, Rodriguez CW, Martinez CO, Santos BT, Kobylinski KC, Uejio CK, Zielinski-Gutierrez E, Monache LD, Monaghan AJ, Steinhoff DF, Eisen L. The Dengue Virus Mosquito Vector Aedes aegypti at High Elevation in Me´xico. American Journal of Tropical Medicine and Hygiene. 2012. 2012;87(5):902–909. doi: 10.4269/ajtmh.2012.12-0244. [DOI] [PMC free article] [PubMed] [Google Scholar]
- 18.Goindin D, Delannay C, Ramdini C, Gustave J, Fouque F. Parity and Longevity of Aedes aegypti According to Temperatures in Controlled Conditions and Consequences on Dengue Transmission Risks. Public Library of Science One. 2015. 2015;10(8):e0135489. doi: 10.1371/journal.pone.0135489. [DOI] [PMC free article] [PubMed] [Google Scholar]
- 19.Hardayati W, Mulyadi A. Daryono. Analysis of People Behavior towards Free Larva Number and Dengue Hemorrhagic Fever in Sub-District of Pekanbaru City, Riau. Jurnal Ilmu Lingkungan 2011. 2011;5(1):1–9. [Google Scholar]
- 20.Harrington LC, Fleisher A, Ruiz-Moreno D, Vermeylen F, Wa CV, Pouson RL, Edman JD, Clark JM, Jones JW, Kitthawee S, Scott TW. Heterogeneous Feeding Patterns of the Dengue Vector Aedes aegypti on Individual Human Hosts in Rural Thailand. Public Library of Science Neglected Tropical Diseases. 2014. 2014;8(8):e3048. doi: 10.1371/journal.pntd.0003048. [DOI] [PMC free article] [PubMed] [Google Scholar]
- 21.Hartanti MD., Suryani, Tirtadjaja IA. Dengue Virus Transovarial Transmission by Aedes aegypti. Universa Medicina. 2010. 2010;29(2):65–70. [Google Scholar]
- 22.Indriani C, Fuad A, Kusnanto H. The Spatial-Temporal Pattern of Chikungunya and Dengue Fever Epidemic in Yogyakarta Municipality During 2008. Berita Kedokteran Masyarakat. 2011. 2011;27(1):41–50. [Google Scholar]
- 23.Kalnay E, Cai M. Impact of Urbanization and Land-use Change on Climate. Nature. 2003. 2003;423:528–531. doi: 10.1038/nature01675. [DOI] [PubMed] [Google Scholar]
- 24.Karyanti MR, Uiterwaal C.S.P.M, Kusriastuti R, Hadinegoro SR, Rovers MM, Heesterbeek H, Hoes A.W, Bruijning-Verhagen P. The Changing Incidence of Dengue Haemorrhagic Fever in Indonesia: A 45-Year Registry-Based Analysis. BMC Infectious Diseases. 2014. 2014;14:412. doi: 10.1186/1471-2334-14-412. [DOI] [PMC free article] [PubMed] [Google Scholar]
- 25.Kraemer MUG, Sinka ME, Duda KA, Mylne AQN, Shearer FM, Barker CM, Moore CG, Carvalho RG, Coelho GE, Bortel WV, Hendrickx G, Schaffner F, Elyazar IRF, Teng HJ, Brady OJ, Messina JP, Pigott DM, Scott TW, Smith DL, Wint GRW, Golding N, Hay SI. The Global Distribution of the Arbovirus Vectors Aedes aegypti and Ae. albopictus. eLife. 2015. 2015;4:e08347. doi: 10.7554/eLife.08347. [DOI] [PMC free article] [PubMed] [Google Scholar]
- 26.Kesetyaningsih TW, Alislam HM, Eka F. The Density of Aedes aegypti Larva in Endemic Dengue Area in Village and City, and Its Relations with Knowledge and Behavior. Jurnal Mutiara Medika 2012 January. 2012;12(1):56–62. [Google Scholar]
- 27.Lai P, Low C, Wong M, Wong W, Chan M. Spatial Analysis of Falls in an Urban Community of Hong Kong. International Journal of Health Geographics. 2009. 2009:1–14. doi: 10.1186/1476-072X-8-14. [DOI] [PMC free article] [PubMed] [Google Scholar]
- 28.Lambrechts L, Paaijmans KP, Fansiri T, Carrington LB, Kramer LD, Thomas MB, Scott TW. Impact of Daily Temperature Fluctuations on Dengue Virus Transmission by Aedes aegypti. Proceeding of the National Academy of Sciences of the U S A 2011 May 3. 2011;108(18):7460–5. doi: 10.1073/pnas.1101377108. [DOI] [PMC free article] [PubMed] [Google Scholar]
- 29.Lee HL, Rohani A. Transovarial Transmission of Dengue Virus in Aedes aegypti and Aedes albopictus in Relation to Dengue Outbreak in an Urban Area in Malaysia. Dengue Bulletin 2005. 2005;29:106–111. [Google Scholar]
- 30.Leenders JK, van Boxel JH, Sterk G. The Effect of Single Vegetation Elements on Wind Speed and Sediment Transport in the Sahelian Zone of Burkina Faso. Earth Surface Processes and Landforms 2007. 2007;32:1454–1474. [Google Scholar]
- 31.Li Y, Kamara F, Zhou G, Puthiyakunnon S, Li C, Liu Y, Zhou Y, Yao L, Yan G, Xiao-Guang Chen XG. Urbanization Increases Aedes albopictus Larval Habitats and Accelerates Mosquito Development and Survivorship. Public Library of Science Neglected Tropical Diseases 2014. 2014;8(11):e3301. doi: 10.1371/journal.pntd.0003301. [DOI] [PMC free article] [PubMed] [Google Scholar]
- 32.Luz PM, Codeço CT, Massad E, Struchiner CJ. Uncertainties Regarding Dengue Modeling in Rio de Janeiro, Brazil. Memórias do Instituto Oswaldo Cruz. 2003. 2003;98(7):871–878. [PubMed] [Google Scholar]
- 33.Machiel-de-Frietas R. A Review on the Ecological Determinants of Aedes aegypti (Diptera: Culicidae) Vectorial Capacity. Oecologia Australis. 2010. 2010;14(3):726–736. [Google Scholar]
- 34.Mellor PS, Leake CJ. Climatic and Geographic Influences on Arboviral Infections and Vectors. Revue Scientifique et Technique (International Office of Epizootics) 2000;19:41–54. doi: 10.20506/rst.19.1.1211. [DOI] [PubMed] [Google Scholar]
- 35.Mourya DT, Yadav P, Mishra AC. Effect of Temperature Stress on Immature Stages and Susceptibility of Aedes aegypti Mosquitoes to Chikungunya Virus. American Journal of Tropical Medicine and Hygiene. 2004. 2004;70(4):346–350. [PubMed] [Google Scholar]
- 36.Naish S, Dale P, Mackenzie JS, McBride J, Mengersen K, Tong S. Spatial and Temporal Patterns of Locally-Acquired Dengue Transmission in Northern Queensland, Australia, 1993-2012. PLOS ONE. 2014a;9(4):e92524. doi: 10.1371/journal.pone.0092524. [DOI] [PMC free article] [PubMed] [Google Scholar]
- 37.Naish S, Dale P, Mackenzie JS, McBride J, Mengersen K, Tong S. Climate Change and Dengue: A Critical and Systematic Review of Quantitative Modelling Approaches. BMC Infectious Diseases 2014. 2014b;14(167):1–14. doi: 10.1186/1471-2334-14-167. [DOI] [PMC free article] [PubMed] [Google Scholar]
- 38.Nugrahaningsih M. Nadiputra, Aryanta IWR. Environmental Factor and Community Behavior Relationship with the Presence of Mosquito Larvae of Dengue Hemorrhagic Fever in the Work Area of North Kuta Health Center. Ecotrophic. 2010. 2010;5(2):93–97. [Google Scholar]
- 39.Nurhadi Respati DSS, Khotimah N. The Pace of Invasion of the Commercial Function of Agricultural Land in the Tourist Corridor of the Yogyakarta Palace –Parangtritis Beach, Province of Yogyakarta. Informasi. 2011. 2011;37(2) [Google Scholar]
- 40.Obi NI. The Influence of Vegetation on Microclimate in Hot Humid Tropical Environment-A Case of Enugu Urban. International Journal of Energy and Environmental Research. June 2014. 2014;2(2):28–38. [Google Scholar]
- 41.Ponlawat A, Harrington LC. Blood Feeding Patterns of Aedes aegypti and Aedes albopictus in Thailand. Journal of Medical Entomology. 2005;42(5):844–849. doi: 10.1093/jmedent/42.5.844. [DOI] [PubMed] [Google Scholar]
- 42.Prado GP, Maciel JS, Leite GR, Souza M.A.A. Influence of Shading and Pedestrian Traffic on the Presence of Aedes (Stegomyia) aegypti (Diptera: Culicidae) for Oviposition Microenvironments. Journal of Vector Ecology. 2017. 2017;42(1):155–160. doi: 10.1111/jvec.12250. [DOI] [PubMed] [Google Scholar]
- 43.Ramdhani S, Istiqomah EN, Ardiyanti GK. The History of Yogyakarta, an Education City. International Proceedings of Economics Development and Research Singapore journal. 2012. 2012;58(5):21–24. [Google Scholar]
- 44.Rodrigues MM, Marques G.R.A.M, Serpa LLN, Arduino MB, Voltolini JC, Barbosa GL, Andrade V.R, de Lima V.L.C. Density of Aedes aegypti and Aedes albopictus and Its Association with Number of Residents and Meteorological Variables in the Home Environment of Dengue Endemic Area, São Paulo, Brazil. Parasites and Vectors. 2015. 2015;8:115. doi: 10.1186/s13071-015-0703-y. [DOI] [PMC free article] [PubMed] [Google Scholar]
- 45.Saleeza SNR, Norma-Rashid Y, Sofian–Azirun M. Mosquitoes Larval Breeding Habitat in Urban and Suburban Areas, Peninsular Malaysia. International Journal of Biological, Biomolecular, Agricultural, Food and Biotechnological Engineering. 2011. 2011;5(10) [Google Scholar]
- 46.Sarfraz MS, Tripathi NK, Tipdecho T, Thongbu T, Kerdthong P, Souris M. Analyzing the Spatio-Temporal Relationship between Dengue Vector Larval Density and Land-use Using Factor Analysis and Spatial Ring Mapping. BMC Public Health 2012. 2012;12(853) doi: 10.1186/1471-2458-12-853. [DOI] [PMC free article] [PubMed] [Google Scholar]
- 47.Sibe A, Nawi R, Abdullah AZ. The Risk Factor of DHF in Subdistrict of Tempe, District Wajo 2009. Media Journal of Public Health (IMKM) 2010. 2010;6(4):198–203. [Google Scholar]
- 48.Tahir HMM, Yousif TA. Modeling the Effect of Urban Trees on Relative Humidity in Khartoum State. Journal of Forest Products & Industries. 2013. 2013a;2(5):20–24. [Google Scholar]
- 49.Tahir HMM, Yousif TA. Effect of Urban Trees on Wind Speed in Khartoum State. Journal of Natural Resources and Environmental Studies. 2013. 2013b;1(2):1–3. [Google Scholar]
- 50.Tokairin T. Numerical Study on the Effect of Buildings on Temperature Variation in Urban and Suburban Areas in Tokyo. Journal of the Meteorological Society of Japan. 2006;84(5 (2006)):921–937. [Google Scholar]
- 51.Umoh AA, Akpan AO, Jaco BB. Rainfall and Relative Humidity Occurrence Patterns in Uyo Metropolis, Akwa Ibom State, South- South Nigeria. IOSR Journal of Engineering 2013. 2013;3(8):27–31. [Google Scholar]
- 52.Vanwambeke SO, van Benthem BHB, Khantikul N, Burghoorn-Maas C, Panart K, Oskam L, Lambin EF, Somboon P. Multilevel Analyses of Spatial and Temporal Determinants for Dengue Infection. International Journal of Health Geographics. 2006. 2006:5. doi: 10.1186/1476-072X-5-5. [DOI] [PMC free article] [PubMed] [Google Scholar]
- 53.Wieczorek WF, Delmerico AM. Geographic Information Systems. Computational Statistics. 2009. 2009;1(2):167–186. doi: 10.1002/wics.21. [DOI] [PMC free article] [PubMed] [Google Scholar]
- 54.Wirayoga MA. Relation of Dengue Hemorrhagic Fever and Climate in Semarang City during 2006-2011. Unnes Journal of Public Health. 2013. 2013;2(4):1–9. [Google Scholar]
- 55.Wong NH, Peck TT. The Impact of Vegetation on the Environmental Conditions of Housing Estates in Singapore. International Journal on Architectural Science. 2005. 2005;6(1):31–37. [Google Scholar]


