

SUMMARY
Hunger and pain are two competing signals that individuals must resolve to ensure survival. However, the neural processes that prioritize conflicting survival needs are poorly understood. We discovered that hunger attenuates behavioral responses and affective properties of inflammatory pain without altering acute nociceptive responses. This effect is centrally controlled, as activity in hunger-sensitive Agouti-Related Protein (AgRP)-expressing neurons abrogates inflammatory pain. Systematic analysis of AgRP projection subpopulations revealed that the neural processing of hunger and inflammatory pain converge in the hindbrain parabrachial nucleus (PBN). Strikingly, activity in AgRP→PBN neurons blocked the behavioral response to inflammatory pain as effectively as hunger or analgesics. The anti-nociceptive effect of hunger is mediated by Neuropeptide Y (NPY) signaling in the PBN. By investigating the intersection between hunger and pain, we have identified a neural circuit that mediates competing survival needs and uncovered NPY Y1 receptor signaling in the PBN as a target for pain suppression.
In Brief
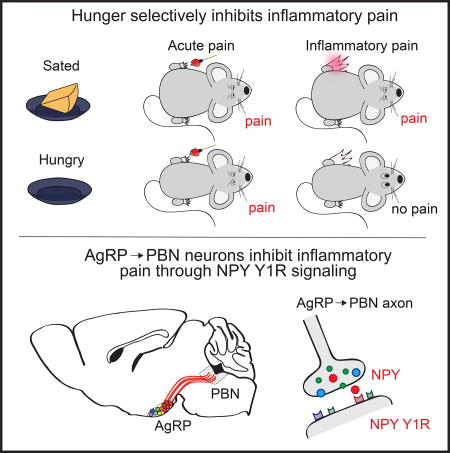
Hunger suppresses responses to pain through an AgRP/NPY circuit.
INTRODUCTION
Survival depends on fulfilling salient needs in a changing environment. Formative behavioral observations highlighted the remarkable ability of individuals across species to adaptively respond to dynamic physiological and environmental challenges (Pavlov and Folʹbort, 1926; Tinbergen, 1951). Given these insights, it is surprising that the neural and molecular mechanisms governing the prioritization of adaptive behaviors remain elusive. While great strides have been made in understanding how individual need states such as hunger, thirst, fear and pain are signaled in the brain, relatively little is known about how the brain prioritizes such needs.
Pain is a natural response to injury, but long-term inflammation and associated pain can be maladaptive. While acute pain is reflexive in that it is triggered by activation of primary sensory neurons (i.e. nociceptors) in the periphery, inflammatory pain is mediated at least in part by central mechanisms (Coderre et al., 1990). From this perspective, targeting central nociceptive pathways may be an effective way to selectively reduce inflammatory pain while leaving intact adaptive responses to acute pain. Because persistent pain remains a major public health burden that is not well-controlled by current analgesics (Loeser, 2012), identifying endogenous mechanisms that specifically reduce the inflammatory response to injury may provide strategies for the design of effective pain therapies.
As a unique approach to identify neural circuits that regulate pain, we sought to explore competing need states that affect nociception. The response to pain is typically an adaptive mechanism that protects organisms against dangerous stimuli. However, as other physiological needs such as hunger increase, behavior must shift from avoiding bodily injury to fulfilling other immediate needs. Interactions between competing needs states have been reported; for example, acute stressors such as inescapable footshock, cold-water swims, or caloric deprivation can produce short-term analgesia (Bodnar et al., 1977; Bodnar et al., 1978b; Hamm and Lyeth, 1984; Hargraves and Hentall, 2005; LaGraize et al., 2004). Additionally, hunger has been shown to influence adaptive behavioral responses to fear and anxiety (Burnett et al., 2016; Jikomes et al., 2016; Padilla et al., 2016). We reasoned that individuals must prioritize the most acute threat to survival and behave accordingly. To explore the behavioral, neural, and molecular mechanisms that rank survival needs, we examined the bidirectional interaction between hunger and different modalities of pain.
Here, we found that hunger selectively inhibits both the behavioral response and affective properties of inflammatory pain. Since neurons responsive to hunger are well-characterized (Sternson and Eiselt, 2017), they provide an entry point to examine the neural circuit intersection of hunger and pain. We discovered that hypothalamic agouti-related protein-(AgRP) expressing neurons that project to the hindbrain parabrachial nucleus (PBN) selectively inhibit responses to inflammatory pain. The analgesic effect of hunger on inflammatory pain is mediated by neuropeptide Y (NPY) signaling on NPY Y1 receptors in the PBN. We further show that acute thermal, but not inflammatory, pain inhibits the activity of AgRP neurons, demonstrating that central mechanisms prioritize the most salient threat. Taken together, our data demonstrate that AgRP neurons mediate the interaction between hunger and pain and have uncovered PBN NPY Y1 receptor signaling as a target for analgesia.
Results
Hunger Selectively Attenuates Responses to Inflammatory Pain
To understand how competing survival signals are prioritized, we first explored how 24 h food deprivation influences the behavioral response to pain induced by either chemical (formalin), thermal (52°C hotplate) or mechanical (Von Frey filament) insults (Figure 1A, 1H, and 1J) (Bodnar, 1978; Hamm and Lyeth, 1984; Hargraves and Hentall, 2005; LaGraize et al., 2004). Formalin paw injection is a reliable and widely used model of nociception with high face validity when tested with analgesic drugs (Hunskaar and Hole, 1987). Formalin induces distinct acute (0–5 min) and long-term inflammatory (15–45 min) phases of pain (Dubuisson and Dennis, 1977), while responses to a hotplate or Von Frey filaments are acute and transient. We discovered that 24 h food deprivation attenuated the duration (Figure 1B–1D) and frequency (Figure 1E) of inflammatory phase paw licking after injection of a noxious chemical stimulus, similar to the effect of an anti-inflammatory painkiller (Hunskaar and Hole, 1987) (Figure S1A–S1E). Conversely, food deprivation had no effect on the acute phase response to formalin injection (Figure 1F and 1G) or the response to acute thermal (Figure 1H and 1I) or mechanical (Figure 1J and 1K) pain, unlike an opioid painkiller (Figure S1F–S1H).
Figure 1. Hunger Attenuates Response to Inflammatory Pain.

(A) Experimental design (formalin test): paw injection of 2% formalin was administered at 0 min; time spent licking paw was measured for 60 min and quantified during the acute phase (0–5 min) and the inflammatory phase (15–45 min). (B) Time spent licking paw following formalin injection displayed in 5 min time bins in ad libitum fed (n=6) and 24 h food deprived (n=6) mice (two-way repeated measures ANOVA, p<0.001). (C) % time spent paw licking during acute and inflammatory phases of formalin test (two-way repeated measures ANOVA, p<0.05). (D) Time spent paw licking during the inflammatory phase of formalin test in ad libitum fed and 24 h food deprived mice (unpaired t-test, p<0.001). (E) Lick bouts during the inflammatory phase of formalin test in ad libitum fed and 24 h food deprived mice (unpaired t-test, p<0.01). (F) Time spent paw licking during the acute phase of formalin test in ad libitum fed and 24 h food deprived mice (unpaired t-test, p=ns). (G) Lick bouts during the acute phase of formalin test in ad libitum fed and 24 h food deprived mice (unpaired t-test, p=ns). (H) Experimental design (hotplate test): Latency to withdraw paw from 52°C hotplate was measured. (I) Latency to withdraw paw in ad libitum fed (n=12) versus 24 h food deprived (n=14) mice during hotplate test (unpaired t-test, p=ns). (J) Experimental design (Von Frey): Paw withdrawal from Von Frey filaments was measured. (K) Withdrawal threshold (Von Frey filament at which mouse responded to >50% of trials) in ad libitum fed (n=11) versus 24 h food deprived (n=7) mice (unpaired t-test, p=ns). Data are expressed as mean ± SEM, ns p>0.05, t-tests and post-hoc comparisons: *p<0.05, **p<0.01, ***p<0.001; ANOVA interaction: ∞p<0.05, ∞∞∞p<0.001; ANOVA main effect of group: ☼☼p<0.01.
These data demonstrate that hunger selectively blocks inflammatory phase pain responses.
To determine whether hunger influences inflammation-induced sensitization to different modalities of pain, we next induced a persistent inflammatory response in the paw via injection of Complete Freud’s Adjuvant (CFA) (Marchand et al., 2005). After paw injection of CFA, mice exhibit sensitization to both mechanical (Figure 2A, 2B, and 2E) and thermal (Figure 2G and 2H) stimuli. The sensitization to both of these stimuli is abolished in food restricted mice (Figure 2C, 2D, 2F and 2I), suggesting that hunger reduces inflammation-induced sensitization to thermal and mechanical pain. Taken together, these data suggest that hunger is a powerful suppressant of inflammatory pain response.
Figure 2. Hunger Attenuates Inflammation-Induced Sensitization to Mechanical and Thermal Pain.

(A) Experimental design [Complete Freund’s Adjuvant (CFA) and Von Frey Test]: CFA was injected in the plantar surface of the hindpaw after a baseline Von Frey test. Mice were subjected again to a Von Frey test 3 h, 24 h, and 48 h post-CFA injection. (B) Withdrawal threshold (Von Frey filament at which mouse responded to >50% of trials) in ad libitum fed mice (n=11) before and 24 h post-CFA injection (paired t-test, p<0.01). (C) Withdrawal threshold in food restricted mice (n=7) before and 24 h post-CFA injection (paired ttest, p=ns). (D) Withdrawal threshold in ad libitum fed (n=11) and food restricted mice (n=7) before and 24 h post-CFA injection (two-way repeated measures ANOVA, p<0.05). (E) Percentage withdrawal from Von Frey filaments before and 3 h, 24 h, and 48 h post-CFA injection in ad libitum fed mice (n=11, two-way repeated measures ANOVA, p<0.001). (F) Percentage withdrawal from Von Frey filaments before and 3 h, 24 h, and 48 h post-CFA injection in food restricted mice (n=7, two-way repeated measures ANOVA, p=ns). (G) Experimental design (CFA and hotplate test): mice were injected with CFA after a baseline hotplate test. Mice were subjected again to a hotplate test 3 h, 24 h, and 48 h post-CFA injection. (H) Latency to paw withdrawal from hotplate in ad libitum fed mice (n=5) before and 48 h post-CFA injection (paired t-test, p<0.05). (I) Latency to paw withdrawal from hotplate in food restricted mice (n=10) before and 48 h post-CFA injection (paired t-test, p=ns). Data are expressed as mean ± SEM, ns p>0.05, t-tests and post-hoc comparisons: *p<0.05, **p<0.01, ***p<0.001; ANOVA interaction: ∞p<0.05, ∞∞∞p<0.001; ANOVA main effect of drug: ☼☼p<0.01, ☼☼☼p<0.001.
Pain results in both behavioral responses as well as negative affect, the latter of which has been modeled in rodents using classic conditioning paradigms (Deyama et al., 2007; Johansen and Fields, 2004). We first investigated how hunger influences the affective properties of pain by examining whether hunger attenuates a condition placed avoidance normally associated with inflammatory pain (Figure 3A). We found that ad libitum fed mice exhibited a conditioned place avoidance of cues previously paired with formalin-induced inflammatory pain (Figure 3B–3D). This post-conditioning avoidance was abolished in animals that were food restricted during conditioning (Figure 3B–3D), a result that was independent of changes in locomotor activity (Figure 3E and 3F). This result is not likely due to a hunger-induced deficit in associative learning, given that food restricted mice learn to avoid contexts associated with other aversive stimuli as effectively as ad libitum fed mice (Figure 3G). Similar to the attenuation of a formalin conditioned place avoidance, we found that hunger also attenuated formalin-induced immobility (Figure 3H). Together, these data suggest that hunger attenuates measures of pain-induced negative affect, in addition to behavioral responses to inflammatory pain.
Figure 3. Hunger Attenuates Negative Affective Components of Pain.

(A) Experimental design [conditioned place avoidance (CPA)]: one side of a two-sided chamber was paired with the inflammatory phase following formalin paw injection in either ad libitum fed or food restricted mice for 4 days and the post-conditioning preference was measured in replete animals. (B) Representative traces of locations of mice following formalin CPA. (C) Preference for formalinpaired side before and after conditioning in ad libitum fed (n=9) and food restricted (n=7) mice (two-way repeated measures ANOVA, p<0.05). (D) Shift in preference for formalin-paired side in ad libitum fed and food restricted mice (unpaired t-test, p<0.05). (E, F) Mice in ad libitum fed (n=9) and food restricted (n=7) groups exhibit similar locomotor activity both before (E) and after (F) CPA to inflammatory phase pain (unpaired t-tests, ps=ns). (G) Shift in preference for lithium chloride-paired side in ad libitum fed and food restricted mice (unpaired t-test, p=ns). (H) Time spent immobile in ad libitum fed and 24 h food deprived mice during inflammatory phase following formalin injection (n=7–10/group, two-way ANOVA, p<0.05). Data are expressed as mean ± SEM, ns p>0.05, t-tests and post-hoc comparisons: *p<0.05, **p<0.01; ANOVA interaction: ∞p<0.05.
AgRP Neurons Specifically Inhibit Inflammatory Pain
Formalin paw injection leads to paw inflammation in food deprived mice (Figure S1I and S1J), suggesting central mechanisms may mediate the interaction between hunger and inflammatory pain. Neural circuits activated by hunger are well-characterized (Sternson and Eiselt, 2017). In particular, neurons that co-express agouti-related protein (AgRP), gamma-aminobutyric acid (GABA), and Neuropeptide Y (NPY) (referred to as AgRP neurons) are critical regulators of food intake (Luquet et al., 2005). AgRP neuron inhibition in hungry mice reduces food intake (Krashes et al., 2011), while activation of AgRP neurons in sated mice robustly increases food intake (Aponte et al., 2011; Krashes et al., 2011). Photostimulation of mice expressing channelrhodopsin-2 (ChR2) in AgRP neurons (AgRPChR2) dramatically reduced both formalin-induced inflammatory phase pain responses (Figure 4A–4D; Figure S2A–S2C) and CFA-induced nociceptive sensitization (Figure 4E and 4F; Figure S2F–S2H) relative to responses of GFP-expressing control mice (AgRPGFP). This effect was specific to inflammatory pain as activating AgRP neurons did not influence acute phase chemical or thermal pain responses (Figure S2D, S2E, S2I, and S2J) nor responses to control saline paw injections (Figure S2K–S2M). Initiating AgRP neuron stimulation during an ongoing pain response inhibited paw licking within minutes (Figure 4G and 4H). This indicates that AgRP neuron activity rapidly mediates a behavioral switch, and does not rely on long-term activity of AgRP neurons that may entrain a single behavioral state. To test whether AgRP neuron activity is sufficient to suppress inflammatory pain, we chemogenetically inhibited AgRP neurons during hunger. Food deprived mice expressing inhibitory Designer Receptors Exclusively Activated by Designer Drugs (DREADDs, hM4D) in AgRP neurons (AgRPhM4D+) significantly reduce food intake relative to littermate controls (AgRPhM4D−) following injection of the designer ligand clozapine-N-oxide (CNO, Figure 4I), as previously described (Krashes et al., 2011). Inhibition of AgRP neurons significantly reduced the protective effect of hunger on inflammatory pain (Figure 4J–4L). Thus, AgRP neuron activity during hunger is both necessary and sufficient to suppress inflammatory pain responses without affecting acute pain responses, recapitulating the behavioral interaction observed in hunger and identifying a neural mechanism for the suppression of inflammatory pain.
Figure 4. AgRP Neurons Mediate Suppression of Inflammatory Pain.

(A) Schematic and representative image of ChR2 in AgRP-IRES-Cre mice implanted with an optical fiber (white dashed line indicates fiber track) above the ARC. Scale bar, 1 mm. (B) Top, experimental design: 450 nm light pulse delivery began 10 min before formalin administration and continued for the duration of the formalin test. Bottom, graph: Time spent paw licking in AgRPGFP (n=12) and AgRPChR2 (n=12) mice following formalin administration (two-way repeated measures ANOVA, p<0.001) (C) Inflammatory phase formalin-induced paw licking (time) in AgRPGFP and AgRPChR2 mice (unpaired t-test, p<0.01) (D) Time spent licking paw during inflammatory phase following saline or formalin injection in AgRPGFP and AgRPChR2 mice (two-way repeated measures ANOVA, p<0.001). (E) Withdrawal threshold (Von Frey filament at which mouse responded to >50% of trials) in AgRPGFP mice (n=6) before and 24 h post-CFA injection (paired t-test, p<0.05) (F) Withdrawal threshold in AgRPChR2 mice (n=9) before and 24 h post-CFA injection (paired t-test, p=ns) (G) Top, experimental design: 450 nm light pulses were delivered beginning 25 min post-formalin injection and lasting through the duration of the session. Bottom, graph: time spent paw licking in AgRPGFP (n=6) and AgRPChR2 (n=6) mice [two-way repeated measures ANOVA, main effect of stimulation (AgRPGFP vs. AgRPChR2), p<0.05]. (H) Inflammatory phase formalin-induced paw licking (time) during laser stimulation (25–45 min) in AgRPGFP and AgRPChR2 mice (unpaired t-test, p<0.05). (I) Food intake in food deprived AgRPhM4D− (n=9) and AgRPhM4D+ (n=4) mice 4 h following CNO injection (unpaired t-test, p<0.01). (J) Time spent paw licking in AgRPhM4D− (n=20) and AgRPhM4D+ (n=8) mice following formalin injection (two-way repeated measures ANOVA, p<0.05). (K) Inflammatory phase formalin-induced paw licking (time) in AgRPhM4D− and AgRPhM4D+ mice (unpaired t-test, p<0.01). (L) Acute phase formalin-induced paw licking (time) in AgRPhM4D− and AgRPhM4D+ mice (unpaired t-test, p=ns). Data are expressed as mean ± SEM, ns p>0.05, t-tests and post-hoc comparisons: *p<0.05, **p<0.01, ***p<0.001; ANOVA interaction: ∞p<0.05, ∞∞∞p<0.001; ANOVA main effect of group: ☼p<0.05, ☼☼p<0.01.
AgRP→PBN Neurons Specifically Inhibit Inflammatory Pain
Given that hunger suppresses longer-term inflammatory pain responses, we next sought to identify brain regions where hunger and nociceptive information converge. Several brain regions innervated by AgRP neurons are also activated by formalin paw injection and implicated in nociception (Baulmann et al., 2000). To explore potential brain regions targeted by AgRP neurons that mediate inflammatory pain, we performed a formalin paw injection in ad libitum fed mice and quantified neurons directly under AgRP axons that expressed the immediate early gene Fos. The number of neurons expressing Fos protein was increased in the terminal projection fields of several AgRP neuron target regions following formalin paw injection compared to mice who received saline or no injection (Figure 5A and 5B; Figure S3A).
Figure 5. AgRP→PBN Neuron Activity Suppresses Inflammatory Pain.

(A) Immediate early gene protein expression analysis was performed to detect changes in neural activity in AgRP neuron target regions following formalin paw injection. Fos+ neurons in each target region (PVH depicted here) were quantified per unilateral brain section under the area of dense AgRP axonal projections (red, outlined by white dashed line). Scale bar, 150 µm. Graph depicts quantification of Fos+ neurons in the PVH under AgRP axons following no treatment (n), saline paw injection (s), or formalin paw injection (f). (B) Representative images and graphs depicting quantification of Fos+ neurons under AgRP axons following no treatment (n), saline paw injection (s), or formalin paw injection (f) (n=9, 2–4 images per mouse per target region, one-way ANOVA within brain region, p<0.05 for BNST, CeA, PAG, PBN). Scale bar, 150 µm. (C) Diagram of the major AgRP neuron projection subpopulations analyzed. Delivery of light to individual axon target fields of AgRP neurons (BNST shown here) allows for selective activation of discrete AgRP neuron projection subpopulations. (D) Time spent paw licking following formalin injection during optogenetic stimulation of AgRP neuron projection subpopulations (n=9–12/target region, twoway repeated measures ANOVA, p<0.01). (E) Inflammatory phase formalin-induced paw licking (time) with (+, colored boxes) and without (−, grey boxes) AgRP neuron stimulation of discrete projection subpopulations (paired t-tests with Bonferroni correction, all ps=ns except for PBN, p<0.001). (F) Acute phase formalin-induced paw licking (time) with (colored boxes) and without (grey boxes) AgRP neuron stimulation of discrete projection subpopulations (paired t-tests with Bonferroni correction, all ps=ns). (G) Latency to paw withdrawal from 52°C hotplate in AgRP→PBNChR2 mice (n=12, one-way ANOVA, p=ns). Data are expressed as mean ± SEM, ns p>0.05, t-tests and post-hoc comparisons: *p<0.05, **p<0.01, ***p<0.001; ANOVA interaction: ∞∞p<0.01; ANOVA main effect of group: ☼☼☼p<0.001.
Because the anatomical data suggested that multiple AgRP target regions may be involved in the transmission of inflammatory pain, we performed a systematic analysis of the function of each AgRP neuron projection subpopulation. Taking advantage of the one-to-one architecture of AgRP neuron projections (Figure S3C) (Betley et al., 2013), we activated individual AgRP projection subpopulations in ad libitum fed mice and assessed behavioral responses to acute and inflammatory formalin-induced pain (Figure 5C; Figure S3B). Although AgRP subpopulations that project to the bed nuclei of the stria terminals (BNST), paraventricular thalamic nucleus (PVT), paraventricular hypothalamic nucleus (PVH), and the lateral hypothalamus (LH) are sufficient to evoke food intake (Figure S3D) (Betley et al., 2013), we found that optogenetic activation of each of these discrete subpopulations does not reduce the behavioral response to acute or inflammatory formalin-induced pain (Figure 5D–5F; Figure S3E). Other AgRP projection subpopulations, such as those that project to the periaqueductal grey (PAG), central nucleus of the amygdala (CeA), and parabrachial nucleus (PBN) are not sufficient to drive food intake when stimulated (Figure S3D) (Betley et al., 2013), raising the hypothesis that these populations are involved in more nuanced aspects of feeding, such as the ability to suppress pain to facilitate food-seeking behavior. We found that activation of AgRP projections to the PBN virtually eliminates inflammatory phase pain responses (Figure 5D and 5E; Figure S3E) without affecting responses to acute chemical (Figure 5F) or thermal (Figure 5G) pain. The suppression of inflammatory pain by AgRP→PBN stimulation is not likely due to off target effects since prolonged stimulation does not reduce the acute response to formalin-induced pain (Figure S3F) or locomotor activity (Figure S3G and S3H). Activating AgRP neurons that project to the CeA or the PAG had no effect on acute or inflammatory phase pain (Figure 5D–5F) nor did the delivery of light to AgRPGFP→PBN mice (Figure S3I–S3K). This striking specificity of AgRP→PBN neuron function demonstrates that the PBN is a neural substrate for the interaction between hunger and inflammatory pain.
NPY Signaling in the lateral PBN Inhibits Inflammatory Pain
To explore how AgRP→PBN signaling intersects with the neural representation of inflammatory pain, we first examined the anatomical overlap of AgRP projections and neurons activated by inflammatory pain. We find a dense AgRP axonal projection in the lateral PBN (lPBN) and a more medial projection to the locus coeruleus area (Figure 6A). AgRP axons projecting to the lPBN overlap with neurons activated by formalin paw injection (Figure S4A), suggesting the activity in AgRP neurons projecting to the lPBN mediates inflammatory pain.
Figure 6. Lateral PBN NPY Signaling Suppresses Inflammatory Pain.

(A) Representative image of AgRP fibers terminating in the lateral PBN (lPBN) and locus coeruleus area. LC, locus coeruleus; lPBN, lateral PBN; scp, superior cerebellar peduncle. Scale bar, 500 µm. (B) Representative images of NPY (red), GAD65 (green) and AgRP (blue) immunofluorescence in AgRP→lPBN neuron boutons of ad libitum fed and 24 h food deprived mice. Scale bar, 5 µm. (C) Average intensity of NPY, GAD65, and AgRP immunofluorescence in 24 h food deprived mice (n=3 mice, 256 boutons) relative to ad libitum fed controls (n=2 mice, 366 boutons) (unpaired t-tests, ps<0.001). (D) Experimental design: lPBN microinjections were performed immediately before formalin paw injection. (E) Formalin-induced paw licking (time) in lPBN vehicle-, NPY-, GABA agonists-, and AgRP analogue-microinjected mice (n=6–8/group, two-way ANOVA, main effect of drug p<0.01). Post-hoc comparisons: *p<0.05 vehicle vs. NPY; Φp<0.05 NPY vs. AgRP analogue. (F) Inflammatory phase formalin-induced paw licking (time) in lPBN vehicle- and NPY-microinjected mice (unpaired t-test, p<0.01). (G) Acute phase formalin-induced paw licking (time) in lPBN vehicle- and NPY-microinjected mice (unpaired t-test, p=ns). (H) Formalin-induced paw licking (time) in lPBN vehicle-, Y1 receptor (Y1R) antagonist-, and GABA receptor antagonist-microinjected mice (n=6–7/group, two-way repeated measures ANOVA, p<0.001). (I) Inflammatory phase formalin-induced paw licking (time) in lPBN vehicle-and Y1R antagonist-microinjected mice (unpaired t-test, p<0.05). (J) Formalin-induced paw licking (time) in lPBN vehicle- and Y1 receptor (Y1R) antagonist-microinjected mice with AgRP→PBN neuron stimulation (n=6, two-way repeated measures ANOVA, p<0.01). (K) Inflammatory phase formalin-induced paw licking (time) in lPBN vehicle- and Y1R antagonist-microinjected mice with AgRP→PBN neuron stimulation (unpaired t-test, p<0.05). Data are expressed as mean ± SEM, ns p>0.05, t-tests and post-hoc comparisons: *p<0.05, **p<0.01, ***p<0.001; ANOVA interaction: ∞∞p<0.01, ∞∞∞p<0.001; ANOVA main effect of drug: ☼p<0.05, ☼☼p<0.01, ☼☼☼p<0.001.
Because AgRP neuron activity is both necessary and sufficient to provide a protective effect against inflammatory pain during hunger (Figure 4), we next sought to determine the molecular signals in the PBN that mediate the suppression of pain during hunger. We first explored protein expression of the 3 main neurotransmitters of AgRP neurons: NPY, GABA, and AgRP. Expression of both NPY and the GABA synthetic enzyme GAD65 were increased in axon terminals of AgRP→lPBN neurons during hunger (Figure 6B and 6C), suggesting these molecules may mediate the interaction between hunger and pain in the lPBN. To test the functional relevance of these neurotransmitters, we performed microinjections of each neurotransmitter into the lPBN immediately before formalin paw injection. NPY signaling in the lPBN robustly and selectively attenuated inflammatory phase pain responses, without affecting acute pain responses or food intake (Figure 6D–6G, Figure S4B). Conversely, neither GABA nor AgRP signaling in the lPBN (Figure 6E), nor NPY in the locus coeruleus area (Figure S4C–S4F), had any effect on formalin-induced pain responses. Consistent with the kinetics of NPY signaling on behavior (Stanley and Leibowitz, 1985), the onset (Figure S4G and S4I) and offset (Figure S4H and S4I) of AgRP→PBN neuron activity during an ongoing inflammatory phase pain response triggered changes in nocifensive behavior within minutes.
To determine if NPY signaling in the lPBN functions in a physiologically relevant manner, we next assessed the role of endogenous NPY signaling during hunger. Strikingly, blocking NPY Y1 receptors (Atasoy et al., 2012) in the lPBN of food deprived mice reversed the analgesic effects of hunger (Figure 6H–6I) while antagonism of GABA receptors did not affect inflammatory pain (Figure 6H). Furthermore, blockade of Y1 receptors in the lPBN attenuated the suppression of inflammatory pain by AgRP→PBN neuron stimulation (Figure 6J and 6K), suggesting that AgRP neurons are the source of the analgesic NPY. This reduction in pain is likely mediated by glutamatergic neurons in the lPBN as inhibiting VGlut2-expressing, but not Gad2-expressing, neurons in the lPBN during the formalin assay reduced inflammatory pain (Figure S5). Taken together, these data demonstrate that lPBN NPY signaling is both necessary and sufficient for the suppression of inflammatory pain.
Acute Pain Reduces Food Seeking and Neural Activity in Hunger Circuits
Survival requires ranking and responding to the most critical need at a given time. Because hunger does not suppress the response to acute pain, we reasoned that neural mechanisms may exist to deprioritize hunger during threats to survival such as acute pain. Exposure to a 52°C hotplate increased the latency to feed in 24 h food deprived mice (Figure 7A). However, no change in food intake in hungry mice during inflammatory pain was observed (Figure 7B). To gain insight into the mechanisms through which acute pain inhibits feeding behavior, we next measured in vivo calcium dynamics in AgRP neurons as a proxy for neural activity (Figure 7C) (Gunaydin et al., 2014). Chow presentation significantly reduced the activity of AgRP neurons in hungry mice (Figure S7A and S7B), as previously reported (Betley et al., 2015; Chen et al., 2015; Mandelblat-Cerf et al., 2015). Consistent with the effects of pain on food intake, acute thermal pain, but not formalin injection, reduced the activity of AgRP neurons (Figure 7D–7G, Figure S7C and S7D). This suppression of AgRP neuron activity by acute thermal pain reached a magnitude comparable to ~50% of the suppression observed upon refeeding hungry mice (Figure S7E). Together, these data suggest that acute thermal pain can influence behavior by suppressing activity in AgRP neuron circuits.
Figure 7. Acute Pain Inhibits Feeding Behavior and Activity in AgRP Neurons.

(A) Left, experimental design: latency to feed (first bite) was measured following 60 s exposure to a 52°C hotplate. Right, graph: latency to feed after 60 s exposure to either a 25°C or 52°C plate (n=8, paired t-test, p<0.01). (B) Left, experimental design: 1 h food intake was measured after formalin paw injection. Right, graph: 1 h food intake in food deprived mice after paw injection of saline or formalin (n=21, paired t-test, p=ns). (C) Left, schematic and representative image of expression of the calcium indicator GCaMP6s in AgRP neurons. Scale bar, 500 µm. Right, configuration for monitoring calcium dynamics in vivo using GCaMP6s expressed in AgRP neurons. The 490 nm excitation activates the calcium-dependent GCaMP6s signal and the 405 nm excitation activates the calcium-independent (isosbestic) GCaMP6s fluorescence. (D) Calcium-dependent (mean, dark green; SEM, green shading) and calcium-independent (mean, dark purple; SEM, purple shading) change in fluorescence (ΔF/F) in AgRP neurons following exposure to 25°C or 52°C plate (n=10). Grey shaded region indicates time exposed to hotplate. (E) Quantification of change in fluorescence (30 s time bins) in mice following exposure to 25°C or 52°C plate (n=10, two-way repeated measures ANOVA, p<0.01). (F) Calcium-dependent (mean, dark green; SEM, green shading) and calcium-independent (mean, dark purple; SEM, purple shading) change in fluorescence (ΔF/F) in AgRP neurons following saline or formalin paw injection (n=8). Dashed line indicates time of paw injection. (G) Quantification of change in fluorescence (6 min time bins) in mice following saline or formalin paw injection (n=8, two-way repeated measures ANOVA, p=ns). Data are expressed as mean ± SEM, ns p>0.05, t-tests and post-hoc comparisons: **p<0.01, ***p<0.001; ANOVA interaction: ∞∞p<0.01; ANOVA main effect of group: ☼p<0.05.
DISCUSSION
Here, we discovered a bidirectional interaction between hunger and pain and revealed a neural mechanism that processes competing survival signals. We demonstrated that hunger selectively attenuates the behavioral and affective responses to inflammatory pain. This effect is centrally mediated by a small subset of AgRP neurons that project to the PBN. The suppression of inflammatory pain by hunger requires NPY signaling through Y1 receptors. Conversely, acute but not inflammatory pain inhibited feeding behavior and reduced the endogenous activity of AgRP neurons during hunger. These findings demonstrate the utility of examining intersecting survival needs to reveal neural circuits that influence behavior, as we have identified a mechanism for the inhibition of inflammatory pain.
Bidirectional Behavioral Interaction Between Hunger and Pain
It has been demonstrated that hunger can both increase and decrease responses to pain (Bodnar, 1978; Hamm and Lyeth, 1984; Hargraves and Hentall, 2005; LaGraize et al., 2004; Pollatos et al., 2012), suggesting that these two broadly tuned survival signals may interact in a hierarchical manner. We found that 24 h food deprivation consistently and dramatically attenuates responses to inflammatory pain, but has no effect on thermal pain, mechanical pain or the acute response to formalin paw injection. In comparison to previous studies, we observed two striking results. First, hunger had no effect on acute pain resulting from thermal, mechanical or chemical insult. While previous reports demonstrate that hunger modestly reduces (10–20%) acute pain (Bodnar et al., 1978a; Hamm and Lyeth, 1984; Hargraves and Hentall, 2005), the majority of the acute pain responses are left intact – an important ethological consideration to enhance survival. Second, we found that hunger selectively and almost completely abolished inflammatory pain responses, mimicking the effects of anti-inflammatory painkillers. This profound suppression, even without the distractor of food, suggests an analgesic effect of hunger and provides a behavioral mechanism to facilitate food seeking following an injury. Taken together, our observations demonstrate that hunger has the ability to selectively inhibit long-term pain responses while leaving intact the adaptive ability to respond to acutely painful stimuli.
The robust suppression of inflammatory pain response by food deprivation prompted us to explore how hunger affects other dimensions of pain. Pain induces negative emotional responses, and it is thought that distinct neural systems regulate the sensory and affective components of pain (Johansen and Fields, 2004). Given that hunger is a complex motivational state that involves coordination of many distinct neural circuits (Andermann and Lowell, 2017; Grill, 2006), it is not surprising that hunger can interface with both the sensory and affective components of pain. Indeed, the affective components of pain were diminished by hunger, as hunger attenuated a place avoidance of cues previously associated with inflammatory pain. The ability of hunger to inhibit both the unpleasant aspects of pain in addition to behavioral responses to pain suggests an analgesic effect of hunger. These findings have implications not only for the treatment of pain disorders, but also for the treatment of affective disorders such as depression that are highly comorbid with conditions of chronic pain (Miller and Cano, 2009; Price, 2000).
Hunger attenuated inflammatory but not acute pain, but only acute pain was capable of inhibiting feeding behavior. Furthermore, acute thermal pain directly inhibited the activity of hunger-sensitive AgRP neurons, suggesting that pain is not simply a distractor from hunger. The transient reduction in AgRP neuron activity is consistent with our observation of short- but not long-term reductions in feeding behavior following painful stimuli. While other studies have reported robust reductions in endogenous AgRP neuron activity by food (Betley et al., 2015; Chen et al., 2015; Mandelblat-Cerf et al., 2015), our findings unexpectedly provide a feeding-independent mechanism that inhibits this neural population.
Together, our data show that acute pain inhibits hunger, and that hunger inhibits inflammatory pain. This hierarchical interaction between hunger and different modalities of pain suggests a prioritization of survival needs, whereby behavior addresses the most urgent environmental or physiological stimulus. Together, these observations are ethologically sound for survival, as they describe a system that reliably responds to acute threat but allows for the suppression of longer-term pain when food seeking behavior is paramount for survival.
Neural and Molecular Mechanisms for the Inhibition of Pain
Activation of AgRP neurons suppressed inflammatory pain, revealing a common neural substrate for circuits that mediate hunger and pain. It is well established that AgRP neuron signaling influences complex behaviors that promote food seeking (Burnett et al., 2016; Dietrich et al., 2015; Krashes et al., 2011; Padilla et al., 2016). The ability of AgRP neuron activity to robustly inhibit inflammatory pain was surprising because analgesia is not an obvious priority for food seeking. However, facilitating feeding behavior following injury likely requires hard-wired neural circuitry to overcome obstacles such as pain. Interestingly, the AgRP neural network, which is composed of parallel projections that do not all drive food intake (Betley et al., 2013), provides an anatomical arrangement that allows distinct projections to inhibit neural processing of environmental signals that impede feeding.
To unravel the AgRP circuitry that inhibits inflammatory pain, we performed a systematic functional assessment of AgRP neuron subpopulations that revealed the striking specificity by which a tiny population of neurons can initiate behavioral switching. Indeed, activity in only ~300 AgRP neurons that project to the PBN (Betley et al., 2013) specifically eliminated inflammatory pain. The magnitude of suppression of inflammatory pain was comparable to morphine and was more robust than most anti-inflammatory or steroid analgesics (Hunskaar and Hole, 1987). Given that activity in AgRP→PBN neurons is insufficient to drive food intake, the suppression of pain is not simply a consequence of being distracted by an ongoing hunger state. Rather, these neurons facilitate food seeking by reducing responses to competing aversive drives or stimuli that are processed in the PBN (Carter et al., 2013). Furthermore, this function of a feeding insufficient subpopulation highlights the importance of the distributed AgRP neuron circuitry – as this population of hunger-sensitive neurons has distinct subpopulations that interact with many systems in the brain to regulate other survival behaviors.
Manipulating AgRP→PBN neurons during an ongoing pain response causes changes in nocifensive behavior within minutes. This result suggests that peptidergic neurotransmission mediates the interaction between hunger and pain. Indeed, NPY signaling inhibited the behavioral response to inflammatory pain. We corroborated these data by showing that Y1R antagonism in the PBN selectively blocked the ability of hunger or AgRP→PBN stimulation to attenuate inflammatory pain. This occlusion of the dominant NPY receptor in the PBN (Alhadeff et al., 2015) demonstrates the necessity and sufficiency of NPY Y1 receptor signaling for the inhibition of inflammatory pain. Genetic (Naveilhan et al., 2001) and pharmacological (Solway et al., 2011) evidence demonstrate a role of NPY Y1 receptor in the dorsal horn of the spinal cord in mediating pain. Within the brain, it has been demonstrated that NPY signaling in the PAG and trigeminal nucleus also inhibits pain (Martins-Oliveira et al., 2016; Wang et al., 2001). Here, our findings uncover the PBN as an additional site of action for the analgesic effects of NPY, and are unique in that they selectively inhibit inflammatory pain.
GABA and AgRP signaling in the PBN have documented roles in energy balance control (Higgs and Cooper, 1996; Skibicka and Grill, 2009). Furthermore, GABA signaling from AgRP neurons projecting to the PBN is permissive for feeding (Wu et al., 2009), as it suppresses the visceral malaise associated with consumption of a large meal or toxic substance (Alhadeff et al., 2017; Campos et al., 2016; Carter et al., 2013; Essner et al., 2017). However, GABA and AgRP agonists microinjected into the PBN did not affect acute or inflammatory pain, highlighting NPY as the molecular meditator of pain in the PBN. While co-release of neurotransmitters is well-documented (Hnasko et al., 2010; Jonas et al., 1998), our findings dissociate distinct behavioral functions for co-transmitters released by a single neuron type.
Both hunger and pain are negative signals that individuals try to avoid (Betley et al., 2015; Johansen and Fields, 2004; Keys, 1946). The finding that hunger inhibits inflammatory pain raises the question of how one negative drive can inhibit another. Our neural circuit analysis provides insight into this paradox. Since AgRP→PBN neuron activity does not evoke food intake (Atasoy et al., 2012), it is unlikely that these neurons mediate the negative valence of hunger (Betley et al., 2015). Our findings conclusively implicate AgRP→PBN signaling in mediating the response to pain. However, the distinct AgRP circuits that mediate the negative valence of hunger, and inhibit the negative valence of pain, remain compelling topics for future investigation.
Conclusion
Our findings uncover a hierarchy of survival behaviors that prioritizes needs in a changing environment. Our behavioral observations provided a unique entry point to study circuits that inhibit pain. This unexpected ability to influence pain through activity in a distinct hypothalamic→hindbrain hunger circuit reveals an endogenous and ethologically relevant neural circuit mechanism for analgesia. Importantly, this neural circuit can be manipulated to inhibit potentially maladaptive inflammatory pain without compromising adaptive responses to painful stimuli that may acutely threaten survival. Through developing a mechanistic understanding of the influence of hunger on nociception, these experiments provide novel targets for the development of pain management therapies, of utmost importance in the search for non-addictive analgesics.
STAR METHODS
CONTACT FOR REAGENT AND RESOURCE SHARING
Further information and requests for resources and reagents should be directed to and will be fulfilled by the Lead Contact, J. Nicholas Betley. (jnbetley@sas.upenn.edu).
EXPERIMENTAL MODEL AND SUBJECT DETAILS
Mice were group housed on a 12 h light/12 h dark cycle with ad libitum access to food (Purina Rodent Chow, 5001) and water unless otherwise noted. Group housed adult male and female mice (at least 8 weeks old) were used for experimentation. Agrp-IRES-Cre (Jackson Labs 012899, Agrptm1(cre)Lowl/J) (Tong et al., 2008), Ai32 (Jackson Labs 012569, B6;129S-Gt(ROSA)26Sortm32(CAG-COP4*H134R/EYFP)Hze/J) (Madisen et al., 2012), R26-LSL-Gi-DREADD (Jackson Labs 026219, B6N.129-Gt(ROSA)26Sortm1(CAG-CHRM4*,-mCitrine)/Ute/J) (Zhu et al., 2016), VGlut2-IRES-FlpO and Gad2-IRES-FlpO generated as described in Method Details, and C57BL/6J mice were used for experimentation. Genotyping was performed using primers and conditions provided by Jackson Labs or custom primers for Gad2-IRES-FlpO and VGlut2-IRES-FlpO mice as described in Method Details. All mice were habituated to handling and experimental conditions prior to experiments. For within-subject behavioral analyses, all mice received all experimental conditions. For between-subject analyses, mice were randomly assigned to experimental condition. We performed experiments in both male and female subjects, and did not observed any trends or significant sex differences. Thus, to ensure our studies were appropriately powered and to minimize the number of subjects who had to undergo pain assays, we combined males and females for analyses in all experiments. All procedures were approved by the University of Pennsylvania Institutional Animal Care and Use Committee.
METHOD DETAILS
Recombinant Adeno-Associated Virus (rAAV) Constructs and Production
The following Cre- or FlpO-dependent rAAV vectors were used: AAV1.CAGGS.Flex.ChR2-tdTomato.WPRE.SV40 (titer: 1.38e13 GC/ml), AAVrh10.CAGGS.flex.ChR2.tdTomato.WPRE.SV40 (titer: 1.23e13 GC/ml), AAV1rh.CAG.Flex.eGFP.WPRE.bGH (titer: 1.708e13 GC/ml), AAV1.Syn.Flex.GCaMP6s.WPRE.SV40 (titer: 4.216e13 GC/ml), AAV-fDIO-Cre-GFP (titer: 2.91e13 GC/ml), pAAV-hSyn-DIO-hM4D(Gi)-mCherry (titer: 4.3e12 GC/ml). All viruses were produced by the University of Pennsylvania Vector Core, except for the latter which was purchased from Addgene (ID 44362). CAG, promoter containing a cytomegalovirus enhancer; the promoter, first exon and first intron of the chicken beta actin gene; and the splice acceptor of rabbit beta-globin gene. Syn, human Synapsin 1 promoter. FLEX, Cre-dependent flip-excision switch. WPRE, woodchuck hepatitis virus response element. bGH, bovine growth hormone polyadenylation signal. ChR2, channelrhodopsin-2. GCaMP, Genetically encoded calcium indicator resulting from a fusion of GFP, M13 and Calmodulin. DIO, Double-floxed inverted oreientation. hM4, human M4 muscarinic receptor.
Generation of FlpO mice
VGlut2-IRES-FlpO mouse generation
Targeting vector construction: The targeting vector was constructed using a recombineering technique previously described (Liu et al., 2003). A 8,572 bp genomic DNA fragment containing exon 9–12 of the VGlut2 gene was retrieved from BAC clone RP23-228J18 to a vector containing the DT gene, a negative selection marker. A cassette of IRES-FlpO-loxP2272-ACE-Cre POII NeoR-loxp2272 was inserted between stop codon TAA and 3’ UTR. The length of the 5’ homologous arm is 5,519 bp and that for the 3’ arm is 3,049 bp. ES cell targeting and screening: The targeting vector was electroporated into F1 hybrid of 129S6 × C57BL/6J ES cells derived by the Janelia Transgenic Facility. The G418 resistant ES clones were screened by nested PCR using primers outside the construct paired with primers inside the inserted cassette. The primer sequences were as follows: 5’ arm forward primers: VGlut2 Scr F1 (5’-CAGCTCCTTTGAGAATGGCA-3’) and VGlut2 Scr F2 (5’-CCTGACAGTTTCAAAACGTGG-3’). Reverse primers: IRES R1 (5’-AGGAACTGCTTCCTTCACGA-3’) and IRES R2 (5’-CCTAGGAATGCTCGTCAAGA-3’). 3’ arm forward primers: ACE F3 (5’-ACAGCACCATTGTCCACTTG-3’) and ACE F4, (5’-GCTGGTAAGGGATATTTGCC-3’); Reverse primers: VGlut2 Scr R3 (5’-ACATTGGTGCCACTTAGCTG-3’) and VGlut2 Scr R4 (5’-GCATGTGAGCTACCTTAAGC-3’). Generation of chimera and F1 genotyping: The PCR positive ES clones were expanded for generation of chimeric mice. The ES cells were aggregated with 8-cell embryos of CD-1 strain. The chimeras were mated with wildtype C57BL/6J females and the neo cassette was automatically removed in F1 pups. The F1 pups were genotyped by PCR using primers flanking the insertion site and a primer in IRES for the 5’ arm. The primer set VGlut2 gt F P1 (5’- TGCTACCTCACAGGAGAATG-3’) and IRES P3 (5’-GCTTCGGCCAGTAACGTTAG-3’). The PCR products are 186 bp for the mutant allele. The primer set for the 3’ arm is VGlut2 P2 (5’- TGACAACTGCCACAGATTG-3’) and FlpO gt F P4 (5’-CTGGACTACCTGAGCAGCTA-3’). The generated PCR products are 294 bp for the mutant allele. The primer set VGlut2 P1 (5’-TGCTACCTCACAGGAGAATG-3’) and Vglut2 P2 (5’-TGACAACTGCCACAGATTG-3’) is designed to detect the wildtype allele for homozygote genotyping. The correct targeting was further confirmed by obtaining homozygotes from chimera × F1 heterozygous females mating. The mouse lines from two independent ES cell clones were homozygosity tested and bred for experiments. Genotyping PCR: The template DNA was obtained by digesting an ear piece in 50 μl proteinase K buffer (50 mM Tris pH 8.8, 1 mM EDTA pH 8.0, 0.5% Tween-20 and proteinase K 0.6 mg/ml). The reaction was incubated at 55°C overnight and heat inactivated at 100°C for 10 minutes. 0.5 µl of the template was used in 12 µl PCR reaction. The reaction was carried out with an initial denature cycle of 94°C for 3 min, followed by 35 cycles of 94°C 30 s, 55°C 30 s and 72°C 30 s and ended with one cycle of 72°C for 5 min.
Gad2-IRES-FlpO mouse generation
Targeting vector construction: The targeting vector was constructed using a recombineering technique previously described (Liu et al., 2003). A 10,389 bp genomic DNA fragment containing exon 16 of the Gad2 gene was retrieved from BAC clone RP23-27D24 to a vector containing the DT gene, a negative selection marker. A cassette of IRES-FlpO-loxP2272-ACE-Cre POII NeoR-loxp2272 was inserted between stop codon TAA and 3’ UTR. The length of the 5’ homologous arm is 3,195 bp and that for the 3’ arm is 7,193 bp. ES cell targeting and screening: The targeting vector was electroporated into F1 hybrid of 129S6 × C57BL/6J ES cells derived by the Janelia Transgenic Facility. The G418 resistant ES clones were screened by nested PCR using primers outside the construct paired with primers inside the inserted cassette. The primer sequences were as follows: 5’ arm forward primers: Gad2 Scr F1 (5’-CAATTGCTGAGCTGAAGTGC-3’) and Gad2 Scr F2 (5’-CAAGCAGTCAGCAGATTCCA-3’). Reverse primers: IRES R1 (5’-AGGAACTGCTTCCTTCACGA-3’) and IRES R2 (5’-CCTAGGAATGCTCGTCAAGA-3’). 3’ arm forward primers: ACE F3 (5’-ACAGCACCATTGTCCACTTG-3’) and ACE F4 (5’-GCTGGTAAGGGATATTTGCC-3’); Reverse primers: Gad2 Scr R3 (5’-GGCTTGATTCCTCAGAGGAA-3’) and Gad2 Scr R4 (5’-GCACAACAGTTGGACCTTAG-3’). Generation of chimera and F1 genotyping: The PCR positive ES clones were expanded for generation of chimeric mice. The ES cells were aggregated with 8-cell embryos of CD-1 strain. The chimeras were mated with wildtype C57BL/6J females and the neo cassette was automatically removed in F1 pups. The F1 pups were genotyped by PCR using primers flanking the insertion site and a primer in IRES for the 5’ arm. The primer set Gad2 gt F P1 (5’-TATGGGACCACAATGGTCAG-3’) and IRES P3 (5’-GCTTCGGCCAGTAACGTTAG-3’). The PCR products are 212 bp for the mutant allele. The primer set for the 3’ arm is Gad2 P1 (5’-TATGGGACCACAATGGTCAG-3’), Gad2 P2 (5’- TGCTGGGATTAAAGGCATGC-3’) and FlpO gt F P4 (5’-CATCAACAGGCGGATCTGAT-3’). The generated PCR products are 261 bp for the mutant allele and 325 bp for wildtype allele. The correct targeting was further confirmed by obtaining homozygotes from chimera × F1 heterozygous females mating. The mouse lines from three independent ES cell clones were homozygosity tested and were bred for experiments. Genotyping PCR: Genotyping PCR was performed as for VGlut2-IRES-FlpO mice.
Viral Injections, Fiber Optic and Cannula Placement
Bilateral viral injections and unilateral implantation of ferrule-capped optical fibers (200 µm core, NA 0.37 for optogenetic stimulation; 400 µm core, NA 0.48 for fiber photometry, Doric) were performed as previously described (Betley et al., 2013). For somatic stimulation of AgRP neurons, Agrp-IRES-Cre mice were crossed with Ai32 mice to express ChR2 in AgRP neurons. Mice were anesthetized with isoflurane (1.5–3%), given ketoprofen (5 mg/kg) and bupivacaine (2 mg/kg) analgesia and placed into a stereotaxic device (Stoelting). An optical fiber was placed over the arcuate hypothalamic nucleus (ARC) at bregma −1.35 mm, midline ±0.25 mm, skull surface −5.8 mm. For axonal stimulation of AgRP neurons, a rAAV encoding Cre-dependent ChR2 was bilaterally injected into the ARC of AgRP-IRES-Cre mice using the aforementioned ARC injection coordinates (150 nl per site, bilaterally). Optical fibers were unilaterally implanted according to the following coordinates. BNST: bregma +0.85 mm, midline ±0.82 mm, skull surface −3.8 mm; PVH: bregma −0.5 mm, midline ±0.2 mm, skull surface −5.4 mm; PVT: bregma −1.0 mm, midline ±0.0 mm, skull surface −2.7 mm; LH: bregma −1.0 mm, midline ±0.9 mm, skull surface −5.4 mm; CeA: bregma −1.15 mm, midline ±2.4 mm, skull surface −4.25 mm; ARC: bregma −1.35 mm, midline ±0.25 mm, skull surface −5.8 mm; PAG: bregma −4.4 mm, midline ±0.6 mm, skull surface −2.8 mm; lateral PBN: bregma −5.8 mm, midline ±1.2 mm, skull surface −3.7 mm. Fibers were secured to the skull with bone screws and dental cement. For pharmacological experiments, mice were implanted with unilateral 26 gauge guide cannulae (Plastics One, Roanoke, VA) above the lateral PBN (according to the above coordinates) which were secured to the skull with bone screws and dental cement (Alhadeff et al., 2015). For chemogenetic inhibition of lateral PBN neurons, VGlut2-IRES-FlpO and Gad2-IRES-FlpO mice were bilaterally injected (200 nl/hemisphere) in the lateral PBN with a FlpO-dependent rAAV encoding Cre, and a Cre-dependent rAAV encoding inhibitory Designer Receptors Exclusively Activated by Designer Drugs (DREADDs, hM4D). For fiber photometry, a rAAV encoding Cre-dependent GCaMP6s was bilaterally injected into the ARC of AgRP-IRES-Cre mice using the following coordinates: bregma −1.35 mm; midline ±0.25 mm; skull surface −6.15 mm and −6.3 mm (250 nl per site, bilaterally), and an optical fiber was implanted over the ARC using the following coordinates: bregma −1.35 mm; midline ±0.25 mm; skull surface −6.0 mm. Mice were given at least 3 weeks for recovery and transgene expression. Fiber and cannula placements were verified postmortem.
General Experimental Design
For each experiment, our subject numbers were determined by our pilot studies, laboratory publications, and power analyses [power=0.8, significance level=0.05, effect sizes=10–30%]. For within-subject behavioral and fiber photometry analyses, all mice received all experimental conditions. For between-subject analyses, mice were randomly assigned to experimental condition. For all behavioral and fiber photometry experiments, experiments were performed in at least two cohorts to ensure replicability of results, by at least 2 researchers who were blinded to experimental conditions. For histological experiments, protein intensities and neuron counts were quantified by 4 research assistants who were blinded to experimental condition. For all behavioral and fiber photometry experiments, virus expression, fiber placements, and/or cannula placements were verified postmortem, and any mice with viral expression or implants outside of the area of interest were excluded from all analyses.
In Vivo Photostimulation
Photostimulation was performed as previously described (Betley et al., 2013), with 10 ms pulses at 20 Hz for 1 s, repeated every 4 s. The output beam from a diode laser (450 nm, Opto Engine) was controlled by a microcontroller (Arduino Uno) running a pulse generation script. The laser was coupled to a multimode optical fiber (200 µm core, NA 0.37, Doric) with a 1.25 mm OD zirconium ferrule (Kientech) and mating sleeve that allowed delivery of light to the brain by coupling to the implanted ferrule-capped optical fiber in the mouse. Power was set to ensure delivery of at least 2 mW/mm2 to AgRP soma and at least 5 mW/mm2 to the center of the AgRP neuron projection fields.
Food Deprivation/Restriction
For 24 h food deprivation, mice were placed in a cage with alpha dry bedding and ad libitum access to water, but no food, 24 h prior to experimentation. For chronic food restriction, mice were weighed at the same time each day and given chow once daily (1.5–3.0 g) after experimentation to maintain 85–90% of their starting body weight.
Food Intake Experiments
Effects of AgRP neuron stimulation on food intake
Mice were allowed to habituate for at least one hour to a chamber with a lined floor and ad libitum access to chow and water. Following the habituation period, food intake was measured for 1 h to establish a pre-stimulation baseline. Photostimulation was performed during the next hour. After each hour, food intake was measured. For somatic AgRP neuron stimulation, only mice that consumed >0.6 g of chow were included in experiments. Food intake evoked by stimulation of each AgRP neuron projection subpopulation was measured and reported in Figure S3D.
Effects of AgRP neuron inhibition on food intake
Mice were habituated to an empty home cage with a lined floor. Mice were food deprived for 24 h, intraperitoneally (i.p.) injected with saline or clozapine-N-oxide (CNO, 2.5 mg/kg, Tocris), and placed into their cage with ad libitum access to chow and water. Chow intake was measured 4 h post-injection, accounting for crumbs.
Effects of hotplate exposure on latency to feed
24 h food deprived mice were individually placed in a home cage with a lined floor and access to water. After a 10 min habituation period, mice were exposed to a cast iron plate at either 25°C or 52°C for 1 min and immediately placed back into the cage with food and water. Latency to consume food was measured.
Effects of formalin injection on food intake
24 h food deprived mice were individually placed in a home cage with a lined floor and access to water. After a 10 min habituation period, mice were injected subcutaneously in the dorsal hindpaw with saline or 2% formalin (20 µl, Sigma HT50-1-2) and returned to their cage with food. Food intake was recorded 1 h post-injection.
Inflammatory Pain Measurements (Formalin Test)
Mice were placed in a clear enclosure for a 10 min habituation period. Mice were subcutaneously injected in the dorsal hindpaw with saline or 2% formalin (20 µl). Mice were monitored for time spent licking paw, and number of lick bouts, for 1 h post-injection by researchers blinded to experimental condition. All sessions were video-recorded. The time spent paw licking was grouped into 5 min bins (Hunskaar and Hole, 1987) and recorded for 1 h. Additionally, acute (0–5 min) and inflammatory (15–45 min) phase pain responses were quantified.
Effects of ketoprofen on formalin test
The non-steroidal anti-inflammatory drug ketoprofen (30 mg/kg) or saline was administered subcutaneously 30 min before formalin injection.
Effects of food deprivation on formalin test
Food was removed 24 h prior to formalin injection. Ad libitum fed mice served as controls.
Effects of formalin on paw inflammation
24 h food deprived mice were lightly anesthetized and paw circumference was measured immediately before saline or formalin paw injection. Paw circumference was measured again 30 min post-injection.
Optogenetic AgRP neuron stimulation
To assess the effects of AgRP neuron stimulation on acute and inflammatory phase pain responses to formalin, mice received optogenetic stimulation of AgRP neurons or individual projection subpopulations beginning 10 min prior to formalin injection and lasting throughout the formalin test. To assess the ability of AgRP neuron stimulation to affect an ongoing inflammatory pain response, stimulation of AgRP neurons or AgRP→PBN neurons was initiated 25 min post-formalin injection and lasted for the duration of the formalin test. To assess whether the offset of AgRP→PBN neuron activity results in a reinstatement of inflammatory phase pain response, laser stimulation was given 10 min prior to formalin injection and terminated 25 min post-formalin injection. To test whether prolonged AgRP→PBN neuron stimulation affects the ability to paw lick, mice were stimulated for 40 min and formalin-induced acute phase pain was measured.
Chemogenetic AgRP neuron inhibition
To assess the necessity of AgRP neuron activity for the inhibition of inflammatory pain by hunger, mice were 24 h food deprived and i.p. injected with CNO (2.5 mg/kg) 15 min before formalin injection.
Chemogenetic inhibition of lateral PBN VGlut2 and Gad2 neurons
To determine whether lateral PBN glutamatergic (VGlut2-expressing) or GABAergic (Gad2-expressing) neurons mediate inflammatory pain responses, VGlut2hM4D, Gad2hM4D, and control mice were i.p. injected with CNO (2.5 mg/kg) 15 min before formalin injection.
Thermal Pain Measurements (Hotplate Test)
A cast iron plate with plexiglass walls was placed on a hotplate and heated to 52°C. Mice were placed on the hotplate and latency to withdraw paw was recorded by researchers blinded to experimental condition. All sessions were video-recorded.
Effects of morphine on hotplate test
Mice underwent a baseline hotplate test and were subsequently i.p. injected with saline or morphine (10 mg/kg). Mice were tested again on the hotplate 30 min post-injection.
Effects of food deprivation on hotplate test
Food was removed 24 h prior to hotplate test. Ad libitum fed mice served as controls.
Optogenetic AgRP neuron stimulation during hotplate test
To assess the effects of AgRP neuron stimulation on acute thermal pain response, mice were placed in a plexiglass chamber, attached to patch fibers, and allowed to habituate for 30 min. Mice underwent a baseline hotplate test, and 5 min later laser stimulation was initiated. Mice were tested again on the hotplate following 15 and 45 min of stimulation of AgRP neurons or control light delivery to GFP-expressing mice. A separate experiment was performed to assess the role of AgRP→PBN neurons on acute thermal pain by delivering light to the PBN of mice expressing either ChR2 or GFP in AgRP neurons, using identical experimental procedures.
Mechanical Pain Measurements (Von Frey Test)
Mice were habituated for 30 min in small plexiglass chambers atop mesh flooring. Twelve Von Frey filaments (ranging from 0.008 g to 6 g) were used. Starting with the smallest Von Frey filament and continuing in ascending order, each filament was applied to the plantar surface of the hind paw until the filament bent. Each filament was tested 5 times. The number of withdrawal responses was recorded for each filament, and the percentage withdrawal responses for each filament was calculated (# of withdrawal trials/total trials). Withdrawal threshold was determined as the filament at which the mouse responded with a paw withdrawal to >50% of trials. To test the effects of hunger on mechanical pain, mice were 24 h food deprived and then subjected to the Von Frey test.
Inflammation-Induced Sensitization
Complete Freund’s Adjuvant (CFA, Sigma) was diluted 1:1 in saline and injected (20 µl) into the plantar surface of the paw after a baseline Von Frey or hotplate test. Given that we and others observe a more robust CFA-induced sensitization to thermal pain at 55°C (Carey et al., 2017), we used this temperature for CFA-induced thermal sensitization. Von Frey or hotplate tests were repeated 3 h, 24 h, and 48 h post-CFA injection.
Effects of hunger on inflammation-induced sensitization
Mice were 24 h food deprived and subjected to Von Frey or hotplate tests as described above. Mice were provided enough food in one daily aliquot to maintain 85–90% BW through the rest of testing (up to 48 h post-CFA injection).
Effects of AgRP neuron stimulation on inflammation-induced sensitization
Optogenetic AgRP neuron stimulation was performed for 1 h before each of the post-CFA Von Frey tests (3 h, 24 h, and 48 h post-CFA injection).
Conditioned Place Avoidance
Two-sided apparatus were used with distinct visual (black vs. white walls), textural (flooring: plastic vs. soft textural side of Kimtech bench-top protector), and olfactory (almond vs. peppermint extract) cues. A neutral middle zone to shuttle between sides was maintained and the chamber was equipped with an overhead camera to track mouse position. Ad libitum fed mice were habituated to the apparatus and a pre-conditioning preference was determined via AnyMaze software. Mice were then separated into two groups: food restricted (85–90% of initial body weight) or ad libitum fed. Conditioning, which consisted of a saline paw injection (20 µl) on the less preferred side or a 2% formalin paw injection (20 µl) on the preferred side was performed twice daily for four days. To isolate conditioning to the inflammatory phase of formalin pain, mice were placed in the apparatus 15 min post-injection. After conditioning, all mice were given ad libitum access to food. The next day, mice were given access to both sides of the apparatus and their position and activity were tracked. The percentage occupancy, shifts in occupancy, and total distance traveled in the formalin-paired side during the post-conditioning test were calculated. To control for any associative learning deficits during hunger, the same conditioned place avoidance paradigm was used, except that mice were given i.p. saline on the less preferred side and i.p. lithium chloride (125 mg/kg) on the preferred side during conditioning.
Locomotor Activity Assays
Effects of food deprivation of formalin-induced immobility
Mice were habituated to 10” × 10” × 10” plexiglass chambers. Food was removed from mice 24 h prior to 2% formalin injection, and mice were placed in chambers and video-recorded during the inflammatory phase following formalin injection (15–45 min post-injection). Videos were analyzed with AnyMaze software (Stoelting) for time spent immobile, which was defined as not changing position in the X–Y grid for at least 8 s.
Effects of AgRP→PBN neuron stimulation on locomotor activity
Mice were habituated to 10” × 10” × 10” plexiglass chambers. AgRP→PBN neurons were optogenetically stimulated for 30 min and behavior was video-recorded. Videos were analyzed with AnyMaze software (Stoelting) for total distance traveled and time spent immobile, which was defined as not changing position in the X–Y grid for at least 8 s.
Immunohistochemistry and Imaging
Mice were transcardially perfused with 0.1 M phosphate buffered saline (PBS) followed by 4% paraformaldehyde (PFA). Brains were removed and post-fixed for 4 h in PFA and then washed overnight in PBS. Coronal brain sections were cut (30–200 µm sections) on a vibratome or cryostat and stored in PBS. Brain sections were incubated overnight at 4°C with primary antibodies diluted in PBS, 1% BSA and 0.1% Triton X-100. Antibodies used: goat anti-AgRP (1:2,500, Neuromics, GT15023), rabbit anti-cFos (1:5,000, Cell Signaling, 2250), guinea pig anti-RFP (1:10,000) (Betley et al., 2013), rabbit anti-GFP (1:5,000, Invitrogen, A-11122), rabbit anti-NPY (1:1,500, Immunostar, 22940), rat anti-GAD65 (1:2,000) (Betley et al., 2009), guinea pig anti-VGlut2 (1:2,000, SYSY, 135404). Sections were washed 3 times and incubated with species appropriate and minimally cross-reactive fluorophore-conjugated secondary antibodies (1:500, Jackson ImmunoResearch) for 2 h at room temperature. Sections were washed twice with PBS and mounted and coverslipped with Fluorogel. Epifluorescence images were taken on a Leica stereoscope to verify fiber placements, cannula placements, and obtain low magnification images. Confocal micrographs were taken on a Leica STED laser scanning microscope using a 20×, 0.75 NA objective for quantification of Fos immunoreactivity under AgRP axons; a 40×, 1.3 NA objective for quantification of protein expression in AgRP→PBN terminals; and a 63× or 100×, 1.4 NA objective for protein colocalization of mCherry, VGlut2, and GAD65 in PBN axon terminals.
Quantification of Protein Expression
Immediate early gene protein expression analysis
To quantify the number of neurons expressing Fos protein under AgRP axons, mice received no treatment (n=3) or a 20 µl subcutaneous injection of formalin (5%, n=3) or saline (n=3) in the dorsal hindpaw. Two hours later, mice were perfused and brains were processed for immunohistochemistry. First, images of Fos and AgRP from a formalin-treated mouse were obtained in each of the major AgRP projection target regions. Identical image acquisition settings were maintained for all subsequent imaging of Fos and AgRP in experimental and control mice. To quantify the number of Fos-expressing neurons in each AgRP neuron target region, single optical sections (pinhole = 1 airy unit, 2–4 sections/mouse/AgRP target region) were used and the AgRP neuron staining was used to define the region for quantification (see Figure 4A).
Quantification of synaptic protein expression
Ad libitum fed (n=2) and 24 h food deprived (n=3) mice were perfused and PBN brain sections were processed for NPY, the GABA synthetic enzyme GAD65, and AgRP immunoreactivity. Confocal images were obtained first from a food deprived mouse so that the intensities of NPY, GAD65, and AgRP were in the linear range. Image acquisition settings were maintained for all subsequent imaging and 2 PBN images per mouse were obtained. For intensity quantifications, single confocal sections (pinhole = 1 airy unit) were used and the intensities of NPY, GAD65, and AgRP were calculated using the histogram function on Adobe Photoshop.
Colocalization of hM4D, Vglut2, and GAD65 in lPBN neurons
To determine the specificity of expression of hM4D in the Gad2-IRES-FlpO and Vglut2-IRES-FlpO knock-in lines, staining was performed against mCherry, Vglut2 and GAD65 in coronal sections from at least 2 mice/line used for experimentation. For quantification, single confocal sections (pinhole = 1 airy unit) were used and the number of Vglut2+ or GAD65+ structures that expressed hM4D-mCherry were counted.
Pharmacology
For all experiments, mice were habituated to handling and infusion procedures. Drugs were diluted from frozen aliquots before each experiment and microinjected (100 nl) with a Hamilton syringe attached to an internal cannula (Plastics One) and microliter syringe pump (PHD Ultra, Harvard Apparatus) into the PBN of mice immediately before a formalin test (see above) or food intake measurements.
Effects of lPBN NPY, GABA agonists, and AgRP analogue on formalin-induced inflammatory pain
Neuropeptide Y [NPY, Tocris, 0.1 µg], GABAA and GABAB receptor agonists [muscimol, Tocris, 25 ng and baclofen, Tocris, 25 ng], an AgRP analogue [melanocortin 4 receptor antagonist; SHU9119, 25 pmol] or vehicle [artificial cerebrospinal fluid (aCSF)] was microinjected into the lateral PBN immediately before paw injection of formalin.
Effects of lPBN NPY, GABA agonists, and AgRP analogue on food intake
The aforementioned drugs were infused in the lPBN during the light cycle and food intake was recorded 1 h post-injection.
Effects of locus coeruleus NPY on formalin-induced inflammatory pain
Since AgRP axons terminate both in the lPBN and the locus coeruleus, NPY or vehicle was infused in the locus coeruleus area (directly medial from lPBN) immediately before formalin paw injection.
Effects of lPBN NPY Y1 receptor antagonist on the inhibition of inflammatory pain by hunger
Microinjections of the selective NPY Y1 receptor antagonist BIBO 3304 [Tocris, 3 µg], GABAA and GABAB antagonists [saclofen, 100 ng, Sigma, and bicuculline, 10 ng, Sigma] or vehicle (50% DMSO in aCSF) were infused into the lPBN of 24 h food deprived mice.
Effects of lPBN NPY Y1 receptor antagonist on the inhibition of inflammatory pain by AgRP→PBN stimulation
To test whether the protective effects of AgRP→PBN neuron stimulation on inflammatory pain are mediated by NPY, we performed an experiment similar to that in (Atasoy et al., 2012). Mice expressing ChR2 in AgRP neurons were injected in the lPBN with vehicle or the Y1 receptor antagonist BIBO 3304. An optic fiber was then inserted through the PBN cannula and a formalin paw injection was administered. AgRP→PBN stimulation occurred throughout the duration of the formalin test.
Fiber Photometry
Food-restricted (85–90% body weight) mice in their home cage were attached to a patch fiber (400 µm core, NA 0.48, Doric) and connected to 405 nm and 490 nm LEDs (Thor Labs, M405F1, M470F3) modulated by a real-time amplifier [Tucker-Davis Technology (TDT), Alachua, FL, RZ5P] and focused onto a femtowatt photoreceiver (Newport, Model 2151) (Figure 6C) (Gunaydin et al., 2014). Changes in calcium-dependent GcaMP6s fluorescence (490 nm) signal were compared with calcium-independent GCaMP6s fluorescence (405 nm), providing internal control for movement and bleaching artifacts (Lerner et al., 2015; Su et al., 2017). Fluorescence measurements (1 Hz) were extracted from Synapse software (TDT), processed in MatLab (GraphPad), and expressed as ΔF/F, where the denominator represents average baseline fluorescence.
Effects of acute thermal pain on AgRP neuron activity
Food restricted (85–90% BW) mice were connected to the fiber photometry setup for a 5 min baseline period in their home cage. Mice were then placed on a 25°C or 52°C plate for 1 min, after which they returned to their cage. GCaMP6s fluorescence was monitored for 10 min following hotplate exposure.
Effects of acute and inflammatory formalin-induced pain on AgRP neuron activity
Food restricted (85–90% BW) mice were connected to the fiber photometry setup for a 5 min baseline period in their home cage. Mice were injected in the dorsal hindpaw with 2% formalin or saline (20 µl) and returned to their cage. GCaMP6s fluorescence was monitored for 1 h post-formalin injection.
QUANTIFICATION AND STATISTICAL ANALYSES
Data were expressed as means ± SEMs in figures and text. Paired or unpaired two-tailed t-tests with or without Bonferroni corrections and Pearson regressions were performed as appropriate. One-way, two-way, and repeated measures ANOVA were used to make comparisons across more than two groups using SigmaPlot or STATISTICA. Test, statistics, significance levels, and sample sizes for each experiment are listed in Supplementary Tables 1 and 2. ns p>0.05, t-tests and post-hoc comparisons: *p<0.05, **p<0.01, ***p<0.001; interaction: ∞p<0.05, ∞∞p<0.01, ∞∞∞p<0.001; main effect (group, condition or drug): ☼<0.05, ☼☼p<0.01, ☼☼☼p<0.001.
Supplementary Material
(A) Experimental timeline for effects of an anti-inflammatory analgesic (ketoprofen) on the formalin test. (B) Inflammatory phase formalin-induced paw licking (time) in i.p. saline- (n=5) and ketoprofen-(n=6) treated mice (unpaired t-test, p<0.01). (C) Inflammatory phase formalin-induced lick bouts in saline- and ketoprofen-treated mice (unpaired t-test, p<0.01). (D) Acute phase formalin-induced paw licking (time) in saline- and ketoprofen-treated mice (unpaired t-test, p=ns). (E) Acute phase formalin-induced lick bouts in saline- and ketoprofen-treated mice (unpaired t-test, p=ns). (F) Experimental timeline for effects of morphine on the hotplate test. (G) Latency to paw withdrawal from 52°C hotplate before and 30 min post i.p. saline injection (paired t-test, p=ns). (H) Latency to paw withdrawal from hotplate before and 30 min post i.p. morphine injection (paired t-test, p<0.01). (I) Experimental design: 24 h food deprived mice were injected with saline or formalin in their hindpaw and change in paw circumference was measured 30 min post-injection. (J) Change in paw circumference in food deprived saline- (n=6) and formalin-(n=9) injected mice (unpaired t-test, p<0.01). Data are expressed as mean ± SEM, ns p>0.05, ttests: **p<0.01.
(A) Experimental design: Laser light pulses delivered to AgRP neurons of AgRPGFP and AgRPChR2 mice began 10 min before formalin injection and continued while formalin-induced paw licking was quantified. (B) Inflammatory phase formalin-induced lick bouts in AgRPGFP and AgRPChR2 mice (unpaired t-test, p<0.01). (C) Laser stimulation-induced food intake (y-axis) correlates with inflammatory phase paw licking (x-axis); AgRPGFP (grey circles, n=12), AgRPChR2 (blue circles, n=12), red circles are group averages (Pearson regression, R=0.60, p<0.01). (D) Time spent paw licking during acute phase of formalin test in AgRPGFP and AgRPChR2 mice (unpaired t-test, p=ns) (E) Acute phase formalin-induced lick bouts in AgRPGFP and AgRPChR2 mice (unpaired t-test, p=ns). (F) Experimental design: AgRPGFP and AgRPChR2 mice were injected with Complete Freund’s Adjuvant (CFA) after a baseline Von Frey test. Mice underwent additional Von Frey tests at 3h, 24 h, and 48 h post-CFA injection, with 1 h of laser stimulation before each test. (G) Percentage withdrawal from Von Frey Filaments before and 3 h, 24 h, and 48 h post-CFA injection in AgRPGFP mice (n=6, two-way repeated measures ANOVA, p<0.001). (H) Percentage withdrawal from Von Frey Filaments before and 3 h, 24 h, and 48 h post-CFA injection in AgRPChR2 mice (n=9, two-way repeated measures ANOVA, p=ns). (I) Latency to withdraw paw from hotplate during AgRP neuron stimulation in AgRPChR2 mice (n=12, repeated-measures one-way ANOVA, p=ns). (J) Normalized latency to withdraw paw from hotplate in AgRPGFP and AgRPChR2 mice after 45 min of laser stimulation (unpaired t-test, p=ns). (K) Time spent licking paw in AgRPGFP (n=12) and AgRPChR2 (n=12) mice with laser stimulation following saline paw injection (two-way repeated measures ANOVA, p=ns). (L) Inflammatory phase paw licking (time) in AgRPGFP and AgRPChR2 mice during laser stimulation following saline paw injection (unpaired t-tests, p=ns). (M) Acute phase paw licking (time) in AgRPGFP and AgRPChR2 mice during laser stimulation following saline paw injection (unpaired t-tests, p=ns). Data are expressed as mean ± SEM, ns p>0.05, t-tests and post-hoc comparisons: *p<0.05, **p<0.01, ***p<0.001; ANOVA interaction: ∞p<0.05, ∞∞∞p<0.001; ANOVA main effect of drug: ☼☼☼p<0.001.
(A) Schematics of target brain regions and representative images of formalin-induced Fos underlying AgRP axon projections in the BNST, PVT, PVH, LH, CeA, PAG, and PBN. Scale bar, 150 µm. (B) Representative images of fiber placements (indicated in white dotted lines. Scale bar, 1 mm. (C) Diagram of the major AgRP neuron projection subpopulations analyzed. (D) Food intake (1 h) in ad libitum fed mice with (+, colored bars) and without (−, grey bars) laser stimulation of AgRP axons (n=9–12/target region, paired t-test with Bonferroni correction, BNST and PVH p<0.001; LH p<0.01, PVT p<0.05; CeA, PAG, PBN p=ns). (E) Inflammatory phase formalin-induced lick bouts with (+, colored bars) and without (−, grey bars) AgRP neuron stimulation of discrete AgRP projection subpopulations (n=9–12/target region, paired t-tests with Bonferroni correction, all ps=ns except for PBN, p<0.001). (F) Acute phase formalin-induced paw licking (time) in AgRP→PBNChR2 mice (n=5) following 40 min of laser stimulation compared to stimulation of AgRP→PBNGFP mice (n=12) (unpaired t-test, p=ns). (G) Total distance traveled in AgRP→PBNChR2 mice (n=5) with and without 30 min laser stimulation (unpaired t-test, p=ns). (H) Time spent immobile in AgRP→PBNChR2 mice (n=5) with and without 30 min laser stimulation (unpaired t-test, p=ns). (I) Acute phase formalin-induced paw licking (time) during light pulse delivery in AgRP→PBNGFP mice (n=12, paired t-test, p=ns). (J) Inflammatory phase formalin-induced paw licking (time) during light pulse delivery in AgRP→PBNGFP mice (n=12, paired t-test, p=ns). (K) Latency to paw withdrawal from 52°C hotplate during light pulse delivery in AgRP→PBNGFP mice (n=12, one-way ANOVA, p=ns). Data are expressed as mean ± SEM, ns p>0.05, *p<0.05, **p<0.01, ***p<0.001.
(A) Schematic and representative image demonstrating formalin-induced Fos and AgRP axons in the lateral PBN (lPBN). (B) Food intake (1 h) following PBN microinjection of vehicle, NPY, an AgRP analogue, or GABA agonists (n=8, one-way repeated measures ANOVA, p=ns). (C) Schematic showing center of injection sites for mice injected with NPY in the lPBN (closed circles) or the locus coeruleus (LC) area (open circles). (D) Time spent licking paw in LC vehicle- (n=5) or NPY (n=5) -injected mice (two-way repeated measures ANOVA, p=ns). (E) Inflammatory phase paw licking (time) in LC vehicle- (n=5) or NPY (n=5) -injected mice (unpaired t-tests, p=ns). (F) Acute phase paw licking (time) in LC vehicle- (n=5) or NPY (n=5) - injected mice (unpaired t-tests, p=ns). (G) Top, Experimental design: Laser stimulation was initiated 25 min post-formalin injection and lasted for the duration of the test. Bottom, graph: formalin-induced paw licking (time) with the onset of AgRP→PBN neuron activity in AgRP→PBNChR2 mice (n=12); traces of pain responses with and without AgRP→PBNChR2 stimulation for the entire session are indicated in dotted lines for reference. (H) Top, Experimental design: Laser stimulation was initiated 10 min before formalin injection and terminated 25 min post-injection. Bottom, graph: formalin-induced paw licking (time) with the offset of AgRP→PBN neuron activity in AgRP→PBNChR2 mice (n=7); traces of pain responses with and without AgRP→PBNChR2 stimulation for the entire session are indicated in dotted lines for reference. (I) Time spent responding to inflammatory pain following the onset or offset of laser stimulation (25–45 min post-injection). Inflammatory phase pain responses after the onset (magenta) and offset (purple) of AgRP→PBNChR2 stimulation are compared to the inflammatory responses with and without AgRP→PBNChR2 stimulation (unpaired t-tests with Bonferroni correction, stimulation vs. onset/offset vs. no stimulation, all ps<0.01). Data are expressed as mean ± SEM, ns p>0.05, t-tests: **p<0.01, ***p<0.001
(A) Genomic structure of genetically modified Gad2 allele. (B) Genomic structure of genetically modified VGlut2 allele. (C) Strategy for expressing hM4D in Gad2 and VGlut2 PBN neurons: A FlpO-dependent rAAV expressing Cre was combined with a Cre-dependent rAAV expressing hM4D as in (Li et al., 2013), allowing for the expression of hM4D in Gad2+ and VGlut2+ lPBN neurons. These neurons were inhibited by i.p. injection of clozapine-N-oxide (CNO) as previously demonstrated (Mu et al., 2017). (D) Left, in situ hybridization for Gad2 and VGlut2 mRNA in the PBN [images from Allen Brain Explorer, http://mouse.brain-map.org, (Lein et al., 2007)]. Red boxes indicated region of images to the right. Scale bar, 1 mm. Right, representative images of hM4D-mCherry expression (red) in the lPBN of experimental mice. Quantification of lPBN sections revealed an average of 98.2 ± 6.4 and 194.8 ± 35.9 hM4D-expressing neurons (per unilateral section) in Gad2-IRES-FlpO (n=6) and VGlut2-IRES-FlpO mice, respectively. Scale bar, 500 µm. scp, superior cerebellar peduncle. (E) Quantification of GAD65+ or VGlut2+ boutons colabeled with mCherry in Gad2-IRES-FlpO (top) and VGlut2-IRES-FlpO (bottom) mice. (F) Time spent licking paw in control (n=5) and VGlut2hM4D (n=6) neurons after injection of CNO (two-way repeated measures ANOVA, main effect of group, p<0.01). (G) Inflammatory phase paw licking in control (n=5), Gad2hM4D (n=6) Vglut2hM4D (n=6) mice following CNO injection. Data are expressed as mean ± SEM, ns p>0.05, t-tests and posthoc comparisons: *p<0.05, **p<0.01, ***p<0.001; ANOVA main effect of group: ☼☼p<0.01.
(A) Calcium-dependent (mean, dark green; SEM, green shading) and calcium-independent (mean, dark purple; SEM, purple shading) change in fluorescence (ΔF/F) in AgRP neurons of food restricted mice (n=10) before and after chow refeeding. (B) Mean change in GCaMP6s signal (ΔF/F) before and after chow presentation (two-way repeated measures ANOVA, p<0.001). (C) GCaMP6s fluorescence changes (ΔF/F) of AgRP neurons in individual mice with saline or formalin paw injection. (D) GCaMP6s fluorescence changes (ΔF/F) in AgRP neurons of individual mice with 60 s exposure to 25°C or 52°C plate. (E) Maximum change in AgRP neuron calcium dynamics with formalin or hotplate exposure relative to activity change observed following chow presentation (n=10 25°C/52°C plate, n=8 saline/formalin injection; two-way repeated-measures ANOVA, p<0.01). Data are expressed as mean ± SEM, ns p>0.05, t-tests and post-hoc comparisons: ***p<0.001; ANOVA interaction: ∞∞p<0.01, ∞∞∞p<0.001; ANOVA main effect of pre vs. post chow presentation (Figure S6B) or ANOVA main effect of condition (Figure S6E): ☼p<0.05, ☼☼☼p<0.001.
Table S2, Related to Figures S1–S6. Statistical Analyses of Data Presented in Supplemental Figures.
Table S3, Related to Figure S5 and Key Resource Table. Oligonucleotides Used for Generation of FlpO Mice.
KEY RESOURCES TABLE
| REAGENT or RESOURCE | SOURCE | IDENTIFIER |
|---|---|---|
| Antibodies | ||
| Goat anti-AgRP | Neuromics | GT15023 |
| Rabbit anti-cFos | Cell Signaling | 2250 |
| Guinea pig anti-RFP | Abcam Custom preparation, (Betley et al., 2013) | N/A |
| Rabbit anti-GFP | Invitrogen | A-11122 |
| Rabbit anti-NPY | Immunostar | 22940 |
| Rat anti-GAD65 | Custom preparation, (Betley et al., 2009) | N/A |
| Guinea pig anti-Vglut2 | SYSY | 135404 |
| Fluorescein (FITC) AffiniPure Donkey Anti-Sheep IgG (H+L) | Jackson ImmunoResearch Laboratories, INC. | 713-095-003 |
| Fluorescein (FITC) AffiniPure Donkey Anti-Rabbit IgG (H+L) | Jackson ImmunoResearch Laboratories, INC. | 711-095-152 |
| Cy™3 AffiniPure Donkey Anti-Rabbit IgG (H+L) | Jackson ImmunoResearch Laboratories, INC. | 711-165-152 |
| Cy™3 AffiniPure Donkey Anti-Goat IgG (H+L) | Jackson ImmunoResearch Laboratories, INC. | 705-165-147 |
| Cy™5 AffiniPure Donkey Anti-Goat IgG (H+L) | Jackson ImmunoResearch Laboratories, INC. | 705-175-147 |
| Fluorescein (FITC) AffiniPure Donkey Anti-Rat IgG (H+L) | Jackson ImmunoResearch Laboratories, INC. | 712-095-153 |
| Cy™3 AffiniPure Donkey Anti-Rat IgG (H+L) | Jackson ImmunoResearch Laboratories, INC. | 712-165-153 |
| Fluorescein (FITC) AffiniPure Donkey Anti-Guinea Pig IgG (H+L) | Jackson ImmunoResearch Laboratories, INC. | 706-095-148 |
| Cy™3 AffiniPure Donkey Anti-Guinea Pig IgG (H+L) | Jackson ImmunoResearch Laboratories, INC. | 706-165-148 |
| Bacterial and Virus Strains | ||
| AAV1.CAGGS.flex.ChR2-tdTomato.WPRE.SV40 | University of Pennsylvania Vector Core | AV-1-18917P |
| AAVrh 10.CAG GS.flex.ChR2.tdTomato.WPRE.SV40 | University of Pennsylvania Vector Core | AV-10-18917P |
| AAV1 rh.CAG.Flex.eGFP.WPRE.bGH | University of Pennsylvania Vector Core | AV-1-ALL854 |
| AAV1.Syn.Flex.GCaMP6s.WPRE.SV40 | University of Pennsylvania Vector Core | AV-1-PV2821 |
| AAV-fDIO-Cre-GFP | University of Pennsylvania Vector Core Custom preparation, (Penzo et al., 2015) | N/A |
| pAAV-hSyn-DIO-hM4d(Gi)-mCherry | (Krashes et al., 2011) | Addgene,44362 |
| Chemicals, Peptides, and Recombinant Proteins | ||
| Ketoprofen | Santa Cruz Animal Health | sc-363115Rx |
| Formalin | Sigma-Aldrich | HT50-1-2 |
| Morphine | Sigma-Aldrich | M8777 |
| Freund's Adjuvant, Complete | Sigma-Aldrich | F5881 |
| Lithium chloride | Sigma Aldrich | L9650-100G |
| Clozapine-N-Oxide | Tocris | 4936 |
| Neuropeptide Y | Tocris | 1153 |
| Muscimol | Tocris | 0289 |
| Baclofen | Tocris | 0417 |
| SHU-9119 | Tocris | 3420 |
| BIBO 3304 | Tocris | 2412 |
| Saclofen | Sigma-Aldrich | 14343 |
| Bicuculline | Sigma-Aldrich | S166 |
| Experimental Models: Cell Lines | ||
| ES cells: 129S6 × C57BL/6J F1 hybrid | Dr. Adam Hantman This paper | N/A |
| Experimental Models: Organisms/Strains | ||
| Mouse: Agrp-Ires-cre, Agrptm1(cre)Lowl/J | The Jackson Laboratory | 012899 |
| Mouse: Ai32, B6;129S-Gt(ROSA)26Sortm32(CAG-COP4*H134R/EYFP)Hze/J | The Jackson Laboratory | 012569 |
| Mouse: R26-LSL-Gi-DREADD, B6N.129-Gt(ROSA)26Sortm1(CAG-CHRM4*,-mCitrine)/Ute/J | The Jackson Laboratory | 026219 |
| Mouse: VGlut2-IRES-FlpO | Dr. Adam Hantman This paper | N/A |
| Mouse: Gad2-IRES-FlpO | Dr. Adam Hantman This paper | N/A |
| Mouse: C57BL/6J | The Jackson Laboratory | 000664 |
| Oligonucleotides | ||
| Please see Table S3 | ||
| Software and Algorithms | ||
| SigmaPlot | Systat Software | http://systatoftware.com |
| STATISTICA | StatSoft | www.statsoft.com |
| ANY-Maze | Stoelting | http://www.anymaze.co.uk/index.htm |
| MATLAB 2016a | MathWorks | https://www.mathworks.com/product/matlab.html |
| Synapse | Tucker-Davis Technologies | http://www.tdt.com/Synapse/index.html |
| Other | ||
| Microliter syringe pump, PHD Ultra | Harvard Apparatus | 703007 |
| Optogenetic fiber | ThorLabs | FT200UMT |
| 1.25 mm ceramin ferrules | ThorLabs | CFLC230-10 |
| Guide cannulae | Plastics One | 8IC315GS5SPC |
| Internal cannulae | Plastics One | 8IC315IS5SPC |
| Dummy cannulae | Plastics One | 8IC315DCSXXC |
| Dental cement | Lang Dental Manufacturing | B1306,143069 |
| Bone screws | Basi | MF-5182 |
| Optic fibers | Doric | MF2.5, 400/430-0.48 |
| 405 nm LED | ThorLabs | M405F1 |
| 490 nm LED | ThorLabs | M470F3 |
| Amplifier | Tucker-Davis Technology | RZ5P |
| Femtowatt photoreceiver | Newport | 2151 |
Highlights.
Hunger attenuates inflammatory pain without influencing acute pain responses.
Hunger-sensitive AgRP neurons project to the PBN to suppress inflammatory pain.
Neuropeptide Y signaling in the PBN attenuates inflammatory pain during hunger.
Acknowledgments
This research was funded by the University of Pennsylvania School of Arts and Sciences (J.N.B.), AHA 17SDG33400158 (J.N.B.), the Whitehall Foundation (J.N.B), NIH- 1R01DK1114104 (J.N.B), NIH-2T32DK7314-36 (A.L.A), NIH-F32DK112561-01 (A.L.A.) and NIH-R01DK112812 (B.C.D.). We thank S. Pulido, B. Jannuzi, O. Park, C. Shin, K. Patel, I. Cogdell, R. Ly, O. Green and P. Ehmann for experimental assistance, and S. Sternson, H. Grill, M. Schmidt and A. Chen for comments on the manuscript.
Footnotes
Publisher's Disclaimer: This is a PDF file of an unedited manuscript that has been accepted for publication. As a service to our customers we are providing this early version of the manuscript. The manuscript will undergo copyediting, typesetting, and review of the resulting proof before it is published in its final citable form. Please note that during the production process errors may be discovered which could affect the content, and all legal disclaimers that apply to the journal pertain.
Author Contributions
A.L.A. and J.N.B. initiated the project and prepared the manuscript with comments from all authors. A.L.A., Z.S., E.H., M.L.K. R.A.H., B.C.D. and J.N.B. designed experiments and analyzed data. C.G. and A.W.H. developed FlpO mice. A.L.A., Z.S., E.H., M.L.K. S.Z.P., R.A.H., and J.N.B. performed experiments.
Declaration of Interests
The authors declare no competing interests.
References
- Alhadeff AL, Golub D, Hayes MR, Grill HJ. Peptide YY signaling in the lateral parabrachial nucleus increases food intake through the Y1 receptor. American journal of physiology Endocrinology and metabolism. 2015;309:E759–766. doi: 10.1152/ajpendo.00346.2015. [DOI] [PMC free article] [PubMed] [Google Scholar]
- Alhadeff AL, Holland RA, Zheng H, Rinaman L, Grill HJ, De Jonghe BC. Excitatory Hindbrain-Forebrain Communication Is Required for Cisplatin-Induced Anorexia and Weight Loss. J Neurosci. 2017;37:362–370. doi: 10.1523/JNEUROSCI.2714-16.2016. [DOI] [PMC free article] [PubMed] [Google Scholar]
- Andermann ML, Lowell BB. Toward a Wiring Diagram Understanding of Appetite Control. Neuron. 2017;95:757–778. doi: 10.1016/j.neuron.2017.06.014. [DOI] [PMC free article] [PubMed] [Google Scholar]
- Aponte Y, Atasoy D, Sternson SM. AGRP neurons are sufficient to orchestrate feeding behavior rapidly and without training. Nature neuroscience. 2011;14:351–355. doi: 10.1038/nn.2739. [DOI] [PMC free article] [PubMed] [Google Scholar]
- Atasoy D, Betley JN, Su HH, Sternson SM. Deconstruction of a neural circuit for hunger. Nature. 2012;488:172–177. doi: 10.1038/nature11270. [DOI] [PMC free article] [PubMed] [Google Scholar]
- Baulmann J, Spitznagel H, Herdegen T, Unger T, Culman J. Tachykinin receptor inhibition and c- Fos expression in the rat brain following formalin-induced pain. Neuroscience. 2000;95:813–820. doi: 10.1016/s0306-4522(99)00478-9. [DOI] [PubMed] [Google Scholar]
- Betley JN, Cao ZF, Ritola KD, Sternson SM. Parallel, redundant circuit organization for homeostatic control of feeding behavior. Cell. 2013;155:1337–1350. doi: 10.1016/j.cell.2013.11.002. [DOI] [PMC free article] [PubMed] [Google Scholar]
- Betley JN, Wright CV, Kawaguchi Y, Erdelyi F, Szabo G, Jessell TM, Kaltschmidt JA. Stringent specificity in the construction of a GABAergic presynaptic inhibitory circuit. Cell. 2009;139:161–174. doi: 10.1016/j.cell.2009.08.027. [DOI] [PMC free article] [PubMed] [Google Scholar]
- Betley JN, Xu S, Cao ZF, Gong R, Magnus CJ, Yu Y, Sternson SM. Neurons for hunger and thirst transmit a negative-valence teaching signal. Nature. 2015;521:180–185. doi: 10.1038/nature14416. [DOI] [PMC free article] [PubMed] [Google Scholar]
- Bodnar R, Kelly D, Spiaggia A, Glusman M. Biphasic alterations of nociceptive thresholds induced by food deprivation. Physiological Psychology. 1978;6:391–395. [Google Scholar]
- Bodnar RJ, Kelly DD, Spiaggia A, Glusman M. Analgesia Produced by Cold-Water Stress - Effect of Naloxone. Federation proceedings. 1977;36:1010–1010. [Google Scholar]
- Bodnar RJ, Kelly DD, Spiaggia A, Glusman M. Biphasic Alterations of Nociceptive Thresholds Induced by Food-Deprivation. Physiological Psychology. 1978a;6:391–395. [Google Scholar]
- Bodnar RJ, Kelly DD, Steiner SS, Glusman M. Stress-produced analgesia and morphine-produced analgesia: lack of cross-tolerance. Pharmacology, biochemistry, and behavior. 1978b;8:661–666. doi: 10.1016/0091-3057(78)90263-0. [DOI] [PubMed] [Google Scholar]
- Burnett CJ, Li C, Webber E, Tsaousidou E, Xue SY, Bruning JC, Krashes MJ. Hunger-Driven Motivational State Competition. Neuron. 2016;92:187–201. doi: 10.1016/j.neuron.2016.08.032. [DOI] [PMC free article] [PubMed] [Google Scholar]
- Campos CA, Bowen AJ, Schwartz MW, Palmiter RD. Parabrachial CGRP Neurons Control Meal Termination. Cell metabolism. 2016;23:811–820. doi: 10.1016/j.cmet.2016.04.006. [DOI] [PMC free article] [PubMed] [Google Scholar]
- Carey LM, Gutierrez T, Deng L, Lee WH, Mackie K, Hohmann AG. Inflammatory and Neuropathic Nociception is Preserved in GPR55 Knockout Mice. Sci Rep. 2017;7:944. doi: 10.1038/s41598-017-01062-2. [DOI] [PMC free article] [PubMed] [Google Scholar]
- Carter ME, Soden ME, Zweifel LS, Palmiter RD. Genetic identification of a neural circuit that suppresses appetite. Nature. 2013;503:111–114. doi: 10.1038/nature12596. [DOI] [PMC free article] [PubMed] [Google Scholar]
- Chen Y, Lin YC, Kuo TW, Knight ZA. Sensory detection of food rapidly modulates arcuate feeding circuits. Cell. 2015;160:829–841. doi: 10.1016/j.cell.2015.01.033. [DOI] [PMC free article] [PubMed] [Google Scholar]
- Coderre TJ, Vaccarino AL, Melzack R. Central nervous system plasticity in the tonic pain response to subcutaneous formalin injection. Brain Res. 1990;535:155–158. doi: 10.1016/0006-8993(90)91835-5. [DOI] [PubMed] [Google Scholar]
- Deyama S, Yamamoto J, Machida T, Tanimoto S, Nakagawa T, Kaneko S, Satoh M, Minami M. Inhibition of glutamatergic transmission by morphine in the basolateral amygdaloid nucleus reduces pain-induced aversion. Neurosci Res. 2007;59:199–204. doi: 10.1016/j.neures.2007.06.1473. [DOI] [PubMed] [Google Scholar]
- Dietrich MO, Zimmer MR, Bober J, Horvath TL. Hypothalamic Agrp neurons drive stereotypic behaviors beyond feeding. Cell. 2015;160:1222–1232. doi: 10.1016/j.cell.2015.02.024. [DOI] [PMC free article] [PubMed] [Google Scholar]
- Dubuisson D, Dennis SG. The formalin test: a quantitative study of the analgesic effects of morphine, meperidine, and brain stem stimulation in rats and cats. Pain. 1977;4:161–174. doi: 10.1016/0304-3959(77)90130-0. [DOI] [PubMed] [Google Scholar]
- Essner RA, Smith AG, Jamnik AA, Ryba AR, Trutner ZD, Carter ME. AgRP Neurons Can Increase Food Intake during Conditions of Appetite Suppression and Inhibit Anorexigenic Parabrachial Neurons. J Neurosci. 2017;37:8678–8687. doi: 10.1523/JNEUROSCI.0798-17.2017. [DOI] [PMC free article] [PubMed] [Google Scholar]
- Grill HJ. Distributed neural control of energy balance: contributions from hindbrain and hypothalamus. Obesity. 2006;14(Suppl 5):216S–221S. doi: 10.1038/oby.2006.312. [DOI] [PubMed] [Google Scholar]
- Gunaydin LA, Grosenick L, Finkelstein JC, Kauvar IV, Fenno LE, Adhikari A, Lammel S, Mirzabekov JJ, Airan RD, Zalocusky KA, et al. Natural neural projection dynamics underlying social behavior. Cell. 2014;157:1535–1551. doi: 10.1016/j.cell.2014.05.017. [DOI] [PMC free article] [PubMed] [Google Scholar]
- Hamm RJ, Lyeth BG. Nociceptive thresholds following food restriction and return to free-feeding. Physiol Behav. 1984;33:499–501. doi: 10.1016/0031-9384(84)90176-8. [DOI] [PubMed] [Google Scholar]
- Hargraves WA, Hentall ID. Analgesic effects of dietary caloric restriction in adult mice. Pain. 2005;114:455–461. doi: 10.1016/j.pain.2005.01.010. [DOI] [PubMed] [Google Scholar]
- Higgs S, Cooper SJ. Hyperphagia induced by direct administration of midazolam into the parabrachial nucleus of the rat. Eur J Pharmacol. 1996;313:1–9. doi: 10.1016/0014-2999(96)00446-3. [DOI] [PubMed] [Google Scholar]
- Hnasko TS, Chuhma N, Zhang H, Goh GY, Sulzer D, Palmiter RD, Rayport S, Edwards RH. Vesicular glutamate transport promotes dopamine storage and glutamate corelease in vivo. Neuron. 2010;65:643–656. doi: 10.1016/j.neuron.2010.02.012. [DOI] [PMC free article] [PubMed] [Google Scholar]
- Hunskaar S, Hole K. The formalin test in mice: dissociation between inflammatory and non-inflammatory pain. Pain. 1987;30:103–114. doi: 10.1016/0304-3959(87)90088-1. [DOI] [PubMed] [Google Scholar]
- Jikomes N, Ramesh RN, Mandelblat-Cerf Y, Andermann ML. Preemptive Stimulation of AgRP Neurons in Fed Mice Enables Conditioned Food Seeking under Threat. Curr Biol. 2016;26:2500–2507. doi: 10.1016/j.cub.2016.07.019. [DOI] [PMC free article] [PubMed] [Google Scholar]
- Johansen JP, Fields HL. Glutamatergic activation of anterior cingulate cortex produces an aversive teaching signal. Nat Neurosci. 2004;7:398–403. doi: 10.1038/nn1207. [DOI] [PubMed] [Google Scholar]
- Jonas P, Bischofberger J, Sandkuhler J. Corelease of two fast neurotransmitters at a central synapse. Science. 1998;281:419–424. doi: 10.1126/science.281.5375.419. [DOI] [PubMed] [Google Scholar]
- Keys A. Experimental Human Starvation - General and Metabolic Results of a Loss of One 4th the Body Weight in 6 Months. Fed Proc. 1946;5:55–55. [PubMed] [Google Scholar]
- Krashes MJ, Koda S, Ye C, Rogan SC, Adams AC, Cusher DS, Maratos-Flier E, Roth BL, Lowell BB. Rapid, reversible activation of AgRP neurons drives feeding behavior in mice. J Clin Invest. 2011;121:1424–1428. doi: 10.1172/JCI46229. [DOI] [PMC free article] [PubMed] [Google Scholar]
- LaGraize SC, Borzan J, Rinker MM, Kopp JL, Fuchs PN. Behavioral evidence for competing motivational drives of nociception and hunger. Neurosci Lett. 2004;372:30–34. doi: 10.1016/j.neulet.2004.09.008. [DOI] [PubMed] [Google Scholar]
- Lein ES, Hawrylycz MJ, Ao N, Ayres M, Bensinger A, Bernard A, Boe AF, Boguski MS, Brockway KS, Byrnes EJ, et al. Genome-wide atlas of gene expression in the adult mouse brain. Nature. 2007;445:168–176. doi: 10.1038/nature05453. [DOI] [PubMed] [Google Scholar]
- Lerner TN, Shilyansky C, Davidson TJ, Evans KE, Beier KT, Zalocusky KA, Crow AK, Malenka RC, Luo L, Tomer R, et al. Intact-Brain Analyses Reveal Distinct Information Carried by SNc Dopamine Subcircuits. Cell. 2015;162:635–647. doi: 10.1016/j.cell.2015.07.014. [DOI] [PMC free article] [PubMed] [Google Scholar]
- Li H, Penzo MA, Taniguchi H, Kopec CD, Huang ZJ, Li B. Experience-dependent modification of a central amygdala fear circuit. Nat Neurosci. 2013;16:332–339. doi: 10.1038/nn.3322. [DOI] [PMC free article] [PubMed] [Google Scholar]
- Liu P, Jenkins NA, Copeland NG. A highly efficient recombineering-based method for generating conditional knockout mutations. Genome research. 2003;13:476–484. doi: 10.1101/gr.749203. [DOI] [PMC free article] [PubMed] [Google Scholar]
- Loeser JD. Relieving pain in America. Clin J Pain. 2012;28:185–186. doi: 10.1097/AJP.0b013e318230f6c1. [DOI] [PubMed] [Google Scholar]
- Luquet S, Perez FA, Hnasko TS, Palmiter RD. NPY/AgRP neurons are essential for feeding in adult mice but can be ablated in neonates. Science. 2005;310:683–685. doi: 10.1126/science.1115524. [DOI] [PubMed] [Google Scholar]
- Madisen L, Mao T, Koch H, Zhuo JM, Berenyi A, Fujisawa S, Hsu YW, Garcia AJ, 3rd, Gu X, Zanella S, et al. A toolbox of Cre-dependent optogenetic transgenic mice for light-induced activation and silencing. Nature neuroscience. 2012;15:793–802. doi: 10.1038/nn.3078. [DOI] [PMC free article] [PubMed] [Google Scholar]
- Mandelblat-Cerf Y, Ramesh RN, Burgess CR, Patella P, Yang Z, Lowell BB, Andermann ML. Arcuate hypothalamic AgRP and putative POMC neurons show opposite changes in spiking across multiple timescales. eLife. 2015;4 doi: 10.7554/eLife.07122. [DOI] [PMC free article] [PubMed] [Google Scholar]
- Marchand F, Perretti M, McMahon SB. Role of the immune system in chronic pain. Nat Rev Neurosci. 2005;6:521–532. doi: 10.1038/nrn1700. [DOI] [PubMed] [Google Scholar]
- Martins-Oliveira M, Akerman S, Tavares I, Goadsby PJ. Neuropeptide Y inhibits the trigeminovascular pathway through NPY Y1 receptor: implications for migraine. Pain. 2016;157:1666–1673. doi: 10.1097/j.pain.0000000000000571. [DOI] [PMC free article] [PubMed] [Google Scholar]
- Miller LR, Cano A. Comorbid chronic pain and depression: who is at risk? J Pain. 2009;10:619–627. doi: 10.1016/j.jpain.2008.12.007. [DOI] [PubMed] [Google Scholar]
- Mu D, Deng J, Liu KF, Wu ZY, Shi YF, Guo WM, Mao QQ, Liu XJ, Li H, Sun YG. A central neural circuit for itch sensation. Science. 2017;357:695–699. doi: 10.1126/science.aaf4918. [DOI] [PubMed] [Google Scholar]
- Naveilhan P, Hassani H, Lucas G, Blakeman KH, Hao JX, Xu XJ, Wiesenfeld-Hallin Z, Thoren P, Ernfors P. Reduced antinociception and plasma extravasation in mice lacking a neuropeptide Y receptor. Nature. 2001;409:513–517. doi: 10.1038/35054063. [DOI] [PubMed] [Google Scholar]
- Padilla SL, Qiu J, Soden ME, Sanz E, Nestor CC, Barker FD, Quintana A, Zweifel LS, Ronnekleiv OK, Kelly MJ, et al. Agouti-related peptide neural circuits mediate adaptive behaviors in the starved state. Nat Neurosci. 2016;19:734–741. doi: 10.1038/nn.4274. [DOI] [PMC free article] [PubMed] [Google Scholar]
- Pavlov IP, Fol′bort GV. Die höchste Nerventätigkeit (das Verhalten) von Tieren. Eine zwanzigjährige Prüfung der objektiven Forschung ; Bedingte Reflexe. In: Volbroth von G., editor. Sammlung von Artikeln, Berichten, Vorlesungen und Reden, 3. Aufl., übers. München: J. F. Bergmann; 1926. [Google Scholar]
- Penzo MA, Robert V, Tucciarone J, De Bundel D, Wang M, Van Aelst L, Darvas M, Parada LF, Palmiter RD, He M, et al. The paraventricular thalamus controls a central amygdala fear circuit. Nature. 2015;519:455–459. doi: 10.1038/nature13978. [DOI] [PMC free article] [PubMed] [Google Scholar]
- Pollatos O, Herbert BM, Fustos J, Weimer K, Enck P, Zipfel S. Food Deprivation Sensitizes Pain Perception. J Psychophysiol. 2012;26:1–9. [Google Scholar]
- Price DD. Psychological and neural mechanisms of the affective dimension of pain. Science. 2000;288:1769–1772. doi: 10.1126/science.288.5472.1769. [DOI] [PubMed] [Google Scholar]
- Skibicka KP, Grill HJ. Hypothalamic and hindbrain melanocortin receptors contribute to the feeding, thermogenic, and cardiovascular action of melanocortins. Endocrinology. 2009;150:5351–5361. doi: 10.1210/en.2009-0804. [DOI] [PMC free article] [PubMed] [Google Scholar]
- Solway B, Bose SC, Corder G, Donahue RR, Taylor BK. Tonic inhibition of chronic pain by neuropeptide Y. Proc Natl Acad Sci U S A. 2011;108:7224–7229. doi: 10.1073/pnas.1017719108. [DOI] [PMC free article] [PubMed] [Google Scholar]
- Stanley BG, Leibowitz SF. Neuropeptide Y injected in the paraventricular hypothalamus: a powerful stimulant of feeding behavior. Proc Natl Acad Sci U S A. 1985;82:3940–3943. doi: 10.1073/pnas.82.11.3940. [DOI] [PMC free article] [PubMed] [Google Scholar]
- Sternson SM, Eiselt AK. Three Pillars for the Neural Control of Appetite. Annu Rev Physiol. 2017;79:401–423. doi: 10.1146/annurev-physiol-021115-104948. [DOI] [PubMed] [Google Scholar]
- Su Z, Alhadeff AL, Betley JN. Nutritive, Post-ingestive Signals Are the Primary Regulators of AgRP Neuron Activity. Cell reports. 2017;21:2724–2736. doi: 10.1016/j.celrep.2017.11.036. [DOI] [PMC free article] [PubMed] [Google Scholar]
- Tinbergen N. The study of instinct. Oxford Eng.: Clarendon Press; 1951. [Google Scholar]
- Tong Q, Ye CP, Jones JE, Elmquist JK, Lowell BB. Synaptic release of GABA by AgRP neurons is required for normal regulation of energy balance. Nature neuroscience. 2008;11:998–1000. doi: 10.1038/nn.2167. [DOI] [PMC free article] [PubMed] [Google Scholar]
- Wang JZ, Lundeberg T, Yu LC. Anti-nociceptive effect of neuropeptide Y in periaqueductal grey in rats with inflammation. Brain research. 2001;893:264–267. doi: 10.1016/s0006-8993(00)03279-0. [DOI] [PubMed] [Google Scholar]
- Wu Q, Boyle MP, Palmiter RD. Loss of GABAergic signaling by AgRP neurons to the parabrachial nucleus leads to starvation. Cell. 2009;137:1225–1234. doi: 10.1016/j.cell.2009.04.022. [DOI] [PMC free article] [PubMed] [Google Scholar]
- Zhu H, Aryal DK, Olsen RH, Urban DJ, Swearingen A, Forbes S, Roth BL, Hochgeschwender U. Cre dependent DREADD (designer receptors exclusively activated by designer drugs) mice. Genesis. 2016 doi: 10.1002/dvg.22949. [DOI] [PMC free article] [PubMed] [Google Scholar]
Associated Data
This section collects any data citations, data availability statements, or supplementary materials included in this article.
Supplementary Materials
(A) Experimental timeline for effects of an anti-inflammatory analgesic (ketoprofen) on the formalin test. (B) Inflammatory phase formalin-induced paw licking (time) in i.p. saline- (n=5) and ketoprofen-(n=6) treated mice (unpaired t-test, p<0.01). (C) Inflammatory phase formalin-induced lick bouts in saline- and ketoprofen-treated mice (unpaired t-test, p<0.01). (D) Acute phase formalin-induced paw licking (time) in saline- and ketoprofen-treated mice (unpaired t-test, p=ns). (E) Acute phase formalin-induced lick bouts in saline- and ketoprofen-treated mice (unpaired t-test, p=ns). (F) Experimental timeline for effects of morphine on the hotplate test. (G) Latency to paw withdrawal from 52°C hotplate before and 30 min post i.p. saline injection (paired t-test, p=ns). (H) Latency to paw withdrawal from hotplate before and 30 min post i.p. morphine injection (paired t-test, p<0.01). (I) Experimental design: 24 h food deprived mice were injected with saline or formalin in their hindpaw and change in paw circumference was measured 30 min post-injection. (J) Change in paw circumference in food deprived saline- (n=6) and formalin-(n=9) injected mice (unpaired t-test, p<0.01). Data are expressed as mean ± SEM, ns p>0.05, ttests: **p<0.01.
(A) Experimental design: Laser light pulses delivered to AgRP neurons of AgRPGFP and AgRPChR2 mice began 10 min before formalin injection and continued while formalin-induced paw licking was quantified. (B) Inflammatory phase formalin-induced lick bouts in AgRPGFP and AgRPChR2 mice (unpaired t-test, p<0.01). (C) Laser stimulation-induced food intake (y-axis) correlates with inflammatory phase paw licking (x-axis); AgRPGFP (grey circles, n=12), AgRPChR2 (blue circles, n=12), red circles are group averages (Pearson regression, R=0.60, p<0.01). (D) Time spent paw licking during acute phase of formalin test in AgRPGFP and AgRPChR2 mice (unpaired t-test, p=ns) (E) Acute phase formalin-induced lick bouts in AgRPGFP and AgRPChR2 mice (unpaired t-test, p=ns). (F) Experimental design: AgRPGFP and AgRPChR2 mice were injected with Complete Freund’s Adjuvant (CFA) after a baseline Von Frey test. Mice underwent additional Von Frey tests at 3h, 24 h, and 48 h post-CFA injection, with 1 h of laser stimulation before each test. (G) Percentage withdrawal from Von Frey Filaments before and 3 h, 24 h, and 48 h post-CFA injection in AgRPGFP mice (n=6, two-way repeated measures ANOVA, p<0.001). (H) Percentage withdrawal from Von Frey Filaments before and 3 h, 24 h, and 48 h post-CFA injection in AgRPChR2 mice (n=9, two-way repeated measures ANOVA, p=ns). (I) Latency to withdraw paw from hotplate during AgRP neuron stimulation in AgRPChR2 mice (n=12, repeated-measures one-way ANOVA, p=ns). (J) Normalized latency to withdraw paw from hotplate in AgRPGFP and AgRPChR2 mice after 45 min of laser stimulation (unpaired t-test, p=ns). (K) Time spent licking paw in AgRPGFP (n=12) and AgRPChR2 (n=12) mice with laser stimulation following saline paw injection (two-way repeated measures ANOVA, p=ns). (L) Inflammatory phase paw licking (time) in AgRPGFP and AgRPChR2 mice during laser stimulation following saline paw injection (unpaired t-tests, p=ns). (M) Acute phase paw licking (time) in AgRPGFP and AgRPChR2 mice during laser stimulation following saline paw injection (unpaired t-tests, p=ns). Data are expressed as mean ± SEM, ns p>0.05, t-tests and post-hoc comparisons: *p<0.05, **p<0.01, ***p<0.001; ANOVA interaction: ∞p<0.05, ∞∞∞p<0.001; ANOVA main effect of drug: ☼☼☼p<0.001.
(A) Schematics of target brain regions and representative images of formalin-induced Fos underlying AgRP axon projections in the BNST, PVT, PVH, LH, CeA, PAG, and PBN. Scale bar, 150 µm. (B) Representative images of fiber placements (indicated in white dotted lines. Scale bar, 1 mm. (C) Diagram of the major AgRP neuron projection subpopulations analyzed. (D) Food intake (1 h) in ad libitum fed mice with (+, colored bars) and without (−, grey bars) laser stimulation of AgRP axons (n=9–12/target region, paired t-test with Bonferroni correction, BNST and PVH p<0.001; LH p<0.01, PVT p<0.05; CeA, PAG, PBN p=ns). (E) Inflammatory phase formalin-induced lick bouts with (+, colored bars) and without (−, grey bars) AgRP neuron stimulation of discrete AgRP projection subpopulations (n=9–12/target region, paired t-tests with Bonferroni correction, all ps=ns except for PBN, p<0.001). (F) Acute phase formalin-induced paw licking (time) in AgRP→PBNChR2 mice (n=5) following 40 min of laser stimulation compared to stimulation of AgRP→PBNGFP mice (n=12) (unpaired t-test, p=ns). (G) Total distance traveled in AgRP→PBNChR2 mice (n=5) with and without 30 min laser stimulation (unpaired t-test, p=ns). (H) Time spent immobile in AgRP→PBNChR2 mice (n=5) with and without 30 min laser stimulation (unpaired t-test, p=ns). (I) Acute phase formalin-induced paw licking (time) during light pulse delivery in AgRP→PBNGFP mice (n=12, paired t-test, p=ns). (J) Inflammatory phase formalin-induced paw licking (time) during light pulse delivery in AgRP→PBNGFP mice (n=12, paired t-test, p=ns). (K) Latency to paw withdrawal from 52°C hotplate during light pulse delivery in AgRP→PBNGFP mice (n=12, one-way ANOVA, p=ns). Data are expressed as mean ± SEM, ns p>0.05, *p<0.05, **p<0.01, ***p<0.001.
(A) Schematic and representative image demonstrating formalin-induced Fos and AgRP axons in the lateral PBN (lPBN). (B) Food intake (1 h) following PBN microinjection of vehicle, NPY, an AgRP analogue, or GABA agonists (n=8, one-way repeated measures ANOVA, p=ns). (C) Schematic showing center of injection sites for mice injected with NPY in the lPBN (closed circles) or the locus coeruleus (LC) area (open circles). (D) Time spent licking paw in LC vehicle- (n=5) or NPY (n=5) -injected mice (two-way repeated measures ANOVA, p=ns). (E) Inflammatory phase paw licking (time) in LC vehicle- (n=5) or NPY (n=5) -injected mice (unpaired t-tests, p=ns). (F) Acute phase paw licking (time) in LC vehicle- (n=5) or NPY (n=5) - injected mice (unpaired t-tests, p=ns). (G) Top, Experimental design: Laser stimulation was initiated 25 min post-formalin injection and lasted for the duration of the test. Bottom, graph: formalin-induced paw licking (time) with the onset of AgRP→PBN neuron activity in AgRP→PBNChR2 mice (n=12); traces of pain responses with and without AgRP→PBNChR2 stimulation for the entire session are indicated in dotted lines for reference. (H) Top, Experimental design: Laser stimulation was initiated 10 min before formalin injection and terminated 25 min post-injection. Bottom, graph: formalin-induced paw licking (time) with the offset of AgRP→PBN neuron activity in AgRP→PBNChR2 mice (n=7); traces of pain responses with and without AgRP→PBNChR2 stimulation for the entire session are indicated in dotted lines for reference. (I) Time spent responding to inflammatory pain following the onset or offset of laser stimulation (25–45 min post-injection). Inflammatory phase pain responses after the onset (magenta) and offset (purple) of AgRP→PBNChR2 stimulation are compared to the inflammatory responses with and without AgRP→PBNChR2 stimulation (unpaired t-tests with Bonferroni correction, stimulation vs. onset/offset vs. no stimulation, all ps<0.01). Data are expressed as mean ± SEM, ns p>0.05, t-tests: **p<0.01, ***p<0.001
(A) Genomic structure of genetically modified Gad2 allele. (B) Genomic structure of genetically modified VGlut2 allele. (C) Strategy for expressing hM4D in Gad2 and VGlut2 PBN neurons: A FlpO-dependent rAAV expressing Cre was combined with a Cre-dependent rAAV expressing hM4D as in (Li et al., 2013), allowing for the expression of hM4D in Gad2+ and VGlut2+ lPBN neurons. These neurons were inhibited by i.p. injection of clozapine-N-oxide (CNO) as previously demonstrated (Mu et al., 2017). (D) Left, in situ hybridization for Gad2 and VGlut2 mRNA in the PBN [images from Allen Brain Explorer, http://mouse.brain-map.org, (Lein et al., 2007)]. Red boxes indicated region of images to the right. Scale bar, 1 mm. Right, representative images of hM4D-mCherry expression (red) in the lPBN of experimental mice. Quantification of lPBN sections revealed an average of 98.2 ± 6.4 and 194.8 ± 35.9 hM4D-expressing neurons (per unilateral section) in Gad2-IRES-FlpO (n=6) and VGlut2-IRES-FlpO mice, respectively. Scale bar, 500 µm. scp, superior cerebellar peduncle. (E) Quantification of GAD65+ or VGlut2+ boutons colabeled with mCherry in Gad2-IRES-FlpO (top) and VGlut2-IRES-FlpO (bottom) mice. (F) Time spent licking paw in control (n=5) and VGlut2hM4D (n=6) neurons after injection of CNO (two-way repeated measures ANOVA, main effect of group, p<0.01). (G) Inflammatory phase paw licking in control (n=5), Gad2hM4D (n=6) Vglut2hM4D (n=6) mice following CNO injection. Data are expressed as mean ± SEM, ns p>0.05, t-tests and posthoc comparisons: *p<0.05, **p<0.01, ***p<0.001; ANOVA main effect of group: ☼☼p<0.01.
(A) Calcium-dependent (mean, dark green; SEM, green shading) and calcium-independent (mean, dark purple; SEM, purple shading) change in fluorescence (ΔF/F) in AgRP neurons of food restricted mice (n=10) before and after chow refeeding. (B) Mean change in GCaMP6s signal (ΔF/F) before and after chow presentation (two-way repeated measures ANOVA, p<0.001). (C) GCaMP6s fluorescence changes (ΔF/F) of AgRP neurons in individual mice with saline or formalin paw injection. (D) GCaMP6s fluorescence changes (ΔF/F) in AgRP neurons of individual mice with 60 s exposure to 25°C or 52°C plate. (E) Maximum change in AgRP neuron calcium dynamics with formalin or hotplate exposure relative to activity change observed following chow presentation (n=10 25°C/52°C plate, n=8 saline/formalin injection; two-way repeated-measures ANOVA, p<0.01). Data are expressed as mean ± SEM, ns p>0.05, t-tests and post-hoc comparisons: ***p<0.001; ANOVA interaction: ∞∞p<0.01, ∞∞∞p<0.001; ANOVA main effect of pre vs. post chow presentation (Figure S6B) or ANOVA main effect of condition (Figure S6E): ☼p<0.05, ☼☼☼p<0.001.
Table S2, Related to Figures S1–S6. Statistical Analyses of Data Presented in Supplemental Figures.
Table S3, Related to Figure S5 and Key Resource Table. Oligonucleotides Used for Generation of FlpO Mice.