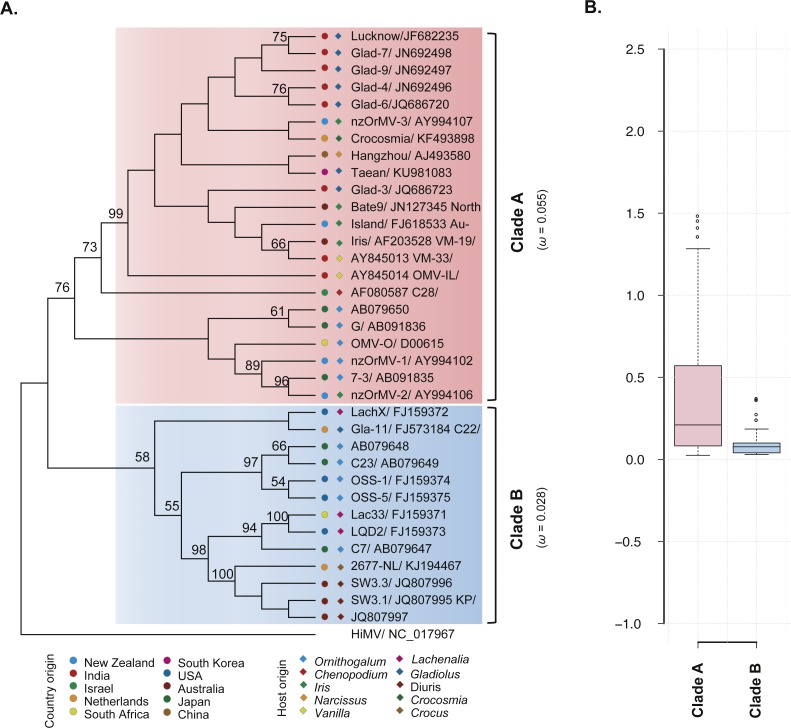
Figure 2. Evolutionary relationship of the CP gene from the 35 recombination-free OrMV isolates and comparison of dN/dS values between the two clades.
(A) ML phylogenetic tree showing genetic relationship among OrMV isolates. OrMV isolates from different regions (solid circle) and host species (diamond) are indicated by a unique color. Bootstrap percentage (BP ≥ 50%) are indicated above major branches. The distance unit is substitutions/site; (B) boxplots showing the dN/dS ratio of clade A (pink) and clade B (light blue) for the CP gene of OrMV.

