

Abstract
1. Fungal diseases are an emerging global problem affecting human health, food security and biodiversity. Ability of many fungal pathogens to persist within environmental reservoirs can increase extinction risks for host species and presents challenges for disease control. Understanding factors that regulate pathogen spread and persistence in these reservoirs is critical for effective disease management.
2. White-nose syndrome (WNS) is a disease of hibernating bats caused by Pseudogymnoascus destructans (Pd), a fungus that establishes persistent environmental reservoirs within bat hibernacula, which contribute to seasonal disease transmission dynamics in bats. However, host and environmental factors influencing distribution of Pd within these reservoirs are unknown.
3. We used model selection on longitudinally collected field data to test multiple hypotheses describing presence-absence and abundance of Pd in environmental substrates and on bats within hibernacula at different stages of WNS.
4. First detection of Pd in the environment lagged up to one year after first detection on bats within that hibernaculum. Once detected, the probability of detecting Pd within environmental samples from a hibernaculum increased over time and was higher in sediment compared to wall surfaces. Temperature had marginal effects on the distribution of Pd. For bats, prevalence and abundance of Pd were highest on Myotis lucifugus and on bats with visible signs of WNS.
5. Synthesis and applications. Our results indicate that distribution of Pseudogymnoascus destructans (Pd) within a hibernaculum is driven primarily by bats with delayed establishment of environmental reservoirs. Thus, collection of samples from Myotis lucifugus, or from sediment if bats cannot be sampled, should be prioritized to improve detection probabilities for Pd surveillance. Long-term persistence of Pd in sediment suggests that disease management for white-nose syndrome should address risks of sustained transmission from environmental reservoirs.
Keywords: white-nose syndrome, WNS, epidemiology, environmental reservoirs, temperature, Pseudogymnoascus destructans, bat hibernacula, surveillance, disease management, fungal pathogen
Introduction
Fungal diseases are increasing globally and threaten human health, food security, and biodiversity (Skerratt et al. 2007; Fisher et al. 2012). For many infectious diseases, density of available hosts regulates pathogen transmission and mortality rates (De Castro & Bolker 2005). However, pathogens with alternate reservoirs can escape host density dependence and have the potential to drive host species to extinction (McCallum & Dobson 1995). Thus, ability to survive and remain infectious in environmental reservoirs complicates efforts to control fungal pathogens. Understanding factors that regulate pathogen spread and persistence in environmental reservoirs, and how these reservoirs relate to infections in hosts, is critical for effective disease surveillance and control (Haydon et al. 2002).
White-nose syndrome (WNS) is a fungal disease of North American hibernating bats caused by Pseudogymnoascus destructans (Pd) (Blehert et al. 2009). Following presumed introduction of Pd from Eurasia (Wibbelt et al. 2010; Hoyt et al. 2016), WNS has caused rapid population declines among several species of North American bats (Frick et al. 2015). The fungus invades the skin surface of bats’ wings during hibernation (Meteyer et al. 2009; Lorch et al. 2011), resulting in altered behaviors (Reeder et al. 2012; Warnecke et al. 2012; Wilcox et al. 2014), physiological disruptions, and death of susceptible species (Cryan et al. 2010; Cryan et al. 2013; Warnecke et al. 2013; Verant et al. 2014). Since identified in New York in 2007, WNS has continued to spread across the continent changing the composition of bat communities and threatening some species with extinction (Frick et al. 2010; Thogmartin et al. 2013; Frick et al. 2015).
Pseudogymnoascus destructans is a psychrophilic fungus (Gargas et al. 2009; Minnis & Lindner 2013) that can grow on a variety of substrates (Raudabaugh & Miller 2013; Reynolds & Barton 2014) and has been detected in environments of hibernacula (caves and mines) that harbor bats affected by WNS (Lindner et al. 2011; Lorch et al. 2012; Vanderwolf, Malloch & McAlpine 2016). Additionally, Pd can persist in these environments through summer, when bats are absent, and following extirpation of a bat population by WNS (Lorch et al. 2013a). These findings indicate that environmental reservoirs of Pd within hibernacula are potential sources of infection for bats (Langwig et al. 2015b) and could increase extinction risks for bat populations by reducing dependencies on host density for Pd transmission. Environmental reservoirs also offer alternative media for Pd surveillance when collecting samples directly from bats is not possible. However, interpretation of results from environmental sampling is hindered by lack of knowledge about spatial and temporal relationships between distributions of Pd in the environment and on bats within a hibernaculum.
In this study, we compared relative effects of spatial, temporal, climatic and host factors on distribution of Pd within a hibernaculum. For environmental substrates, we hypothesized that presence-absence and abundance of Pd would be correlated with location in a hibernaculum (Vanderwolf et al. 2013), time since first detection of WNS at the site (Langwig et al. 2015a), time of year (Langwig et al. 2015b), and temperature at the sampling location (Verant et al. 2012). Additionally, we hypothesized that Pd on bats would correlate with species and temperature (Langwig et al. 2016), sex (Grieneisen et al. 2015), body condition, and visual evidence of WNS (Turner et al. 2014; Janicki et al. 2015). We tested these hypotheses using a multi-step modeling approach applied to six hibernacula at different stages of WNS, from first introduction of Pd to establishment of WNS within a bat population undergoing severe declines.
Materials and methods
Data collection
We selected six hibernacula in the eastern U.S. that harbored populations of hibernating bats at different stages of WNS (Table 1, Fig. S1). Three hibernacula with epidemic populations had either recent detections or no evidence of WNS with minimal to no observed population declines at the start of the study. Three hibernacula with endemic populations had been affected by WNS for four years or more with severe population declines. Additionally, each hibernaculum represented a range of characteristics suitable for hibernating bats (Swezey & Garrity 2011) and historically harbored over 1,000 M. lucifugus.
Table 1.
Attributes of study hibernacula.
| Site ID | County, State | Structure | Year WNS Confirmed, Status | Daily Temperature Mean °C (SD)a |
|---|---|---|---|---|
| NY1 | Albany, NY | Cave, one entrance with streams | 2008, Endemic | 5.48 (2.04) |
| NY2 | Sullivan, NY | Cave, multi-entrance and elevations with stream | 2009, Endemic | 9.32 (0.96) |
| NY3 | Ulster, NY | Limestone mine, multi-entrances, downslope to deeper areas | 2008, Endemic | 4.9 (1.91) |
| KY | Trigg, KY | Cave, multi-entrances with stream | 2011, Epidemic | 12.44 (3.34) |
| TN | Fentress, TN | Cave, multi-entrances and elevations with stream | 2013, Epidemic | 9.15 (3.22) |
| WI | Grant, WI | Lead mine, single-adit | 2014, Epidemic | 9.11 (1.53) |
Temperature was recorded using iButton data-loggers at multiple locations within all hibernacula from 2012 to 2014, and within WI, TN and KY in 2015. SD is standard deviation.
We measured temperature at 75 locations within each hibernaculum using data-loggers (iButton, model numbers DS 1923-F5# and DS 1922 L-F5#; Maxim Integrated, San Jose, CA). Data-loggers were separated equally into three sampling regions that varied by distance from the site entrance (14 to 336 m across all sites) and that encompassed historic or observed bat roosting locations. Data-loggers were installed on walls or ceilings and were assigned coordinates based on distance from the entrance of the hibernaculum (X) and height from the floor (Z). Temperature was recorded every six hours from August 2012 to August 2014 at all sites, and for an additional year (August 2014 to August 2015) at three of the sites (WI, TN, and KY). Data were downloaded every August, and any missing or malfunctioning data-loggers were replaced. Daily temperature parameters were summarized for each sampling location including mean (Tdmean), minimum (Tdmin), maximum (Tdmax), standard deviation (Tdsd) and range (Tdrange).
Environmental substrates (sediment or wall surfaces) were sampled for Pd at each data-logger location within each hibernaculum three times per year in summer (August), early hibernation (November/December), and late hibernation (March) to coincide with the hibernation phenology of bats and seasonal dynamics of WNS (Norquay & Willis 2014; Janicki et al. 2015; Langwig et al. 2015b). March sampling trips were delayed at NY1 to May, 2013 and at NY2 to June, 2013 and 2014 because of ice obstructing site entrances. Similarly, we were unable to enter NY2 in December, 2013. Wall surfaces were sampled using a sterile polyester swab (Puritan, Guilford, ME) pre-moistened with sterile water and rolled across an approximately 5-cm diameter surface within 30 cm of each data-logger (n = 69 per site). Sediment samples (n = 15 per site) were collected from a transect along the length of each region within each hibernaculum using a sterile tongue depressor (Puritan, Guilford, ME) to scrape surface sediment into a sterile sample bag (Fisher Scientific, Madison, WI).
Bats hibernating within sampling regions of each site were hand-captured during late hibernation in 2013 and 2014 (with the exception of NY2 as only a few bats were observed during the study); at the WI site, bats were also sampled in 2015. Sampled species included M. lucifugus, tri-colored bats Perimyotis subflavus and Indiana bats Myotis sodalis because they were present within the hibernacula and are susceptible to WNS. A total of 15 to 72 bats roosting within 2 m of a data-logger were sampled per site each year. Bats were sampled for Pd using a sterile pre-moistened nylon-flocked swab (Puritan Purflock® Micro Ultrafine Tip) gently rolled along the right forearm and 1-cm strip of adjacent wing tissue three times each on the dorsal and ventral surfaces. The dorsal surface of the extended right wing was then examined under a hand-held UV light (385 nm) for fluorescence characteristic of WNS (Turner et al. 2014). A UV score (a qualitative estimate for the extent of WNS pathology) was determined for each bat based on the estimated proportion of wing surface exhibiting fluorescence [0 (0%), 1 (<25%), 2 (<50%), 3 (<75%), 4 (> 75%)]. A similar scoring system was applied to the amount of visible fungus on the extended wing. Sex and species were recorded for each bat, and weight and forearm length were measured to calculate body mass index [BMI; mass (g)/forearm length (mm)] (Chappell & Titman 1983).
All samples were stored at approximately 4 °C during transport, then frozen at −80 °C. Samples were analyzed for Pd using the intergenic spacer- (IGS-) based quantitative PCR (qPCR) assay (Muller et al. 2013) following optimized protocols (Verant et al. 2016). Duplicate standard curves of genomic DNA of Pd were included on each reaction plate to quantify Pd in each sample.
Bats were handled in accordance with protocols approved by the Institutional Animal Care and Use Committee of the U.S. Geological Survey National Wildlife Health Center and permits from collaborating management agencies. The National White-Nose Syndrome Decontamination protocol (U.S. Fish and Wildlife Service 2012) was followed for each site visit.
Model Selection
We used a candidate model selection approach (Bolker et al. 2009; Zuur et al. 2009) to evaluate multiple a priori hypotheses describing the distribution of Pd within hibernacula (Table 2). This modelling framework reduces the number of competing models and the likelihood of type-1 error. With this approach, the best fit models highlight important correlates of Pd distribution within a hibernaculum and are not intended to optimize predictive power. Due to loss or malfunction of data-loggers, paired temperature measurements were not available for all samples. Thus, we used a two-stage model selection approach where we compared all but climate models using the full dataset, then compared the best-fit model to alternative models using a subset dataset, which included temperature data for the sample location. We only included mean and range of daily temperatures in models for the day the sample was collected due to collinearity with other temperature parameters. For environmental samples we compared four models with the full dataset (Table S1) and four models using the subset dataset (Table 3). For bat samples, we compared eight models with the full dataset (Table 4) and eight models with the subset dataset (Table S2).
Table 2.
Candidate models used to evaluate hypotheses describing presence-absence or abundance of Pseudogymnoascus destructans within hibernacula (sites).
| Model | Covariate | Description |
|---|---|---|
| Environment | ||
| Spatial | X | Distance from the entrance |
| Z | Height from the floor | |
| Type | Sediment or wall-swab | |
| Temporal | WNStime | Time since first confirmation of WNS in bats at the site. Each unit coincides with a sampling interval (approximately every four months). |
| Time of year | Time of year sample was collected; early hibernation, late hibernation, summer | |
| Climate | Tdmean | Daily mean temperature |
| Tdrange | Daily temperature range | |
| Bats | ||
| Spatial | Regiona | Sampling region within the site (near entrance, middle, deep) |
| Zb | Height from the floor | |
| Temporal | WNSWintersc | Winters since first confirmation of WNS in bats at a site |
| Climate | Tdmean | Daily mean temperature within 2 m of roost location |
| Tdrange | Daily temperature range within 2 m of roost location | |
| Host | Species | Myotis lucifugus, Perimyotis subflavus, or Myotis sodalis |
| Sex | male, female | |
| BMI | Body mass index [mass (g) / forearm (mm)] | |
| Clinical signs | Fungus | Extent of visible fungus on the wing |
| UV | Extent of UV fluorescence on the wing | |
Included in models using full dataset.
Included in models using subset dataset with paired temperature information because we included temperature at roost location as a covariate. X was not included due to collinearity with other covariates in models.
Omitted in models using subset dataset due to a singularity in response by site, which was included as a random effect.
Table 3.
Comparisons of candidate models for Pseudogymnoascus destructans in environmental substrates from bat hibernacula.
| Modelsa | k | AICc | ΔAICc | w |
|---|---|---|---|---|
| Presence-absence | ||||
| Spatial + Temporal + Climate | 10 | 1109.54 | 0 | 0.92 |
| Spatial + Temporal | 8 | 1114.44 | 4.9 | 0.08 |
| Climate | 4 | 1358.75 | 249.22 | 0 |
| Intercept | 2 | 1378.93 | 269.39 | 0 |
| Abundance | ||||
| Spatial + Temporal + Climate | 13 | 1062.74 | 0 | 0.77 |
| Spatial + Temporal | 11 | 1065.16 | 2.42 | 0.23 |
| Climate | 7 | 1075.14 | 12.4 | 0 |
| Intercept | 5 | 1075.26 | 12.52 | 0 |
Models are ranked based on corrected Akaike’s Information Criteria (AICc) and relative fits are shown with Akaike weights (w) which sum to 1. K is number of parameters. All presence-absence models included a random intercept of time since first detection of WNS in bats at the site. All abundance models included a random slope by sample type and a random intercept by site. See Table 2 for model descriptions.
Table 4.
Comparisons of candidate models for Pseudogymnoascus destructans on hibernating bats.
| Modela | k | AICc | ΔAICc | w |
|---|---|---|---|---|
| Presence-absence | ||||
| Location + Host + Clinical signs | 12 | 285.5 | 0 | 0.73 |
| Host + Clinical signs | 11 | 287.66 | 2.16 | 0.25 |
| Location + Clinical signs | 8 | 292.68 | 7.18 | 0.02 |
| Clinical signs | 5 | 300.82 | 15.32 | 0 |
| Location + Host | 10 | 306.28 | 20.78 | 0 |
| Host | 7 | 309.3 | 23.8 | 0 |
| Location | 6 | 314.84 | 29.33 | 0 |
| Intercept | 3 | 333.89 | 48.40 | 0 |
| Abundance | ||||
| Location + Host + Clinical signs | 12 | 647.05 | 0 | 0.98 |
| Host + Clinical signs | 9 | 655.27 | 8.22 | 0.02 |
| Location + Clinical signs | 8 | 661.88 | 14.84 | 0 |
| Clinical signs | 5 | 680.07 | 33.02 | 0 |
| Location + Host | 10 | 706.29 | 59.24 | 0 |
| Host | 7 | 714.92 | 67.87 | 0 |
| Location | 6 | 737.93 | 90.88 | 0 |
| Intercept | 3 | 756.46 | 109.41 | 0 |
Models are ranked based on corrected Akaike’s Information Criteria (AICc) and relative fits are shown with Akaike weights (w) which sum to 1. K is number of parameters. Random intercepts for all presence-absence models were by year and site, and for all abundance models were by site. Temperature parameters did not improve model fit (Table S2) so model results are shown from the full dataset without temperature. See Table 2 for model descriptions.
We fit generalized linear mixed models of presence-absence of Pd with a Bernoulli distribution and logit link using function glmer in the lme4 package (Bates et al. 2015) in R v3.1.2 (R Development Core Team 2008). For abundance models, we fit linear mixed models with a Gaussian distribution using function lmer on log10 transformed DNA values with only Pd-positive samples included in the response (all zeros were omitted). All continuous covariates were scaled and centered to allow for direct comparisons of parameter estimates in final models (Gelman 2008; Schielzeth 2010). Covariance among explanatory variables was assessed using Pearson’s correlation coefficients and any potential for collinearity was further evaluated using variance inflation factors.
Best-fit models were determined by ΔAICc < 2 (Burnham & Anderson 2002). Correct identification of models and random effect structures were assessed using plots of residuals versus fitted values and residuals versus covariates (Bolker et al. 2009). Autocorrelation was assessed by plotting the autocorrelation function of the residuals in the final models and goodness-of-fit was calculated as pseudo-r2 values (Johnson 2014) using the r.squaredGLMM function in the MuMIn package (Bartoń 2015).
Results
Study hibernacula represented a range of attributes and temperatures characteristic of caves and mines selected by bats for hibernation (Table 1, Fig. S2). We confirmed WNS in bats by histopathology for the first time in January, 2013 and March, 2014 at two study hibernacula (TN and WI, respectively) that had no detection of Pd in the environment or on bats at the start of our study.
Prevalence estimates of Pd on bats at the time WNS was first detected in a population were low but increased to near 100% prevalence within hibernacula affected by WNS for three years or more (Fig. 1A). We did not detect Pd in environmental samples at the time WNS was first detected in bats at the TN and WI sites. First detection of Pd in sediment samples from both sites occurred two sampling intervals (approximately eight months) after WNS was first detected in bats. Upon initial detection, prevalence of Pd in sediment was low but increased to approximately 80% prevalence after three or more years. First detection of Pd in wall-surface samples lagged about one year after first detection of WNS in bats. Prevalence and abundance of Pd in wall-surface samples increased at a slower rate and remained lower than in sediment and on bats within the site (Fig. 1B).
Fig. 1. Comparison of bat wing swabs (triangles), sediment samples (squares), and wall-surface swabs (circles) collected within study hibernacula for prevalence (A) and abundance (B) of Pseudogymnoascus destructans (Pd).
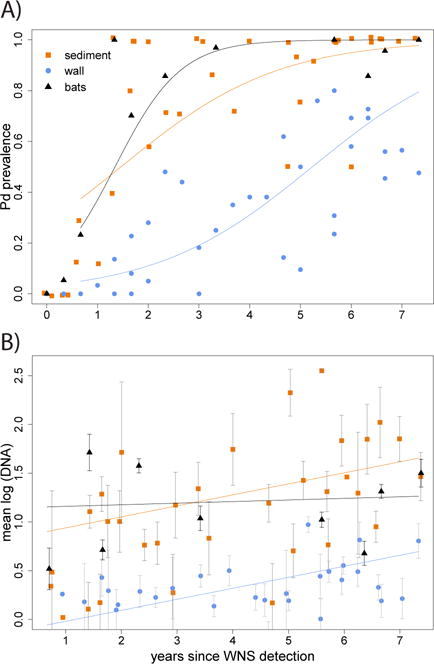
Points represent data summarized by sample type, site and time. Abundance includes Pd-positive samples only with standard errors. Solid lines are generalized linear model fits for prevalence or abundance versus WNStime and sample type. These model fits are provided for illustrative purposes to show the general trend for each sample type over time in years since first confirmation of white-nose syndrome (WNS) at a site.
Presence-absence and abundance of Pd in environmental samples from hibernacula was best described by spatial, temporal and climate covariates [presence-absence model pseudo-r2 = 0.51 (fixed effects), 0.69 (fixed and random effects); abundance model pseudo-r2 = 0.26 (fixed effects), 0.39 (fixed and random effects); Table 3]. Spatial covariates had the largest effect (based on parameter coefficients farthest from zero) in the best-fit models (Table 5). Detection probability and abundance of Pd were significantly higher in sediment compared to wall-surface samples. Additionally, probability of detecting Pd increased with height from the floor for wall-sample locations, and abundance of Pd was higher when sampled closer to the entrance. The mean range of daily temperatures at sample locations had a small yet significant effect, with higher detection probabilities and abundance of Pd in locations with more stable temperatures. Time also had a small effect on detection of Pd, but not abundance of Pd, increasing significantly since first detection of WNS in bats at a site. Non-significant parameters included in both best-fit models were time of year and mean daily temperature at sample location.
Table 5.
Summary of best-fit models for Pseudogymnoascus destructans in environmental substrates of bat hibernacula.
| Model term | Covariates | Estimate | SE | 95% CI | |
|---|---|---|---|---|---|
| Presence-absence | |||||
| Intercept | 0.09 | 0.68 | −1.24, 1.42 | ||
| Spatial | X | −0.25 | 0.14 | −0.52, 0.01 | |
| Z | 0.63 | 0.11 | 0.42, 0.83 | ||
| Type (wall−swab) | −3.91 | 0.31 | −4.53, −3.3 | ||
| Temporal | WNStime | 0.21 | 0.05 | 0.11, 0.30 | |
| Time of year | Late hibernation | 0.30 | 0.32 | −0.33. 0.93 | |
| Summer | −0.32 | 0.33 | −0.97, 0.34 | ||
| Climate | Tdmean | −0.22 | 0.16 | −0.54, 0.09 | |
| Tdrange | −0.29 | 0.11 | −0.5, −0.07 | ||
| No. of observations: 1316; random intercept: WNStime | |||||
| Abundance | |||||
| Intercept | 1.62 | 0.26 | 1.1, 2.14 | ||
| Spatial | X | −0.14 | 0.06 | −0.26, −0.02 | |
| Z | 0.05 | 0.05 | −0.05, 0.14 | ||
| Type (wall−swab) | −1 | 0.15 | −1.29, −0.71 | ||
| Temporal | WNStime | −0.02 | 0.01 | −0.05, 0 | |
| Time of year | Late hibernation | −0.13 | 0.08 | −0.29, 0.02 | |
| Summer | −0.1 | 0.09 | −0.27, 0.07 | ||
| Climate | Tdmean | −0.08 | 0.06 | −0.21, 0.04 | |
| Tdrange | −0.1 | 0.04 | −0.18, −0.01 | ||
| No. of observations: 505; random slope: type; random intercept: site | |||||
Reference is a sediment sample collected during early hibernation.
Presence-absence and abundance of Pd on hibernating bats were best described by a combination of spatial, temporal and host covariates [presence-absence pseudo-r2 = 0.38 (fixed effects), 0.89 (fixed and random effects); abundance pseudo-r2 = 0.31 (fixed effects), 0.58 (fixed and random effects); Table 4]. For bats, temperature covariates did not improve model fits (Table S2). Species had the largest effect in the best-fit models (Table 6), with significantly lower detection probabilities and abundance of Pd on M. sodalis compared to M. lucifugus. Across all species, probability of detecting Pd increased with time since first confirmation of WNS in the population, and abundance was higher on bats with lower BMI and on those roosting in the middle of a hibernaculum compared to other regions of the site at the time of sampling. Abundance of Pd was also higher on bats with clinical signs of WNS (UV fluorescence and visible fungus), but detection of Pd was only positively correlated with fluorescence of wing skin under UV light. Sex was included in both of the best-fit models but was non-significant.
Table 6.
Summary of best-fit models for Pseudogymnoascus destructans on hibernating bats.
| Model term | Covariates | Estimate | SE | 95% CI | |
|---|---|---|---|---|---|
| Presence-absence | |||||
| Intercept | −0.72 | 2.78 | −6.18, 4.74 | ||
| Location | WNSWinters | 0.95 | 0.38 | 0.2, 1.7 | |
| Region | Middle | −0.12 | 0.47 | −1.03, 0.8 | |
| Deep | −0.62 | 0.46 | −1.52, 0.28 | ||
| Host | Speciesa | MYSO | −2.5 | 0.91 | −4.27, −0.71 |
| PESU | 0.31 | 0.62 | −0.9, 1.52 | ||
| BMI | 0.33 | 0.25 | −0.16, 0.82 | ||
| Sex (M) | 0.52 | 0.39 | −0.23, 1.28 | ||
| Clinical Signs | Fungus | −0.06 | 0.41 | −0.87, 0.75 | |
| UV | 0.97 | 0.23 | 0.52, 1.42 | ||
| No. of observations: 567; random intercepts: year and site | |||||
| Abundance | |||||
| Intercept | 0.51 | 0.33 | −0.14, 1.16 | ||
| Location | WNSWinters | 0.10 | 0.06 | −0.02, 0.23 | |
| Region | Middle | 0.19 | 0.09 | 0.02, 0.37 | |
| Deep | −0.07 | 0.08 | −0.24, 0.09 | ||
| Host | Species | MYSO | −0.81 | 0.19 | −1.19, −0.43 |
| PESU | −0.25 | 0.14 | −0.53, 0.02 | ||
| BMI | −0.09 | 0.04 | −0.17, −0.02 | ||
| Sex (M) | −0.08 | 0.07 | −0.22, 0.06 | ||
| Clinical Signs | Fungus | 0.2 | 0.05 | 0.11, 0.29 | |
| UV | 0.16 | 0.03 | 0.1, 0.22 | ||
| No. of observations: 340; random intercept: site | |||||
MYSO (Myotis sodalis Indiana bat) and PESU (Perimyotis subflavus tri-colored bat).
Reference is a female Myotis lucifugus little brown bat without visible fungus roosting near the entrance of a hibernaculum.
Discussion
Understanding determinants of pathogen distribution in hosts and environmental reservoirs is necessary for optimal disease surveillance and control strategies (Haydon et al. 2002). In the context of WNS, Pd is known to colonize bats and substrates of underground hibernacula (Lorch et al. 2013b); however factors influencing distribution and persistence of the fungal pathogen had not been elucidated. In this study, we define presence-absence and abundance of Pd in environmental substrates and on bats within a hibernaculum from first introduction of the fungus to an established state. These analyses can be used to inform surveillance and management of WNS.
Results indicate that bats are the primary means by which Pd is introduced into a hibernaculum. Thus, if collection of samples from hibernating bats is feasible and acceptable, this method is most likely to facilitate early detection of Pd within that population. Similar to other studies (Janicki et al. 2015; Langwig et al. 2016), higher probability of detecting Pd on M. lucifugus compared to other co-habitant species (Fig. 2) indicates that when possible, M. lucifugus should be prioritized for sampling. Results also demonstrate that use of longwave UV light (385 nm) to identify hibernating bats with fluorescence characteristic of WNS (Turner et al. 2014), and targeting those animals for sampling, will further increase probability of detecting Pd in a wild population.
Fig. 2. Comparison of prevalence (A) and abundance (B) of Pseudogymnoascus destructans in wing-swab samples from bats hibernating within study hibernacula.

Only sites containing multiple species, Myotis sodalis (MYSO), Myotis lucifugus (MYLU) or Perimyotis subflavus (PESU), are included. MYSO were excluded from (B) for TN because of low sample sizes (n = 2). Numbers within bars are sample sizes. Error bars denote ± standard error. Asterisks denote species that had significant differences in the generalized linear mixed model results.
When bats cannot be sampled, testing environmental samples from a hibernaculum for Pd provides an alternative option for pathogen surveillance. Further, time of year did not correlate with detection probability in environmental samples, demonstrating the utility of this method for identifying Pd in sites that are inaccessible during winter. Higher probability of detecting Pd in floor sediment compared to wall-surface samples (Fig. 1) indicates that sediment is the preferred sample type when conducting environmental surveillance for site-level detection of Pd based upon an appropriate sampling design (Lorch et al. 2013b).
Similar to previous studies, we found that detecting Pd in environmental samples from a hibernaculum reliably indicates that Pd is present in the resident bat population (Lindner et al. 2011; Langwig et al. 2015a). We further demonstrated that detection of Pd in the environment of a hibernaculum, even with a robust sampling design, can lag up to one year following first detection of infected bats within the site. Thus, failure to detect Pd in environmental samples from a hibernaculum does not confirm absence of the pathogen in the bat population.
Accumulation of Pd in the hibernaculum environment may reflect deposition of fungal material shed by bats or growth of the fungus. Molecular methods used in this study cannot confirm viability, but Pd has been isolated from sediments of hibernacula using live-culture methods (Lorch et al. 2013a). Relatively high abundance of Pd within sediment compared to on wall surfaces (Fig. 1B) also suggests growth of the fungus in sediment. Nonetheless, biases associated with sample volume or extraction efficiency between sample types should be considered (Verant et al. 2016).
Higher prevalence and abundance of Pd in floor sediment is consistent with distributional patterns reported for other fungi in caves and likely reflects availability of organic matter (Dickson & Kirk 1976; Vanderwolf et al. 2013). In contrast, vertical surfaces appear to be less uniform reservoirs of Pd, with distributions related more to the presence of hibernating bats. Consistent with preferences of hibernating bats to roost near cave ceilings, we demonstrated a higher probability of detecting Pd in wall-surface samples collected farther from hibernaculum floors. Moreover, in accordance with observations of hibernating bats affected by WNS shifting roost locations (Cryan et al. 2010), we detected greater abundance of Pd at environmental sampling locations closer to hibernaculum entrances. Although we did not explicitly link detection of Pd on roosting bats with specific environmental sampling locations, prevalence of Pd in environmental samples has been shown to be higher when collected near (within 20 cm of) hibernating bats (Langwig et al. 2015a).
Reducing environmental reservoirs of a pathogen or blocking transmission to susceptible hosts from the environment can be accomplished through strategic environmental modifications (Campbell-Lendrum et al. 2005). This is standard practice for mitigating diseases in humans and livestock (Singh & Tham 1988; Barger 1999) and is useful for free-ranging wildlife when treatment of individual animals is not feasible. The role of environmental reservoirs of Pd as sources of infection for bats (Langwig et al. 2015b; Frick et al. 2017) suggests that reducing abundance of Pd in a hibernaculum during summer, when bats are largely absent, may reduce incidence and intensity of infection in bats that return for hibernation. Our results, however, suggest that decontamination of a hibernaculum immediately following first detection of Pd in bats at that site may not be productive given the scarcity of Pd in environmental reservoirs at this time. However, reducing the amount of Pd in the environment of a hibernaculum in years following first detection of the pathogen may help moderate increased rates of transmission and mortality in bats in subsequent years (Langwig et al. 2015a; Frick et al. 2017). Further research on transmission of Pd between environmental substrates and bats is needed to elucidate the importance of environmental reservoirs in WNS disease dynamics.
Lowering the temperature within a hibernaculum has been proposed as a strategy for managing WNS based on observations of lower mortality in bats hibernating under colder conditions (Langwig et al. 2012; Johnson et al. 2014; Grieneisen et al. 2015). This may be related to lower growth rates of Pd at reduced temperature (Verant et al. 2012) resulting in lower abundance of Pd on bats (Langwig et al. 2016) or other physiologic effects of temperature on hibernating bats (Thomas & Cloutier 1992; Humphries, Thomas & Speakman 2002; Boyles et al. 2007). Although we detected a small effect of temperature variability on distribution and abundance of Pd in the environment (Fig. 3), results of this study do not, within the range of temperatures suitable for bat hibernation, indicate a clear role for colder temperature in reducing growth rates and abundance of Pd in environmental reservoirs or on hibernating bats.
Fig. 3. Relationships between mean daily temperature range and prevalence (A) or abundance (B) of Pseudogymnoascus destructans in sediment (squares) and wall-surface swabs (circles) at sampled locations within study hibernacula.
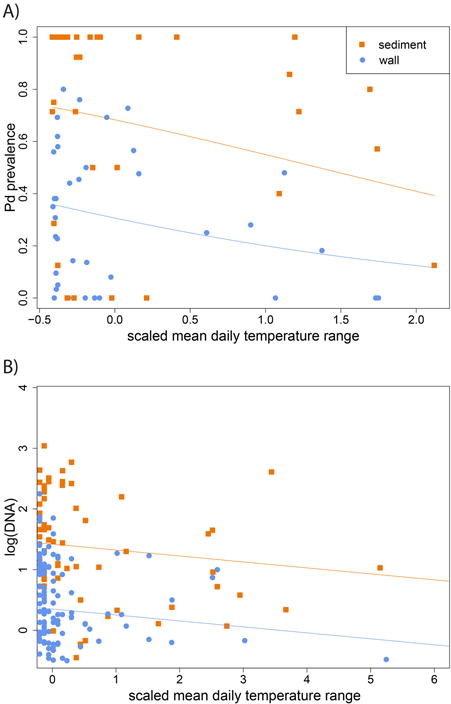
Solid lines for abundance show model fits from the best-fit model by sample type. Solid lines for prevalence represent a simplified generalized linear mixed model presented for illustration purposes. This model includes mean daily temperature range (scaled and centered) and type as covariates in a binomial distribution of prevalence weighted by sample size.
Results of this study expand our understanding of the epidemiology of WNS within bat hibernacula by identifying determinants of Pd within environmental substrates and on hibernating bats, from first introduction of the fungus to establishment of WNS in the bat population. This study was designed to capture fine-scale dynamics of Pd within hibernacula in the eastern and mid-western U.S. Additionally, conclusions provide a framework to inform WNS surveillance and management in other geographic areas in response to this unprecedented epidemic.
Supplementary Material
Fig. S1. Map of study sites.
Fig. S2. Temperatures across sampling regions within study hibernacula.
Table S1. Comparisons of candidate models for Pseudogymnoascus destructans in environmental substrates from bat hibernacula using the full dataset.
Table S2. Comparisons of candidate models for Pseudogymnoascus destructans on hibernating bats using the subset dataset with paired temperature information.
Acknowledgments
M.L.V. was funded by the National Institutes of Health Ruth L. Kirschstein National Research Service Award (OD010423) from the National Institute of General Medical Sciences. Research was funded by the U.S. Fish and Wildlife Service (#4500036150, #F14AP00738). Many thanks to personnel from State agencies (KYDFG, NYDEC, TWRA, WDNR), USFWS, TN Nature Conservancy, local organizations (NCCI, SCCI) and EcoHealth Alliance who provided expertise and field support. Use of trade, product, or firm names is for descriptive purposes only and does not imply endorsement by the U.S. Government.
Footnotes
DR MICHELLE L VERANT (Orcid ID : 0000-0001-6994-6257)
Editor : Hamish McCallum
Authors’ contributions
MV, DB, KO and JE conceived the ideas and designed the study; MV and EB collected the data; MV, EB and KR analysed the data; MV, KR and DB wrote the manuscript. All authors contributed critically to the drafts and gave final approval for publication.
Data Accessibility
Data available from the U.S. Geological Survey ScienceBase Catalog. https://doi.org/10.5066/F77D2SP5 (Verant et al. 2017).
Supporting Information
Additional supporting information may be found in the online version of this article:
Contributor Information
Michelle L. Verant, School of Veterinary Medicine, University of Wisconsin-Madison and U.S. Geological Survey – National Wildlife Health Center.
Elizabeth A. Bohuski, U.S. Geological Survey – National Wildlife Health Center
Katherine L.D. Richgels, U.S. Geological Survey – National Wildlife Health Center
Kevin J. Olival, EcoHealth Alliance
Jonathan H. Epstein, EcoHealth Alliance
David S. Blehert, U.S. Geological Survey – National Wildlife Health Center
References
- Barger IA. The role of epidemiological knowledge and grazing management for helminth control in small ruminants. International Journal for Parasitology. 1999;29:41–47. doi: 10.1016/s0020-7519(98)00176-3. [DOI] [PubMed] [Google Scholar]
- Bartoń K. MuMIn: multi-model inference, R package version 1.15.1 2015 [Google Scholar]
- Bates D, Maechler M, Bolker B, Walker S. Fitting linear mixed-effects models using lme4. Journal of Statistical Software. 2015;67:1–48. [Google Scholar]
- Blehert DS, Hicks AC, Behr MJ, Meteyer CU, Berlowski-Zier BM, Buckles EL, Coleman JTH, Darling SR, Gargas A, Niver R, Okoniewski JC, Rudd RJ, Stone WB. Bat white-nose syndrome: an emerging fungal pathogen? Science. 2009;323:227. doi: 10.1126/science.1163874. [DOI] [PubMed] [Google Scholar]
- Bolker BM, Brooks ME, Clark CJ, Geange SW, Poulsen JR, Stevens MH, White JS. Generalized linear mixed models: a practical guide for ecology and evolution. Trends in Ecology & Evolution. 2009;24:127–135. doi: 10.1016/j.tree.2008.10.008. [DOI] [PubMed] [Google Scholar]
- Boyles JG, Dunbar MB, Storm JJ, Brack V. Energy availability influences microclimate selection of hibernating bats. Journal of Experimental Biology. 2007;210:4345–4350. doi: 10.1242/jeb.007294. [DOI] [PubMed] [Google Scholar]
- Burnham KP, Anderson DR. Model selection and multimodal inference: a practical information-theoretic approach. 2nd. Springer; New York: 2002. [Google Scholar]
- Campbell-Lendrum D, Molyneux D, Amerasinghe F, Davies C, Fletcher E, Schofield C, Jean-Marc H, Polson K, Sinkins S. Ecosystems and vector-borne disease control. In: Chopra K, Leemans R, Kumar P, Simons H, editors. Ecosystems and human well-being: Policy responses. Island Press; Washington, DC: 2005. pp. 355–370. [Google Scholar]
- Chappell WA, Titman RD. Estimating reserve lipids in greater scaup (Aythya marila) and lesser scaup (A. affinis) Canadian Journal of Zoology. 1983;61:35–38. [Google Scholar]
- Cryan PM, Meteyer CU, Blehert DS, Lorch JM, Reeder DM, Turner GG, Webb J, Behr M, Verant ML, Russell RE, Castle KT. Electrolyte depletion in white-nose syndrome bats. Journal of Wildlife Diseases. 2013;49:398–402. doi: 10.7589/2012-04-121. [DOI] [PubMed] [Google Scholar]
- Cryan PM, Meteyer CU, Boyles JG, Blehert DS. Wing pathology of white-nose syndrome in bats suggests life-threatening disruption of physiology. Bmc Biology. 2010;8:135. doi: 10.1186/1741-7007-8-135. [DOI] [PMC free article] [PubMed] [Google Scholar]
- De Castro F, Bolker B. Mechanisms of disease‐induced extinction. Ecology Letters. 2005;8:117–126. [Google Scholar]
- Dickson GW, Kirk PW. Distribution of heterotrophic microorganisms in relation to detritivores in Virginia caves (with supplemental bibliography on cave mycology and microbiology) In: Parker BC, Roane MK, editors. The distributional history of the biota of the southern Appalachians. University of Virginia Press; Charlottesville, VA: 1976. pp. 205–226. (IV Algae and fungi). [Google Scholar]
- Fisher MC, Henk DA, Briggs CJ, Brownstein JS, Madoff LC, McCraw SL, Gurr SJ. Emerging fungal threats to animal, plant and ecosystem health. Nature. 2012;484:186–194. doi: 10.1038/nature10947. [DOI] [PMC free article] [PubMed] [Google Scholar]
- Frick WF, Cheng TL, Langwig KE, Hoyt JR, Janicki AF, Parise KL, Foster JT, Kilpatrick AM. Pathogen dynamics during invasion and establishment of white-nose syndrome explain mechanisms of host persistence. Ecology. 2017;98:624–631. doi: 10.1002/ecy.1706. [DOI] [PubMed] [Google Scholar]
- Frick WF, Pollock JF, Hicks AC, Langwig K, Reynolds DS, Turner GG, Butchkoski CM, Kunz TH. An emerging disease causes regional population collapse of a common North American bat species. Science. 2010;329:679–682. doi: 10.1126/science.1188594. [DOI] [PubMed] [Google Scholar]
- Frick WF, Puechmaille SJ, Hoyt JR, Nickel BA, Langwig KE, Foster JT, Barlow KE, Bartonička T, Feller D, Haarsma AJ, Herzog C, Horáček I, van der Kooij J, Mulkens B, Petrov B, Reynolds R, Rodrigues L, Stihler CW, Turner GG, Kilpatrick AM. Disease alters macroecological patterns of North American bats. Global Ecology and Biogeography. 2015;24:741–749. [Google Scholar]
- Gargas A, Trest MT, Christensen M, Volk TJ, Blehert DS. Geomyces destructans sp. nov. asssociated with bat white-nose syndrome. Mycotaxon. 2009;108:147–154. [Google Scholar]
- Gelman A. Scaling regression inputs by dividing by two standard deviations. Statistics in Medicine. 2008;27:2865–2873. doi: 10.1002/sim.3107. [DOI] [PubMed] [Google Scholar]
- Grieneisen LE, Brownlee-Bouboulis SA, Johnson JS, Reeder DM. Sex and hibernaculum temperature predict survivorship in white-nose syndrome affected little brown myotis (Myotis lucifugus) Royal Society of Open Science. 2015;2 doi: 10.1098/rsos.140470. [DOI] [PMC free article] [PubMed] [Google Scholar]
- Haydon DT, Cleaveland S, Taylor LH, Laurenson MK. Identifying reservoirs of infection: a conceptual and practical challenge. Emerging Infectious Disease. 2002;8:1468–1473. doi: 10.3201/eid0812.010317. [DOI] [PMC free article] [PubMed] [Google Scholar]
- Hoyt JR, Sun K, Parise KL, Lu G, Langwig KE, Jiang T, Yang S, Frick WF, Kilpatrick AM, Foster JT, Feng J. Widespread bat white-nose syndrome fungus, northeastern China. Emerging Infectious Disease. 2016;22:140–142. doi: 10.3201/eid2201.151314. [DOI] [PMC free article] [PubMed] [Google Scholar]
- Humphries MM, Thomas DW, Speakman JR. Climate-mediated energetic constraints on the distribution of hibernating mammals. Nature. 2002;418:313–316. doi: 10.1038/nature00828. [DOI] [PubMed] [Google Scholar]
- Janicki AF, Frick WF, Kilpatrick AM, Parise KL, Foster JT, McCracken GF. Efficacy of visual surveys for white-nose syndrome at bat hibernacula. Plos One. 2015;10:e0133390. doi: 10.1371/journal.pone.0133390. [DOI] [PMC free article] [PubMed] [Google Scholar]
- Johnson JS, Reeder DM, McMichael JW, III, Meierhofer MB, Stern DWF, Lumadue SS, Sigler LE, Winters HD, Vodzak ME, Kurta A, Kath JA, Field KA. Host, pathogen, and environmental characteristics predict white-nose syndrome mortality in captive little brown myotis (Myotis lucifugus) Plos One. 2014;9:e112502. doi: 10.1371/journal.pone.0112502. [DOI] [PMC free article] [PubMed] [Google Scholar]
- Johnson PCD. Extension of Nakagawa & Schielzeth’s R2GLMM to random slopes models. Methods in Ecology and Evolution. 2014;5:944–946. doi: 10.1111/2041-210X.12225. [DOI] [PMC free article] [PubMed] [Google Scholar]
- Langwig K, Hoyt JR, Parise KL, Kath JA, Kirk D, Frick WF, Foster JT, Kilpatrick AM. Invasion dynamics of white-nose syndrome fungus, midwestern United States, 2012–2014. Emerging Infectious Disease. 2015a;21:1023. doi: 10.3201/eid2106.150123. [DOI] [PMC free article] [PubMed] [Google Scholar]
- Langwig KE, Frick WF, Bried JT, Hicks AC, Kunz TH, Marm Kilpatrick A. Sociality, density-dependence and microclimates determine the persistence of populations suffering from a novel fungal disease, white-nose syndrome. Ecology Letters. 2012;15:1050–1057. doi: 10.1111/j.1461-0248.2012.01829.x. [DOI] [PubMed] [Google Scholar]
- Langwig KE, Frick WF, Hoyt JR, Parise KL, Drees KP, Kunz TH, Foster JT, Kilpatrick AM. Drivers of variation in species impacts for a multi-host fungal disease of bats. Philosophical Transactions of the Royal Society B: Biological Sciences. 2016;371 doi: 10.1098/rstb.2015.0456. [DOI] [PMC free article] [PubMed] [Google Scholar]
- Langwig KE, Frick WF, Reynolds R, Parise KL, Drees KP, Hoyt JR, Cheng TL, Kunz TH, Foster JT, Kilpatrick AM. Host and pathogen ecology drive the seasonal dynamics of a fungal disease, white-nose syndrome. Proc Biol Sci. 2015b;282:20142335. doi: 10.1098/rspb.2014.2335. [DOI] [PMC free article] [PubMed] [Google Scholar]
- Lindner DL, Gargas A, Lorch JM, Banik MT, Glaeser J, Kunz TH, Blehert DS. DNA-based detection of the fungal pathogen Geomyces destructans in soils from bat hibernacula. Mycologia. 2011;103:241–246. doi: 10.3852/10-262. [DOI] [PubMed] [Google Scholar]
- Lorch JM, Lindner DL, Gargas A, Muller LK, Minnis AM, Blehert DS. A culture-based survey of fungi in soil from bat hibernacula in the eastern United States and its implications for detection of Geomyces destructans, the causal agent of bat white-nose syndrome. Mycologia. 2013a;105:237–252. doi: 10.3852/12-207. [DOI] [PubMed] [Google Scholar]
- Lorch JM, Meteyer CU, Behr MJ, Boyles JG, Cryan PM, Hicks AC, Ballmann AE, Coleman JTH, Redell D, Reeder DM, Blehert DS. Experimental infection of bats with Geomyces destructans causes white-nose syndrome. Nature. 2011;480:376–378. doi: 10.1038/nature10590. [DOI] [PubMed] [Google Scholar]
- Lorch JM, Muller LK, Russell RE, O’Connor M, Lindner DL, Blehert DS. Distribution and environmental persistence of the causative agent of white-nose syndrome, Geomyces destructans, in bat hibernacula of the eastern United States. Applied and Environmental Microbiology. 2012;79:1293–2839. doi: 10.1128/AEM.02939-12. [DOI] [PMC free article] [PubMed] [Google Scholar]
- Lorch JM, Muller LK, Russell RE, O’Connor M, Lindner DL, Blehert DS. Distribution and environmental persistence of the causative agent of white-nose syndrome, Geomyces destructans, in bat hibernacula of the Eastern United States. Applied and Environmental Microbiology. 2013b;79:1293–1301. doi: 10.1128/AEM.02939-12. [DOI] [PMC free article] [PubMed] [Google Scholar]
- McCallum H, Dobson A. Detecting disease and parasite threats to endangered species and ecosystems. Trends in Ecology & Evolution. 1995;10:190–194. doi: 10.1016/s0169-5347(00)89050-3. [DOI] [PubMed] [Google Scholar]
- Meteyer CU, Buckles EL, Blehert DS, Hicks AC, Green DE, Shearn-Bochsler V, Thomas NJ, Gargas A, Behr MJ. Histopathologic criteria to confirm white-nose syndrome in bats. Journal of Veterinary Diagnostic Investigation. 2009;21:411–414. doi: 10.1177/104063870902100401. [DOI] [PubMed] [Google Scholar]
- Minnis AM, Lindner DL. Phylogenetic evaluation of Geomyces and allies reveals no close relatives of Pseudogymnoascus destructans, comb. nov., in bat hibernacula of eastern North America. Fungal Biology. 2013;117:638–649. doi: 10.1016/j.funbio.2013.07.001. [DOI] [PubMed] [Google Scholar]
- Muller LK, Lorch JM, Lindner DL, O’Connor M, Gargas A, Blehert DS. Bat white-nose syndrome: A real-time TaqMan polymerase chain reaction test targeting the intergenic spacer region of Geomyces destructans. Mycologia. 2013;105:253–259. doi: 10.3852/12-242. [DOI] [PubMed] [Google Scholar]
- Norquay KJO, Willis CKR. Hibernation phenology of Myotis lucifugus. Journal of Zoology. 2014;294:85–92. [Google Scholar]
- R Development Core Team. R: A language and environment for statistical computing. R Foundation for Statistical Computing; Vienna, Austria: 2008. [Google Scholar]
- Raudabaugh DB, Miller AN. Nutritional capability of and substrate suitability for Pseudogymnoascus destructans, the causal agent of bat white-nose syndrome. Plos One. 2013;8:e78300. doi: 10.1371/journal.pone.0078300. [DOI] [PMC free article] [PubMed] [Google Scholar]
- Reeder DM, Frank CL, Turner GG, Meteyer CU, Kurta A, Britzke ER, Vodzak ME, Darling SR, Stihler CW, Hicks AC, Jacob R, Grieneisen LE, Brownlee SA, Muller LK, Blehert DS. Frequent arousal from hibernation linked to severity of infection and mortality in bats with white-nose syndrome. Plos One. 2012;7:e38920. doi: 10.1371/journal.pone.0038920. [DOI] [PMC free article] [PubMed] [Google Scholar]
- Reynolds HT, Barton HA. Comparison of the white-nose syndrome agent Pseudogymnoascus destructans to cave-dwelling relatives suggests reduced saprotrophic enzyme activity. Plos One. 2014;9:e86437. doi: 10.1371/journal.pone.0086437. [DOI] [PMC free article] [PubMed] [Google Scholar]
- Schielzeth H. Simple means to improve the interpretability of regression coefficients. Methods in Ecology and Evolution. 2010;1:103–113. [Google Scholar]
- Singh J, Tham AS. Case history of malaria vector control through the application of environmental management in Malaysia. World Health Organization; Geneva: 1988. [Google Scholar]
- Skerratt LF, Berger L, Speare R, Cashins S, McDonald KR, Phillott AD, Hines HB, Kenyon N. Spread of chytridiomycosis has caused the rapid global decline and extinction of frogs. EcoHealth. 2007;4:125–134. [Google Scholar]
- Swezey CS, Garrity CP. Geographical and geological data from caves and mines infected with white-nose syndrome (WNS) before September 2009 in the eastern United States. Journal of Cave and Karst Studies. 2011;73:125–157. [Google Scholar]
- Thogmartin WE, Sanders-Reed CA, Szymanski JA, McKann PC, Pruitt L, King RA, Runge MC, Russell RE. White-nose syndrome is likely to extirpate the endangered Indiana bat over large parts of its range. Biological Conservation. 2013;160:162–172. [Google Scholar]
- Thomas DW, Cloutier D. Evaporative water-loss by hibernating little brown bats, Myotis lucifugus. Physiological Zoology. 1992;65:443–456. [Google Scholar]
- Turner GG, Meteyer CU, Barton H, Gumbs JF, Reeder DM, Overton B, Bandouchova H, Bartonička T, Martínková N, Pikula J, Zukal J, Blehert DS. Nonlethal screening of bat-wing skin with the use of ultraviolet fluorescence to detect lesions indicative of white-nose syndrome. Journal of Wildlife Diseases. 2014;50:566–573. doi: 10.7589/2014-03-058. [DOI] [PubMed] [Google Scholar]
- U.S. Fish Wildlife Service. National white-nose syndrome decontamination protocol 2012 [Google Scholar]
- Vanderwolf K, Malloch D, McAlpine D. Ectomycota associated with arthropods from bat hibernacula in eastern Canada, with particular reference to Pseudogymnoasucs destructans. Insects. 2016;7 doi: 10.3390/insects7020016. [DOI] [PMC free article] [PubMed] [Google Scholar]
- Vanderwolf KJ, Malloch D, McAlpine DF, Forbes GJ. A world review of fungi, yeasts, and slime moldes in caves. International Journal of Speleology. 2013;42:77–96. [Google Scholar]
- Verant ML, Bohuski EA, Lorch JM, Blehert DS. Optimized methods for total nucleic acid extraction and quantitation of the bat white-nose syndrome fungus, Pseudogymnoascus destructans, from swab and environmental samples. Journal of Veterinary Diagnostic Investigation. 2016;28:110–118. doi: 10.1177/1040638715626963. [DOI] [PubMed] [Google Scholar]
- Verant ML, Bohuski EA, Richgels KLD, Olival KJ, Epstein JH, Blehert DS. Determinants of Pseudogymnoascus destructans within bat hibernacula: data. U.S. Geological Survey data release; 2017. https://doi.org/10.5066/F77D2SP5. [DOI] [PMC free article] [PubMed] [Google Scholar]
- Verant ML, Boyles JG, Waldrep W, Jr, Wibbelt G, Blehert DS. Temperature-dependent growth of Geomyces destructans, the fungus that causes bat white-nose syndrome. Plos One. 2012;7:e46280. doi: 10.1371/journal.pone.0046280. [DOI] [PMC free article] [PubMed] [Google Scholar]
- Verant ML, Meteyer C, Speakman JR, Cryan P, Lorch JM, Blehert DS. White-nose syndrome intiaties a cascade of physiologic disturbances in the hibernating bat host. BMC Physiology. 2014;14 doi: 10.1186/s12899-014-0010-4. [DOI] [PMC free article] [PubMed] [Google Scholar]
- Warnecke L, Turner JM, Bollinger TK, Lorch JM, Misra V, Cryan PM, Wibbelt G, Blehert DS, Willis CKR. Inoculation of bats with European Geomyces destructans supports the novel pathogen hypothesis for the origin of white-nose syndrome. Proceedings of the National Academy of Sciences. 2012;109:6999–7003. doi: 10.1073/pnas.1200374109. [DOI] [PMC free article] [PubMed] [Google Scholar]
- Warnecke L, Turner JM, Bollinger TK, Misra V, Cryan PM, Blehert DS, Wibbelt G, Willis CKR. Pathophysiology of white-nose syndrome in bats: a mechanistic model linking wing damage to mortality. Biology Letters. 2013;9:20130177. doi: 10.1098/rsbl.2013.0177. [DOI] [PMC free article] [PubMed] [Google Scholar]
- Wibbelt G, Kurth A, Hellmann D, Weishaar M, Barlow A, Veith M, Prüger J, Görföl T, Grosche L, Bontadina F, Zöphel U, Seidl HP, Cryan PM, Blehert DS. White-nose Syndrome fungus (Geomyces destructans) in bats, Europe. Emerging Infectious Diseases. 2010;16:1237–1243. doi: 10.3201/eid1608.100002. [DOI] [PMC free article] [PubMed] [Google Scholar]
- Wilcox A, Warnecke L, Turner JM, McGuire LP, Jameson JW, Misra V, Bollinger TC, Willis CKR. Behaviour of hibernating little brown bats experimentally inoculated with the pathogen that causes white-nose syndrome. Animal Behaviour. 2014;88:157–164. [Google Scholar]
- Zuur A, Ieno EN, Walker N, Saveliev AA, Smith GM. Mixed Effects Models and Extensions in Ecology with R. Springer-Verlag; New York: 2009. [Google Scholar]
Associated Data
This section collects any data citations, data availability statements, or supplementary materials included in this article.
Supplementary Materials
Fig. S1. Map of study sites.
Fig. S2. Temperatures across sampling regions within study hibernacula.
Table S1. Comparisons of candidate models for Pseudogymnoascus destructans in environmental substrates from bat hibernacula using the full dataset.
Table S2. Comparisons of candidate models for Pseudogymnoascus destructans on hibernating bats using the subset dataset with paired temperature information.