Abstract
DNA molecular machines show great promise in fields such as biomarker discovery and biological activity regulation, but operating DNA machines with specific functions within living systems remains extremely challenging. Although DNA machines have been engineered with exact molecular-level specifications, some intrinsic imperfections such as poor cell permeation and fragility in complex cytoplasmic milieu persist due to the well-established character of nucleic acid molecules. To circumvent these problems, we herein report a molecularly engineered, entropy-driven three-dimensional DNA amplifier (EDTD) that can operate inside living cells in response to a specific mRNA target. In particular, mRNA target/EDTD interaction can specifically initiate an autonomous DNA circuit inside living cells owing to the exclusive entropy-driven force, thus providing enormous signal amplification for ultrasensitive detection of the mRNA. Moreover, owing to molecular engineering of a unique DNA tetrahedral framework into the DNA amplifier, EDTD exhibits significantly enhanced biostability and cellular uptake efficiency, which are prerequisites for DNA machines used for in vivo applications. This programmable DNA machine presents a simple and modular amplification mechanism for the detection of intracellular biomarkers. Moreover, this study provides a potentially valuable molecular tool for understanding the chemistry of cellular systems and offers a design blueprint for further expansion of DNA nanotechnology in living systems.
Graphical abstract
Introduction
While appreciated for its role in carrying genetic information, DNA can also serve as a remarkably powerful scaffold for the construction of a variety of molecular machines working autonomously and efficiently within living cells. Examples of such machines include riboswitches, ribozymes, transposons, and ribosomes.1–4 Inspired by the behavior of DNA in nature, scientists are currently interested in designing artificial DNA structures that can serve as ideal scaffolds for the construction of molecular machines for applications ranging from smart therapeutics to interrogation of complex biological phenomena.5–8 Benefiting from the specificity and predictability of Watson–Crick base pairing, artificial self-assembled DNA molecular machines now possess the structural complexity required for applications such as smart diagnostics or the production of high-value chemicals.9–13 However, most of these DNA machines are still limited to in vitro applications, with significant challenges remaining for operating DNA machines within living cells.14–16 In particular, while DNA machines have been engineered with molecular-level specifications, some intrinsic imperfections such as poor cell permeation and fragility in complex cytoplasmic milieu still persist due to the well-established character of nucleic acid molecules.17,18 Thus, building a DNA molecular machine able to perform a specific function within living systems remains a challenging goal.
DNA amplifiers, one of the most important DNA molecular machines, hold great promise in low-abundance biomarker discovery and clinical early diagnosis due to their remarkable signal-amplifying ability. For example, our group previously constructed the first generation of DNA amplifier, termed hairpin DNA cascade amplifier (HDCA), that could undergo a hairpin DNA cascade reaction in response to low-expressing mRNA in living cells.19 While the HDCA was shown to be suitable for signal acquisition in living cells, complex and labor-intensive steps were required to prepare and functionalize the special nucleotide-modified oligonucleotides in order to enhance thermostability and nuclease resistance. Additionally, the HDCA must be transported into the cell with the help of transfection agents, owing to its poor cell permeability. Finally, it is worth noting that these typical amplification strategies are driven by the released free energy associated with base-pair formation, which may result in circuit leakage.20 For example, the two hairpin substrates in a catalytic hairpin assembly (CHA) circuit can potentially react nonspecifically and lead to relatively high background or false-positive signals.21,22 Therefore, when using such traditional hairpin-based amplification strategies, optimization of reliability and performance also requires complicated preparation procedures. Faced with these challenges, hybrid amplifiers built with DNA and inorganic nanomaterials have also been developed. These nanomaterials, such as gold nanoparticles and graphene, indirectly improved the delivery of DNA into cells and also enhanced biostability of DNA to some extent.23,24 Nonetheless, complex steps for the preparation and functionalization of these inorganic nanomaterials are inevitable. Therefore, it is highly desirable to develop an arduous steps-free strategy through DNA molecular engineering to directly improve the self-delivery and biostability of the DNA amplifier as well as achieve good reliability and high signal gain.
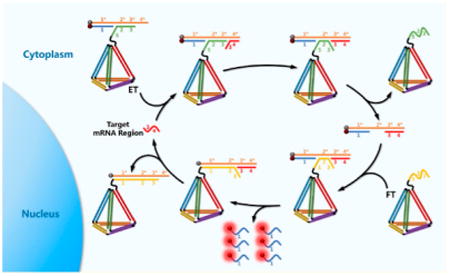
To achieve this goal, we herein report the first attempt to molecularly engineer an entropy-driven 3D DNA amplifier (EDTD) able to operate within living cells in response to a specific intracellular mRNA target. As shown in Scheme 1, EDTD consists of two major modules: the entropy beacon tetrahedron (ET) module and the fuel tetrahedron (FT) module. Specifically, the ET module was assembled with six well-designed DNA strands (P1, P2, P3, P4, P5, and P6). Among the six strands, P1, P2, P3, and P4 were designed to have six pairs of complementary domains, which can hybridize to form the six edges of a tetrahedral backbone. Moreover, the sequence of P4 was extended with an oligothymine spacer and a special locked sequence (domains 2 and 3) that can hybridize with the P5/P6 complex. P5 was modified with a Dabcyl at the 3′-end, and P6 was modified with a fluorophore (FAM) at the 5′-end. Effective quenching of FAM fluorescence could be easily achieved by carefully assembling the ET with the correct stoichiometry. Similarly, the FT was assembled with four DNA strands (P1, P2, P3, and P7) designed to have the same tetrahedral backbone as that of the ET. However, P7 had a different extended sequence. In the absence of target mRNA, the ET and FT remain intact without cross-reaction. However, in the presence of a target, the amplifier is quickly initiated. The target mRNA binds to the single-stranded toehold (denoted as domain 4*) on P5, followed by triggering a strand-displacement reaction to form a P5/P6/target three-stranded complex. Then strand P7 on the FT promptly binds to the exposed domain 2* on strand P5 and immediately triggers a new cascade strand-displacement reaction, leading to an intense fluorescence signal recovery owing to the effective physical separation of FAM from Dabcyl. Meanwhile, the target is also regenerated and will trigger a new cycle for signal gain. Unlike prevailing hairpin-based DNA amplification systems, these studies show that the newly developed hairpin-free signal amplification strategy is driven forward by entropy increase rather than by the free energy released by the formation of new base pairs.25 Benefiting from this unique and exclusive driving force, the total number of base pairs of the system remains unchanged during the amplification process, thus presenting fewer opportunities for circuit leakage and providing a more reliable platform for accurate detection.26 In addition, DNA tetrahedra, as newly emerged self-assembled DNA 3D nanomaterials, can be rapidly internalized through caveolin-dependent receptor-mediated endocytosis and can remain intact within cells for at least 48 h.27,28 Our recent study also showed that DNA tetrahedra could enhance nuclease resistance of the oligonucleotides on the nanostructure and perform excellent self-delivery without the help of transfection agents.29 This unique DNA tetrahedral framework was incorporated into the DNA amplifier, EDTD, in anticipation that it would potentially improve self-delivery with minimal nuclease interference for catalytic amplification in living cells.
Scheme 1.
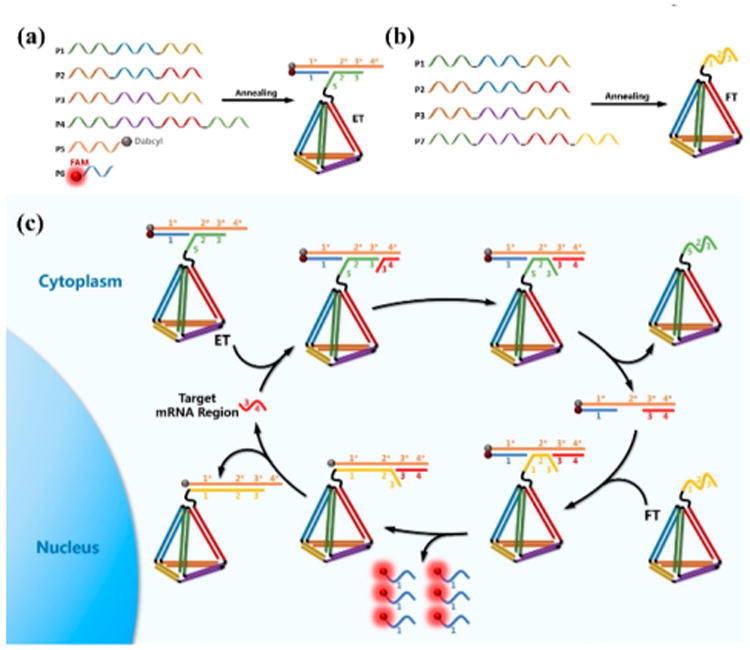
Assembly of the ET Module (a) and the FT Module (b); (c) Mechanism of EDTD for Catalytic Signal Enhancement of Specific mRNA Expression in Living Cells
Results and Discussion
Thermodynamics Calculations for an EDTD Amplified System
The entire process is shown as a reaction equation in Figure 1a, with the parameters labeled. The corresponding thermodynamic parameters are also shown. According to the Gibbs free energy equation,
Figure 1.
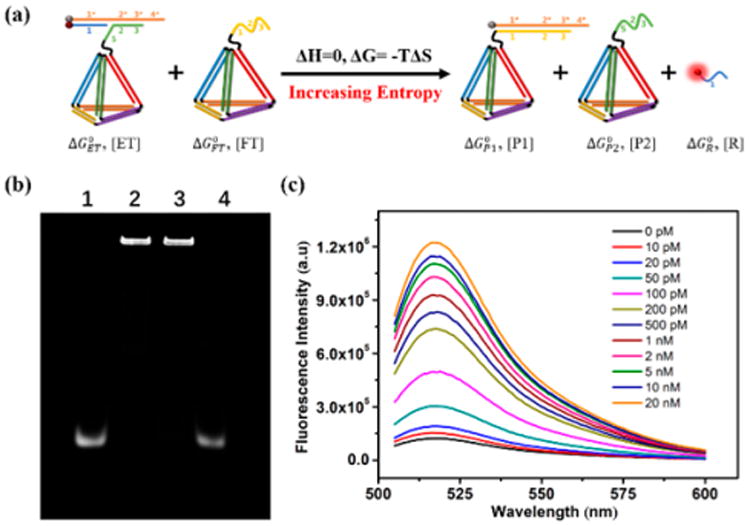
(a) Reaction equation of the DNA-amplified system with thermodynamic parameters. (b) A 3% agarose gel to analyze the conversion of the entropy-driven system. Lane 1: P6; lane 2: ET; lane 3: ET + FT; lane 4: ET+ FT + target. (c) Fluorescence response in the presence of different concentrations of synthetic DNA targets.
| (1) |
The total number of base pairs and the complementary region in the reactants and products are unchanged, giving ΔH ≈0. Hence, the reaction is driven forward thermodynamically by the entropic gain of the liberated molecules, and the driving force, at any time, is TΔS.
The final concentration of all species in this entropy-driven amplified system can be approximated. According to the van't Hoff equation, the Gibbs free energy change is given by
| (2) |
where Q is the reaction quotient, R is the gas constant (8.314 J/mol·K), T is the temperature in K, and is the standard free energy of species X under standard conditions, which could be calculated by using open source software, such as NUPACK or Mfold,30 giving
| (3) |
When the reaction is at equilibrium, which means ΔG = 0, the reaction quotient (Q) could be calculated as 4.07 in our experimental conditions, according to eqs 2 and 3. Meanwhile,
Suppose that the initial concentrations of ET and FT are both 100 nM and that the final concentration of R is x (expressed in units of nM); then, we can write the following equation:
Using the bisection method, x can be estimated to be between 99.99 and 99.999 nM, which would result in a potential systemic conversion of more than 99.99% without regard to the reaction time.
Preparation and Characterization of EDTD
Successful formation of ET and FT was first verified by use of 12.5% N-PAGE. As shown in Figure S1, with the addition of strands from lane 1 to lane 4, a significant reduction of electrophoretic mobility can be clearly observed, due to the increased molecular mass and more complex spatial construction. The results demonstrated that the tetrahedral backbone of ET had been successfully formed. Similarly, lane 5 (P1 + P2 + P3 + P7) indicates the successful formation of FT. By observing lane 6 (P1 + P2 + P3 + P4 + P6), we can see a new P6 band. However, the apparent disappearance of the P6 band in lane 7 (P1 + P2 + P3 + P4 + P5 + P6) can also be observed, suggesting that strands P5 and P6 were bound to the tetrahedral backbone to successfully form ET. Dynamic light scattering (Figure S2) measurement revealed that the mean hydrodynamic diameter of ET was above 29.7 nm and that of FT was above 26.2 nm.
Performance Evaluation of EDTD in Vitro
After demonstrating the successful construction of EDTD, its catalytic feasibility was investigated in the following experiments. TK1 mRNA, which is associated with cell division and is proposed to be a marker for tumor growth, was chosen as the specific model target.31 The catalytic feasibility of EDTD was first verified by using the DNA analogue of the mRNA target through agarose gel electrophoresis. The conversion was observed by fluorescence of FAM labeled on P6, and strand P10, a nonlabeled version of P5, was used as a substitute for strand P5 on ET in the gel electrophoresis experiment. As shown in Figure 1b, in the proof-of-concept assay, lane 3 (ET + FT) showed no new band. Only ET is observed. This indicates that cross-interaction between ET and FT is effectively blocked and the system leakage remains negligible in the absence of target DNA. However, after introducing target DNA, the reaction of ET and FT was initiated, and the system was quickly perturbed during the 1 h of reaction time. As shown in lane 4, almost all P6 on ET was converted to free strand P6, indicating that the target could effectively catalyze the reaction. Fluorescence kinetics was further investigated by real-time monitoring of changes in the fluorescence emission intensity of FAM. The results (Figure S3) showed that the system had a remarkable response toward the target, while system leakage remained insignificant (about 6.9%), closely paralleling the gel electrophoresis results. Motivated by the excellent sensing performance of EDTD, fluorometric titration of EDTD toward different concentrations of the target was subsequently carried out with a reaction time of 1 h. As shown in Figure 1c, a gradual increase in the fluorescence emission peak of FAM was observed when the target concentration was increased. Figure S4 illustrates the relationship between fluorescence enhancement and different concentrations of target DNA. The limit of detection (LOD) was calculated to be 3.3 pM based on the 3σ/slope rule, which is about 3 orders of magnitude lower than that of the conventional molecular beacon and linear hybridization probe. These results demonstrated the outstanding target response of EDTD as a reliable and robust DNA amplifier.
Apart from sensitivity, selectivity is also a crucial parameter by which to evaluate the performance of a newly developed biosensing DNA molecular machine. To test the selectivity of EDTD, we used various oligonucleotides, including matched, mismatched, deleted, and inserted DNA targets. As shown in Figure 2a, only the matched DNA triggered the reaction effectively and showed about 9.4-fold fluorescence enhancement. In contrast, only 1.7-fold to 2.2-fold fluorescence enhancement was observed with all other mismatched, deleted, and inserted targets, indicating prominent selectivity of EDTD. A standard colorimetric CCK-8 assay was also performed (Figure 2b), and the result showed that EDTD exhibits excellent biocompatibility.
Figure 2.
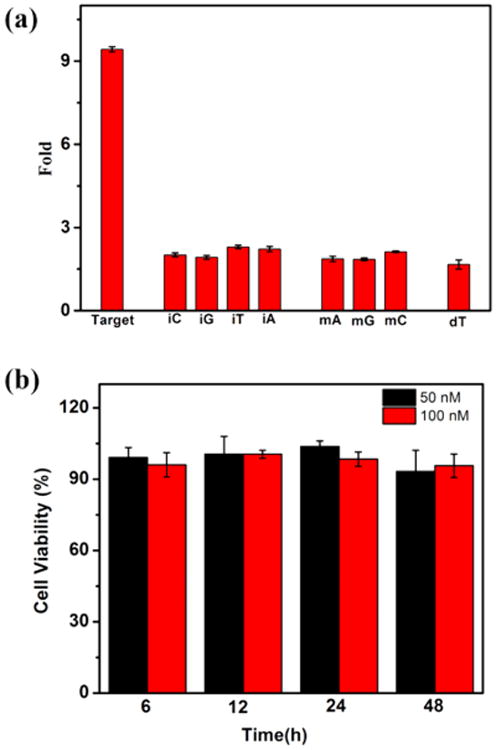
(a) Selectivity toward insertion (iC, iG, iT, iA), single-base substitution (mA, mG, mC), and deletion (dT). (b) Cell viability assay (CCK-8): HepG2 cells treated with EDTD (50 and 100 nM) for 6, 12, 24, and 48 h at 37 °C.
Conventional DNA molecular machines designed to work inside living cells confront intrinsic interferences caused by endogenous nuclease degradation, which will result in inevitable high false-positive signals. The EDTD was expected to display a significantly improved resistance to enzymatic digestion owing to its unique tetrahedron-like spatial structure. To verify this, we examined the ability of EDTD to resist nuclease attack by incubating EDTD (50 nM) in the presence of 10% fetal bovine serum (FBS) to closely mimic physiological conditions. A free entropy beacon (50 nM), termed Ebeacon, was chosen as the control probe. Compared with EDTD, Ebeacon has the same DNA sequence except for the DNA tetrahedral backbone. As shown in Figure 3, both Ebeacon and EDTD exhibited minimal fluorescence in buffer owing to the effective quenching of FAM by Dabcyl. However, a gradually increasing false-positive signal was clearly detected with the extension of incubation time when Ebeacon was incubated in the presence of 10% FBS. In contrast, a substantial delay was noted before any detectable degradation of EDTD, even during long-term incubation (6 h). These results suggest that the DNA tetrahedral backbone plays a decisive role in delaying nuclease degradation. It is believed that biostability of EDTD is achieved by the steric hindrance effect of the DNA tetrahedral backbone, which enhances nuclease resistance of the oligonucleotides on the nanostructure.
Figure 3.
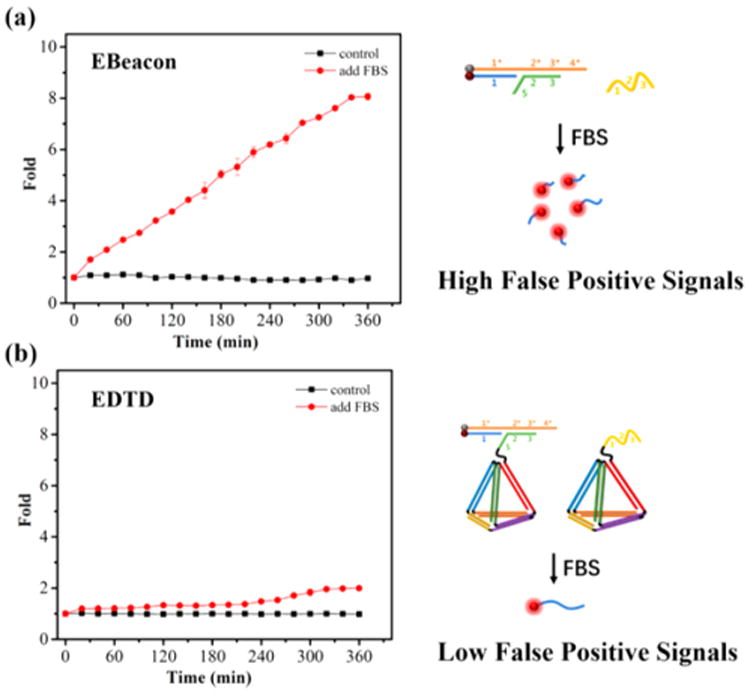
Fluorescent characterization of Ebeacon (a) and EDTD (b) degradation by incubating for the stated times in 10% fetal bovine serum.
Performance Evaluation of EDTD in Living Cells
The notorious cell permeability of nucleic acid molecules is another fundamental obstacle known to limit the applications of DNA molecular machines in living cells. Thus, improving their self-delivery ability would advance the exploitation of DNA nanotechnology in living cells. In order to investigate the intracellular uptake of EDTD, we next incubated HepG2 cells with EDTD and Ebeacon, respectively. As shown in Figure 4, almost no FAM fluorescence was observed in cells when incubated with Ebeacon. This suggested that Ebeacon is not suitable for imaging intracellular mRNA as a consequence of its poor permeability. In contrast, we saw an obvious fluorescence signal in HepG2 cells when incubated with EDTD. This result suggested that EDTD could significantly enhance self-delivery compared to the free Ebeacon molecular machine. Again, this effect could be attributed to the unique tetrahedral backbone. Meanwhile, this result also indicates that EDTD can perform intracellular imaging of mRNAs in live cells. In order to verify its intracellular imaging capability, an individual ET was also incubated with HepG2 cells. As shown in Figure 4, no fluorescence activation was observed in cells after incubation with ET alone. These results clearly demonstrated that EDTD possessed significantly improved self-delivery capability compared to the traditional DNA molecular machine, and it can be used to monitor low-expressing mRNA targets in living cells. In fact, the fluorescence imaging data (Figure S5) showed that the fluorescence signals in HepG2 cells were gradually increased with incubation time up to 4 h, indicating that this time point should be used in the following experiments.
Figure 4.
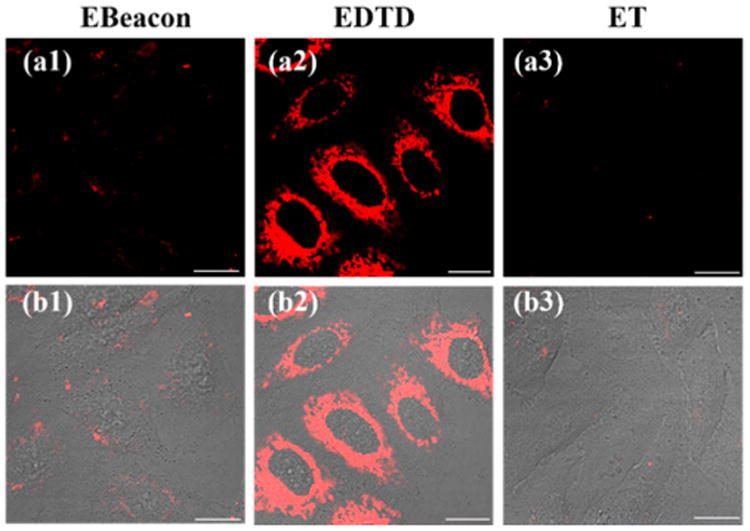
Fluorescence images of TK1 mRNA in HepG2 cells incubated with Ebeacon (1), EDTD (2), and ET (3), respectively. Fluorescence (a) and merged (b) images. Scale bar: 20 μm.
The efficient escape of the DNA machine from the lysosome that has a harsh acidic environment is a crucial factor for the in vivo applications of the machine. Alexa Fluor 488 is pH-insensitive in the pH range of 4 to 10. An Alexa Fluor 488 labeled ET was prepared to investigate the lysosomal escape of ET. Notably, most of the ET can escape from the lysosome and enter the cytoplasm (Figure S6), suggesting that the ET can efficiently escape from the lysosome to find the cytosolic target. The influence of endosomal acidity on the fluorescence of the ET was also investigated. As shown in Figure S7, the fluorescence of the ET with cells is in the “off” state due to the efficient quenching of FAM fluorescence by Dabcyl, which suggests that the acidic lysosomal environment and slightly alkaline cytoplasm environment do not cause obvious changes to the fluorescence of the ET. Additionally, in vitro tests further confirmed that pH variation causes insignificant changes to the fluorescence of the ET (Figure S8). These results suggest that the DNA machine can efficiently escape from the lysosome and the endosomal acidity has little interference on the detection system.
The relative expression levels of mRNA are different in different cell lines. Therefore, in order to investigate the specificity of EDTD in living cells, different cell lines, namely, HepG2 and HL7702, were selected. Figure S9 show that the expression level of TK1 mRNA in the HepG2 cell line is much higher than that in the HL7702 cell line, which is consistent with previous studies.32 The standard qRT-PCR was further used to investigate the expression levels of TK1 mRNA in these two cell lines. As shown in Figure S10, the HepG2 cell line showed a much higher (above 2.88-fold) expression level of TK1 mRNA than the HL7702 cell line. Overall, the findings suggested that EDTD may be able to distinguish among different cell lines with distinct target mRNA expression levels. Moreover, some low-expressing mRNAs may be further downregulated in tumorigenesis. Therefore, it would also be highly desirable, albeit challenging, to design and engineer a DNA molecular machine able to image intracellular targets of interest with downregulated expression levels. It has been reported that tamoxifen can induce the downregulation of TK1 mRNA expression.33 Before testing the performance of EDTD in imaging the different expression levels of mRNA in living cells, the effects of tamoxifen treatment on the cellular uptake of the DNA machine and on TK1 mRNA expression were investigated. The Alexa Fluor 488-labeled ET was incubated with HepG2 cells and tamoxifen-treated HepG2 cells, respectively. As shown in Figure S11, no obvious difference in fluorescent intensity is observed between the untreated HepG2 cells and tamoxifen-treated HepG2 cells, indicating that the cellular uptake of the DNA machine is not inhibited by tamoxifen treatment. Additionally, the effect of tamoxifen treatment on TK1 mRNA expression was further investigated by qRT-PCR, and the results showed that TK1 mRNA expression in tamoxifen-treated HepG2 cells decreases to about 50% of that in untreated ones (Figure S12). The EDTD was further challenged to image the TK1 mRNA in tamoxifen-treated HepG2 cells, as shown in Figure 5. The confocal results indicate that EDTD produced a weak, but still clearly observable, fluorescence signal in tamoxifen-treated cells compared with that of the untreated group. However, only a negligible fluorescence signal was observed from tamoxifen-treated HepG2 cells when using a reported DNA tetrahedron-based molecular beacon (DTMB) probe under the same conditions.32 As shown in Figure 5b, after treatment with tamoxifen, EDTD-incubated cells showed an average 3.0-fold fluorescence enhancement over that of cells incubated with DTMB. These results demonstrate that EDTD is suitable for monitoring a low amount of mRNA expression inside live cells owing to its effective amplification performance.
Figure 5.
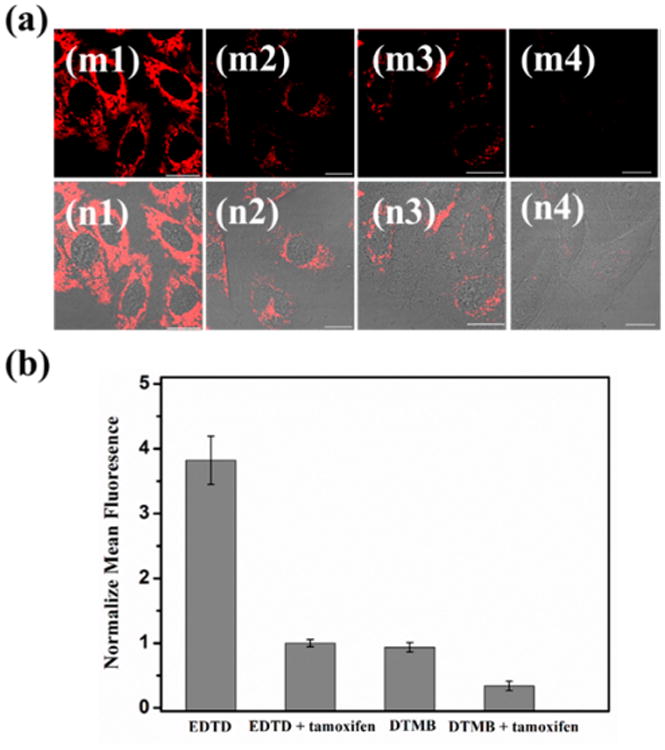
(a) Fluorescence image of TK1 mRNA with a reduced expression level. Left panels (1) are the EDTD-incubated group without treatment with tamoxifen. Middle panels (2) are cells treated with tamoxifen, followed by incubation with EDTD. Middle panels (3) are the DTMB-incubated group without treatment with tamoxifen. Right panels (4) are cells treated with tamoxifen, followed by incubation with DTMB. (m) Fluorescence. (n) Merged with DIC. Scale bars are 20 μm. (b) Histogram of the relative fluorescence intensity of the above four groups.
Conclusion
In summary, we have successfully developed a molecularly engineered, entropy-driven 3D DNA amplifier (EDTD) that can operate within living cells in response to a specific intracellular mRNA target. The entropy-driven signal amplification strategy offers very high sensitivity for intracellular biomolecule detection with minimal system leakage. Moreover, owing to molecular engineering of a unique DNA tetrahedral framework into the amplifier, EDTD exhibited significantly enhanced biostability and cellular delivery efficiency, which are prerequisites for DNA machines used for in vivo applications. It is further likely that the use of different functional nucleic acids, such as aptamers, DNAzymes, or ribozymes, in engineering this self-assembled DNA nanosystem will result in a DNA amplifier that can potentially be used to broaden the set of chemistries for intracellular ultrasensitive detection. Therefore, we anticipate that our strategy will make it possible to further expand the use of DNA nanotechnology in living cells and provide powerful DNA molecular tools with which to understand the chemistry of cellular systems.
Supplementary Material
Additional information as noted in text (PDF)
Acknowledgments
This work is supported by NSFC grants (NSFC 21521063 and NSFC 21327009) and by NIH GM079359 and NSF 1645215.
Footnotes
Associated Content: Supporting Information: The Supporting Information is available free of charge on the ACS Publications website at DOI: 10.1021/jacs.7b09789.
Orcid: Xiaobing Zhang: 0000-0002-4010-0028
Qiaoling Liu: 0000-0001-9487-0944
Quan Yuan: 0000-0002-3085-431X
Weihong Tan: 0000-0002-8066-1524
Notes: The authors declare no competing financial interest.
References
- 1.Montange RK, Batey RT. Annu Rev Biophys. 2008;37:117–133. doi: 10.1146/annurev.biophys.37.032807.130000. [DOI] [PubMed] [Google Scholar]
- 2.Doudna JA, Cech TR. Nature. 2002;418:222–228. doi: 10.1038/418222a. [DOI] [PubMed] [Google Scholar]
- 3.Ivics Z, Li MA, Mátés L, Boeke JD, Nagy A, Bradley A, Izsvák Z. Nat Methods. 2009;6:415–422. doi: 10.1038/nmeth.1332. [DOI] [PMC free article] [PubMed] [Google Scholar]
- 4.Davidovich C, Belousoff M, Wekselman I, Shapira T, Krupkin M, Zimmerman E, Bashan A, Yonath A. Isr J Chem. 2010;50:29–35. doi: 10.1002/ijch.201000012. [DOI] [PMC free article] [PubMed] [Google Scholar]
- 5.Han D, Wu C, You M, Zhang T, Wan S, Chen T, Qiu L, Zheng Z, Liang H, Tan W. Nat Chem. 2015;7:835–841. doi: 10.1038/nchem.2325. [DOI] [PMC free article] [PubMed] [Google Scholar]
- 6.Jiang Q, Song C, Nangreave J, Liu X, Lin L, Qiu D, Wang ZG, Zou G, Liang X, Yan H. J Am Chem Soc. 2012;134:13396–13403. doi: 10.1021/ja304263n. [DOI] [PubMed] [Google Scholar]
- 7.Yang X, Tang Y, Mason SD, Chen J, Li F. ACS Nano. 2016;10:2324–2330. doi: 10.1021/acsnano.5b07102. [DOI] [PubMed] [Google Scholar]
- 8.You M, Lyu Y, Han D, Qiu L, Liu Q, Chen T, Wu CS, Peng L, Zhang L, Bao G, Tan W. Nat Nanotechnol. 2017;12:453–459. doi: 10.1038/nnano.2017.23. [DOI] [PMC free article] [PubMed] [Google Scholar]
- 9.Ren K, Liu Y, Wu J, Zhang Y, Zhu J, Yang M, Ju HX. Nat Commun. 2016;7:13580. doi: 10.1038/ncomms13580. [DOI] [PMC free article] [PubMed] [Google Scholar]
- 10.Peng H, Li XF, Zhang H, Le XC. Nat Commun. 2017;8:14378. doi: 10.1038/ncomms14378. [DOI] [PMC free article] [PubMed] [Google Scholar]
- 11.Wu Z, Fan H, Nsr S, Wang W, Lake R, Jiang JH, Lu Y. Angew Chem, Int Ed. 2017;56:8721–8725. doi: 10.1002/anie.201703540. [DOI] [PMC free article] [PubMed] [Google Scholar]
- 12.Sun W, Ji W, Hall JM, Hu Q, Wang C, Beisel CL, Gu Z. Angew Chem, Int Ed. 2015;54:12029–12033. doi: 10.1002/anie.201506030. [DOI] [PMC free article] [PubMed] [Google Scholar]
- 13.Niu J, Hili R, Liu DR. Nat Chem. 2013;5:282–292. doi: 10.1038/nchem.1577. [DOI] [PMC free article] [PubMed] [Google Scholar]
- 14.Song J, Li Z, Wang PF, Meyer T, Mao CD, Ke YG. Science. 2017;357 doi: 10.1126/science.aan3377. 10.1126/science.aan3377. [DOI] [PubMed] [Google Scholar]
- 15.Dave N, Chan MY, Huang PJJ, Smith BD, Liu J. J Am Chem Soc. 2010;132:12668–12673. doi: 10.1021/ja106098j. [DOI] [PubMed] [Google Scholar]
- 16.Deng R, Zhang K, Sun Y, Ren X, Li J. Chem Sci. 2017;8:3668–3675. doi: 10.1039/c7sc00292k. [DOI] [PMC free article] [PubMed] [Google Scholar]
- 17.Wu Y, Yang CJ, Moroz LL, Tan W. Anal Chem. 2008;80:3025–3028. doi: 10.1021/ac702637w. [DOI] [PMC free article] [PubMed] [Google Scholar]
- 18.Yang Y, Huang J, Yang X, Quan K, Wang H, Ying L, Xie N, Ou M, Wang K. J Am Chem Soc. 2015;137:8340–8343. doi: 10.1021/jacs.5b04007. [DOI] [PubMed] [Google Scholar]
- 19.Wu C, Cansiz S, Zhang L, Teng IT, Qiu L, Li J, Liu Y, Zhou C, Hu R, Zhang T, Cui C, Cui L, Tan W. J Am Chem Soc. 2015;137:4900–4903. doi: 10.1021/jacs.5b00542. [DOI] [PMC free article] [PubMed] [Google Scholar]
- 20.Jiang YS, Bhadra S, Li B, Ellington AD. Angew Chem. 2014;126:1876–1879. doi: 10.1002/anie.201307418. [DOI] [PMC free article] [PubMed] [Google Scholar]
- 21.Jiang YS, Li B, Mlligan JN, Bhadra S, Ellington AD. J Am Chem Soc. 2013;135:7430–7433. doi: 10.1021/ja4023978. [DOI] [PMC free article] [PubMed] [Google Scholar]
- 22.Xuan F, Hsing IM. J Am Chem Soc. 2014;136:9810–9813. doi: 10.1021/ja502904s. [DOI] [PubMed] [Google Scholar]
- 23.Wu Z, Liu GQ, Yang XL, Jiang JH. J Am Chem Soc. 2015;137:6829–6836. doi: 10.1021/jacs.5b01778. [DOI] [PubMed] [Google Scholar]
- 24.Li L, Feng J, Liu H, Li Q, Tong L, Tang B. Chem Sci. 2016;7:1940–1945. doi: 10.1039/c5sc03909f. [DOI] [PMC free article] [PubMed] [Google Scholar]
- 25.Lv Y, Cui L, Peng R, Zhao Z, Qiu L, Chen H, Jin C, Zhang XB, Tan W. Anal Chem. 2015;87:11714–11720. doi: 10.1021/acs.analchem.5b02654. [DOI] [PMC free article] [PubMed] [Google Scholar]
- 26.Zhang DY, Turberfield AJ, Yurke B, Winfree E. Science. 2007;318:1121–1125. doi: 10.1126/science.1148532. [DOI] [PubMed] [Google Scholar]
- 27.Walsh AS, Yin H, Erben CM, Wood MJ, Turberfield AJ. ACS Nano. 2011;5:5427–5432. doi: 10.1021/nn2005574. [DOI] [PubMed] [Google Scholar]
- 28.Liang L, Li J, Li Q, Huang Q, Shi J, Yan H, Fan C. Angew Chem, Int Ed. 2014;53:7745–7750. doi: 10.1002/anie.201403236. [DOI] [PubMed] [Google Scholar]
- 29.He L, Lu DQ, Liang H, Xie S, Luo C, Hu M, Xu L, Zhang X, Tan W. ACS Nano. 2017;11:4060–4066. doi: 10.1021/acsnano.7b00725. [DOI] [PMC free article] [PubMed] [Google Scholar]
- 30.Zadeh JN, Steenberg CD, Bois JS, Wolfe BR, Pierce MB, Khan AR, Dirks RM, Pierce NA. J Comput Chem. 2011;32:170–173. doi: 10.1002/jcc.21596. [DOI] [PubMed] [Google Scholar]
- 31.Brabender J, Danenberg KD, Metzger R, Schneider PM, Park J, Salonga D, Holscher AH, Danenberg PV. Clin Cancer Res. 2001;7:1850–1855. [PubMed] [Google Scholar]
- 32.Xie N, Huang J, Yang X, Yang Y, Quan K, Wang H, Ying L, Ou M, Wang K. Chem Commun. 2016;52:2346–2349. doi: 10.1039/c5cc09980c. [DOI] [PubMed] [Google Scholar]
- 33.Li N, Chang C, Pan W, Tang B. Angew Chem, Int Ed. 2012;51:7426–7430. doi: 10.1002/anie.201203767. [DOI] [PubMed] [Google Scholar]
Associated Data
This section collects any data citations, data availability statements, or supplementary materials included in this article.
Supplementary Materials
Additional information as noted in text (PDF)


