

Abstract
The paper describes results of numerical evaluation of CASP12 models submitted on targets for which structural templates could be identified and for which servers produced models of relatively high accuracy. The emphasis is on analysis of details of models, and how well the models compete with experimental structures. Performance of contributing research groups is measured in terms of backbone accuracy, all-atom local geometry, and the ability to estimate local errors in models. Separate analyses for all participating groups and automatic servers were carried out.
Compared with the last CASP, two years ago, there have been significant improvements in a number of areas, particularly the accuracy of protein backbone atoms, accuracy of sequence alignment between models and available structures, increased accuracy over that which can be obtained from simple copying of a closest template, and accuracy of modeling of sub-structures not present in the closest template. These advancements are likely associated with more effective strategies to build non-template regions of the targets ab initio, better algorithms to combine information from multiple templates, enhanced refinement methods, and better methods for estimating model accuracy.
Keywords: CASP, protein structure prediction, high accuracy models, template-based protein modeling, numerical evaluation measures
1 Introduction
Template-based modeling is currently the most reliable type of protein structure prediction. A typical template-based modeling procedure involves, among others, two major steps: finding proteins with sequences similar to known structure(s) and building 3D models using the detected homologues as structural templates. Since the number of different protein folds is estimated to be limited and fold coverage increases with the growth of protein structure database1, the applicability of template-based modeling is ever growing.
Accuracy of protein models has increased dramatically from the early CASPs (mid- 1990s) to the present day. Now it is routinely expected that a good structural model can be built for a target sharing more than 20% of sequence with at least one known protein structure, while cases where good models are built at a lower sequence similarity are not unusual any more. In the latest three CASPs, almost all targets (96%) with homology over 20% were modeled to GDT_TS2>50 (usually implying a topologically correct structure3,4), and around half of the targets (51%) were modeled to a high accuracy of GDT_TS>80. For low homology targets (seq. id. <20%), contemporary modeling methods (CASP10-12) still generate models of good overall fold accuracy (GDT_TS>50) for more than half of the targets (56%), including 8% cases (16 targets) of high accuracy modeling (GDT_TS>80); while back in 1990s (CASP1-4), only 15% of such targets could be modeled to GDT_TS>50, and none to GDT_TS>80.
Typically, submitted models are automatically evaluated at the Prediction Center5-9 and then the results are interpreted by independent assessors. In recent CASPs, there has been only incremental progress in the template modeling category, and so no assessor was appointed in CASP12 and the analysis has been performed by Prediction Center staff and the CASP organizing committee. In the event, it turned out that there were interesting improvements in CASP12 and these are discussed below.
2 Materials and methods
2.1 | Evaluation measures
A wide suite of numerical measures has been used in CASP to assess accuracy of tertiary structures (see Measures paper, this issue). In this evaluation we chose to use (1) the rigid-body structure superposition measure GDT_HA10,11, (2) three all-atom local structure-based measures – LDDT12, CADaa13 and SphereGrinder (SG)6, and (3) a measure of the accuracy of local error estimates ASE14. The GDT_HA measure and local measures have been already used in previous TBM assessments15,16 and have proved useful. The GDT_HA scores are highly correlated with the widely used in CASP GDT_TS scores2 and are usually 10-20 points lower for the same models. The ASE measure was previously used to score model accuracy estimates14, and is used here to emphasize the importance of predicting atomic level errors. The CASP tertiary structure prediction format (http://predictioncenter.org/casp12/index.cgi?page=format#TS) requires predictors to provide the atomic error estimates in the temperature factor column of the PDB file. The ‘ground truth’ deviations of atoms in models from their experimental counterparts are calculated from the optimal model-target superposition established by the LGA program17. The aforementioned measures (1)-(3) highlight different aspects of model utility (global fit, all-atom local accuracy, and correctness of local error estimates) and are given equal weight in evaluating an overall relative model quality score (see below). For ranking purposes, we first calculate z-scores (a.k.a. standard scores) for each of the measures according to the following procedure. First, z-scores are calculated from the distribution of raw scores for all models submitted on a target. Then, apparent outliers (i.e., models that scored two standard deviations or more below the average) are excluded, and the standard scores are re-calculated based on the mean and standard deviation of the outlier-free model set. All models that scored below the average (i.e. those with negative z-scores) are assigned z-score of 0 in order not to over-penalize the groups attempting novel strategies. If a group did not submit a prediction on a target or it was impossible to calculate an evaluation score (e.g., ASE score for predictions without self-estimates of accuracy), z-scores were also assigned zero value. The target-based z-scores are then summed for each group (separately for every measure) and combined in the final ranking with the following weights:
Since the measures in the final ranking formula were developed only after CASP7, for evaluation of progress and comparison of CASP12 results with those from previous CASPs we also use the GDT_TS measure (see Measures paper, this issue), which was in use in CASP since CASP42.
2.2 | Targets
Based on the performance of the best CASP servers and template availability, CASP12 targets were separated into three difficulty categories: easy (a.k.a. template-based modeling or TBM), hard (a.k.a. free modeling or FM), and borderline easy/hard (a.k.a. TBM/FM) (see Domain definition paper, this issue). A target was defined as easy (TBM) if the average GDT_TS score of top 20 server models was 50 or higher and there were clearly identifiable templates. Targets with insignificant homology to known structures and the average GDT_TS score of top 20 server models below 50 were defined as hard (FM). The remaining cases were designated as TBM/FM. This paper provides an assessment of models submitted on TBM and TBM/FM targets. The assessed target set includes 38 TBM evaluation units (EUs) and 19 borderline TBM/FM EUs. CASP targets were released for prediction in two prediction tracts: those lacking strong sequence similarity were released to all prediction groups and those with apparent sequence similarity were for servers only. Twelve targets out of 38 TBM EUs and 17 out of 19 TBM/FM EUs came from the all-group targets; the remaining from the server-only targets.
2.3 | Predictions
In CASP, predictors are allowed to submit five models per target. In the TBM assessment, the assessors usually limit themselves to assessing only the models assigned by predictors as model number 110,11,15,16,18-21 (supposedly the best models), and for ranking purposes we followed this practice. For establishing the progress between different CASPs, we took into account all submitted models.
3 | Results
3.1 | Any progress? Yes, finally
Two of the main CASP goals are to provide an objective assessment of current abilities and inabilities in the area of protein structure modeling and to establish if there has been progress from earlier CASPs. The last few CASPs have shown very limited progress in the template-based modeling, with the overall accuracy of models largely unchanged since CASP5. This CASP we saw signs of measurable progress in at least four areas of TBM: 1) Overall backbone accuracy, 2) Overall accuracy as measured by improvement over the best template, 3) Accuracy of regions structurally divergent from a principal template, and 4) Overall alignment accuracy. We discuss each of these aspects below and present graphical summaries of the results in Figures 1-4.
Figure 1.

GDT_TS scores of the best and median models submitted on the template-based modeling targets (including TBM and TBM/FM domains) in CASP5 and CASPs11-12. Points represent best models for each target in CASP11 and CASP12. Data are for the all-group targets in the CASPs 11 and 12 CASPs and for all targets in CASP5. Apparently, the high outlier for target T0868 is pulling the CASP12 trend line (solid black line) up at the hard difficulty end, but even without this outstanding target, the CASP12 trend line (dotted and dashed black line) stays above the CASP5 and CASP11 lines. Specifics of the labeled in the graph targets are discussed in a separate section below.
Figure 4.

Percentage of correctly aligned residues (AL0) for the best models submitted on the template-based modeling targets (including TBM and TBM/FM domains) in CASP5 and CASPs11-12, and the maximum percentage of residues that could be aligned using the single best template (i.e., maximum alignability) on CASP12 targets as functions of target difficulty. A model residue is considered correctly aligned if the Cα atom falls within 3.8Å of the corresponding atom in an optimal model-target superposition, and there is no other experimental structure Cα atom nearer. A template residue is considered alignable if there is at least one experimental residue that is within 3.8Å (in terms of the Cα-Cα distance) in an optimal template-target superposition. The maximum alignability is the percentage of aligned residues in the longest alignment between the best template and the experimental structure built with the dynamic programming procedure in such a way that no alignable residue is taken twice and all residues in the alignment are in the order of the sequence. The data in the graph are provided for the all-group targets in the latest two CASPs and for all targets in CASP5. The maximum alignability line (dotted black line) shows that CASP12 predictions (solid black line) on harder template-based targets exceeded the alignability limit for single templates. The detailed analysis shows that such result is a consequence of presence of extraordinary well modeled target T0868 in the dataset. While this target has maximum alignability of only 63% (marked on the graph), 90% of its residues were correctly aligned in the best model due to ab initio modeling of non-template regions and successful refinement (as discussed below). Removing T0868 from the target set brings the alignment line for CASP12 models (dotted and dashed black line) about 5% below the maximum single-template alignability line in the whole range of target difficulty.
To measure improvement in the overall backbone accuracy of the TBM models, we compared GDT_TS scores of the best models (and median models) submitted on targets of similar prediction difficulty in different CASPs. Target difficulty is defined as a linear combination of best structural template coverage and sequence identity of the target to the best template. The procedure used was similar to that reported in CASP papers describing overall progress in tertiary structure modeling22-24. Figure 1 shows the backbone accuracy of template-based models for the latest two CASPs, 11 and 12, and for CASP5 (at which time progress from earlier CASPs had plateaued). Trend lines in CASP12 (for both the best and median models) run noticeably higher than the corresponding trend lines for CASP11, indicating improved performance in CASP12. Backbone accuracy of the best CASP12 models is about 10 GDT_TS units better than that of CASP11 models in the medium range of target difficulty and more than 15 GDT_TS units higher for the most difficult template-based modeling targets. If judged by the accuracy of median models, CASP12 methods are about 10 GDT_TS units better than CASP11 methods across the full range of target difficulty. Comparing individual data points it is apparent that only one CASP12 template-based modeling target had no models scoring above GDT_TS=50 and only six targets had no models scoring above GDT_TS=60, while in CASP11 these numbers were significantly worse (11 and 16, respectively). As one can see, there are several outliers at both ends of the accuracy spectrum. We discuss aspects of specific targets in a later section of the paper and discuss possible reasons for the improved performance in Conclusions.
The higher accuracy of the main chain prediction in CASP12 models is also supported by comparison of the best models with naïve models built by copying the coordinates of the aligned residues from the best available structural template. Figure 2 shows the difference in GDT_TS scores between such models. In CASP12, for the first time all the best template-based models were better than the naïve models built for the same target (all data points being above the ΔGDT_TS=0 line). The improvement in backbone accuracy exceeded 10 GDT_TS units for 12 CASP12 domains, while in CASP11 there were only 5 such domains. The CASP12 trend line is markedly above those from other CASPs, clearly indicating better performance.
Figure 2.
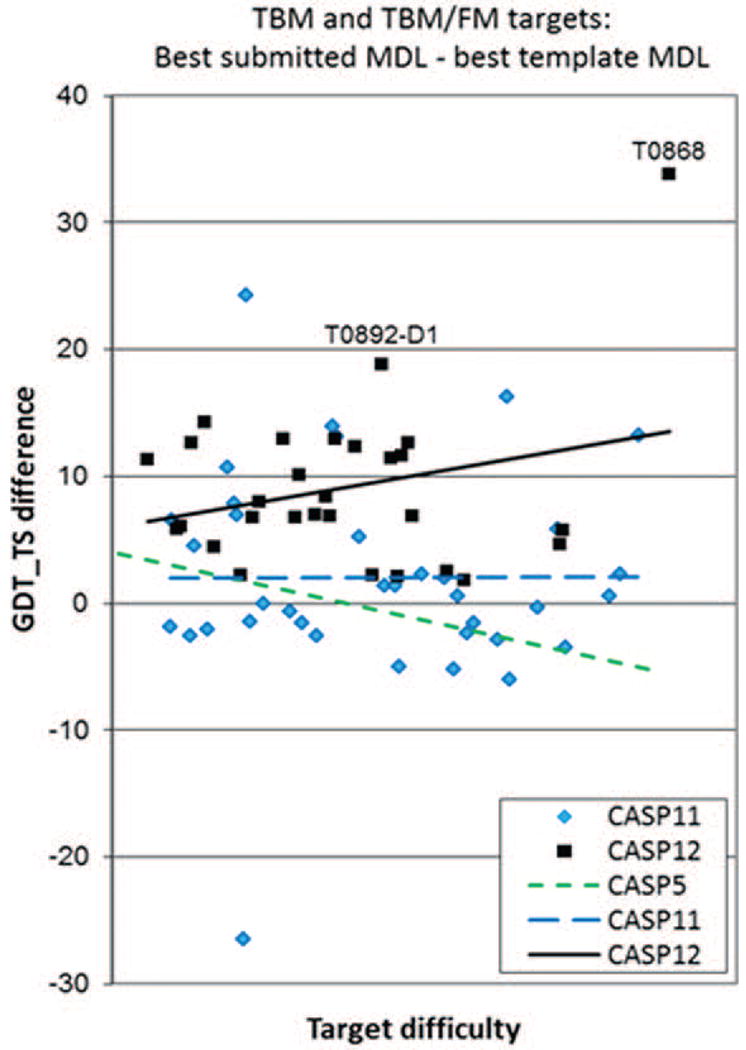
Difference in GDT_TS score between the best submitted model for each target and the corresponding naïve model built by simple copying of the backbone atoms for the aligned residues of the best single template. Values greater than zero indicate added value in the best model. In contrast to CASP11, value was added for every target in CASP12, and in general the increase is greater than in CASP11. Targets T0868 and T0892-D1 are examples, where the best models were significantly better than the models built on a single best template, due to combining of multiple templates.
Modeling of the non-principal template covered regions is often key to correctly characterizing functional differences between the template protein and the target. Figure 3A shows the percentage of non-template residues that are correctly predicted (C-alpha atom error less than 3.8 Angstroms) in the best model, while figure 3B shows difference between the % of such residues (i.e., the data for Fig. 3A) and % of incorrectly predicted residues for those that align with the best template). Both panels indicate big improvement from CASP5 to CASP11 and further progress from CASP11 to CASP12, over the whole target difficulty range. Especially impressive is the CASP11-CASP12 progress in the net gain (panel B). The average structural coverage histograms (insets) show a CASP11 to CASP12 improvement of about 7%, from -3% to 4%, in the net modeling gain and about 3%, from 30 to 33, in modeling of the non-template residues. Thus, about half of the improvement is in the alignable regions, and half in the non-alinable regions. It is also worth mentioning that CASP12 was the first CASP where the average net modeling gain was positive (i.e., more non-template residues were correctly modeled than template residues misplaced).
Figure 3.

(A) Percentage of correctly predicted non-template residues, and (B) difference between the percentages of correctly predicted non-template residues and incorrectly predicted template residues. The data are provided for targets with at least 15 residues missing in the best template. A residue is considered as correctly aligned/predicted in the template/model if its Cα error is less than 3.8Å in the optimal LGA superposition. Values greater than zero in panel (B) indicate net gain in the modeling (i.e., more correctly predicted residues from those missing in the template than incorrectly predicted residues from those available in the template). The best model for target T0868 (the highest positive outlier marked in panel B) includes substantial portion of the structure that was not available from the best templates and was modeled ab initio.
It is a well-known fact and a long-standing problem in the template-based modeling that model accuracy is dominated by alignment accuracy, together with the fraction of residues that can be aligned to the available template. To measure alignment accuracy, we compute the AL0 score2,25, representing the number of correctly aligned residues in the LGA 4Å superposition of the modeled and experimental structures. Figure 4 shows that alignment in CASP12 is significantly better than in previous CASPs, with the average accuracy around 70% for the targets from the middle range of difficulty, compared to around 60% in CASP11 and 50% in CASP5. Note that these numbers are the percentage of all residues, not the percentage of alignable residues. The maximum alignability line for CASP12 shows that the maximum possible values are not much larger and the alignment errors are quite small - about 5% over the whole range of target difficulty. The trend lines in figures 4 and 1 are similar, confirming the dependence of overall model accuracy on the alignment accuracy.
3.2 | Targets with unusually high or low accuracy for their difficulty range
T0868 (Figure 5A) is the target representing unusually high modeling performance in Figures 1-4. This target is a bacterial CdiA tRNase toxin in complex with its immunity protein CdiI26 (PDB ID - 5j4a). The success in modeling of this target results from the ability of the best server, Baker-Rosettaserver, to 1) recognize the best evolutionary related template, 4g6u (Figure 5D), which is not the highest-scoring sequence template (Figure 5E) or the highest-scoring structural template (Figure 5F); 2) accurately model structure fragments not present in the templates, especially the second part of helix α1 together with the loop and the first part of strand β1 (residues 55-65), α2a helix with the leader (residues 90-106), and α4 helix (residues 150-156) – see Figure 5G; and 3) successfully refine the composed model to GDT_TS=76.5 (Figure 5B). The successful modeling of the missing structure bits was achieved through an ab-initio-style iterative refinement procedure (see the paper from the Baker group elsewhere in this issue), which performs an iterative insertion and refinement of fragments missing in the templates. With this technique, the improvement in model accuracy may arise from either ab initio modeling, combining templates, or both. Further improvement in model accuracy was achieved by the refinement dedicated approaches (the top 6 models on this target all come from the groups focused on the development of the refinement techniques), the best of which, Laufer_seed, used the Rosettaserver model in their molecular dynamics refinement, and was able to correct the alignment error in the β3 - α2a connector (residues 90-96, Figure 5H) and bring the model closer to the native structure in several other regions (Figure 5G). The final Laufer_seed model appeared to be a high-accuracy model scoring GDT_TS=86.6 (Figure 5C).
Figure 5.

Target T0868 (panel A) with its models (panels B,C), templates (panels D-F), and alignment plots (panels G,H). (A) The native structure of target T0868 rainbow-colored from N-terminal (blue) to C-terminal (red). (B-F) Structural alignment of the target (cyan, Cα trace) and: (B) the best server model TS005_1 (Baker-Rosettaserver, green cartoon); (C) the best overall model TS330_2 (Laufer-seed, blue); (D) the most often used by the CASP12 predictors evolutionary related template (4g6u, red); (E) the highest scoring HHsearch sequence template (2ghz, magenta); (F) the highest scoring LGA structural template (2cw6, yellow). (G) Cα-Cα distances between the target residues and the aligned residues in the best evolutionary related template (red dotted line), best server model (green), and the overall best model (blue). Lower values indicate closer residues, and thus better modeling. The secondary structure diagram of the target is provided at the bottom of the panel, with the regions shown in panel A marked on the sequence. (H) Position-specific alignment of the best models to the target structure. The models are sorted according to the number of correctly aligned residues. Green color shows regions of perfect alignment in the optimal sequence-independent LGA superposition, yellow – residues misaligned by no more than 4 positions along the sequence, red – misaligned by 5 or more residues, and white - not aligned. Three regions of the target: 1) the second part of helix α1 together with the loop and strand β1, 2) the first part of the second helix before the kink, α2a, and 3) the small C-terminal helix α4 are missing in the templates (D-F), but included in the models (panels B, C). Two other structural fragments - the β2-loop-β3 and the α3 helix - have different orientation in the best templates, but are well placed in the models (green and blue lines run noticeably lower than the red dotted line in panel G). The best model from an expert group (C) shows overall improvement over the best server model (B) due to the successful refinement (blue line runs generally lower than the green line in panel G). In particular, the best expert model (T0868TS330_2, boxed in the top part of panel H) was able to fix the alignment error in the best server model (T0868TS005_1, boxed at the bottom) in the connector (residues 90-96) between the β3 strand (84-89) and the α2a helix (residues 97-106); and move the regions α1-β1 and α2b towards native structure.
Target T0892-D1 represents the N-terminal domain of the uridine diphosphate glucose glycoprotein (PDB ID – 5nv4). It is another example of combining multiple templates and successful ab initio modeling. The best server model on this target came from the Baker-Rosettaserver (GDT_TS=81.1), which combined fragments from multiple templates (3bci, 3bck, 3bd2, 3dvx, 3eu3, 3gha, 3gmf, 3hz8, 4z7x, 5c00) in their modeling. The success of this procedure provides more evidence of the effectiveness of current template hybridization approaches. The second-best server model was only 1.4 GDT_TS units behind the best and came from the Zhang-server. The good accuracy of this model is mainly due to the QUARK ab initio simulations (personal communication). The additional factor that likely contributed to the success was alpha-helical nature of the protein, for which QUARK usually has a better efficiency to fold.
Success in modeling domain T0898-D2 is likely associated with the successful combination of templates covering different parts of the target. Figure 6A shows alignment of the top four templates. It can be seen that the first two templates cover the target deeper into the C-terminal region, while the third and fourth templates are better in the N-terminal region (regions with mostly yellow and orange colors). Combining templates that cover different regions appears to have helped building more accurate models for this target. As it can be inferred from Figure 6B, the best submitted model (TS126_4_2 from the EdaRose group, blue) seems to be built on two different templates, as it closely follows the 3k7a template in the first part of the sequence, and the 2lg1 template in the last part. Conversely, the second-best model (TS287_5 from the Multicom-cluster group, green) closely follows a single template (3k7a) along the whole domain sequence. As a result, model TS287_5 is less accurate in the C-terminal region and loses 5.5 GDT_TS points in the overall model accuracy, compared to the best model.
Figure 6.
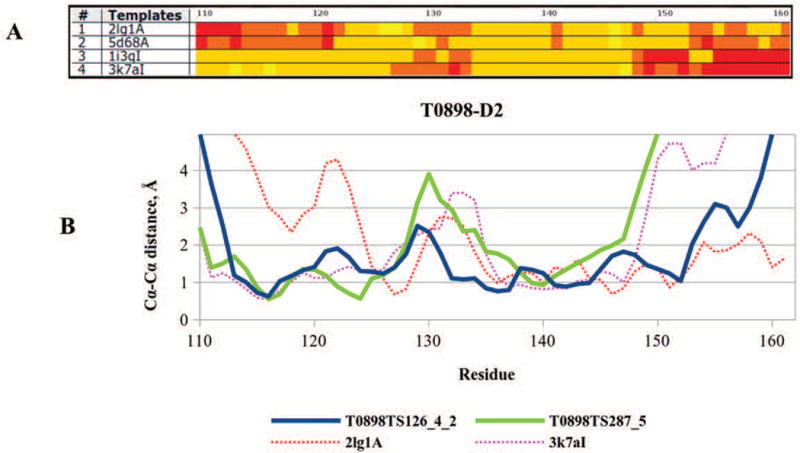
(A) The template - target Cα-Cα deviation for the top four templates (sorted according to the LGA_S score) of T0898-D2. Yellow color marks regions with the distance <0.5 Å, orange 0.5-2 Å, light red 2-5 Å and dark red >5 Å. (B) Proximity of the target residues to the aligned residues in the best model (TS126_4_2, EdaRose, blue line), second-best model (TS287_5, Multicom-cluster, green line), top template (2lg1A, red dotted line) and the fourth template (3k7aI, magenta dotted line). The green line closely follows the magenta line, indicating that the second-best model was built on template 3k7aI.
The best server model for target T0882 (Figure 7A), a hypothetical domain from the serine/threonine-protein kinase WNK1 (PDB ID – 5g3q), was built by the Baker_Rosettaserver (TS005_2, Figure 7B) using the structure of protein 2v3s as a main template (Figure 7C). As it can be seen from the alignment plot (Figure 7F), the model (blue line) closely follows this template (red) except for the first approximately 15 residues, where the template misses a β-strand. However, the missing strand is present in other high-scoring templates - 2lru (Figure 7D) and 2kt9 (Figure 7E), and the Rosetta combined the N-terminal strand from these templates with the rest of the structure from 2v3s (Figure 7F) to build a complete model (personal communication), which was subsequently refined to GDT_TS=90.8 (Figure 7B).
Figure 7.

Target T0882 (panel A) with its best server model (panel B), templates (panels C-E), and the alignment plot (panel F). (A) The native structure of target T0882 rainbow-colored from N-terminal (blue) to C-terminal (red). (B-E) Structural alignment of the target (cyan, Cα trace) and (B) the best server model TS005_1 (Baker-Rosettaserver, blue cartoon); (C) the main template used in the Rosetta modeling (2v3s, red); and auxiliary templates (D) 2lru, magenta; and (E) 2kt9, yellow. (F) Cα-Cα distances between the target residues and the aligned residues in the main template 2v3s (red dotted line), auxiliary template 2lru (magenta dotted line), and the best server model (blue). The main template (C) misses target’s (A) first strand, which is successfully modeled from auxiliary templates (D) and (E).
Besides the targets with unusually high scores for their difficulty range, Figure 1 shows a couple of targets - T0874 and T0875, with unusually low scores. T0875 (LV2A2) is a protein from Ljungan virus and T0874 (HPeV1) from Human Parechovirus A. The two proteins are related to each other at around 50% sequence identity. Even though the best structural templates (4dot, 4dpz) were found by the servers, the templates appeared to be hard to improve on. The best models scored only 54 and 45 LGA_S points on targets T0874 and T0875, respectively, and these scores are just slightly better than the scores of the best templates (46/42 LGA_S, respectively). Closer inspection reveals that the best templates cover only the N-terminal parts of the proteins, and while there were also templates covering the C-terminal parts of the proteins, no group managed to combine information from multiple templates to more accurately model the whole protein. It should be mentioned that both proteins contain flexible loops (excluded from the evaluation) and the segments that are covered in complementary templates are located at different sides of the loops. This may have caused an additional complication in modeling these targets.
3.3 | Group rankings
In this CASP we ranked participating TBM groups based on the accuracy of model backbone, the similarity of local model features to those of the target (contact patterns, distance maps and local substructures) and the accuracy of per residue error estimates. All these model attributes are combined in the final ranking formula provided in Methods. All participating groups are compared on the subset of all-group TBM and TBM/FM targets (see domain classification paper, this issue); servers are also separately ranked on all TBM and TBM/FM targets (Figure 8). The ranks are based on the cumulative Z-scores with negative per-target values set to 0 (as described in Methods), but the rankings do not change much for different Z-score calculation approaches (please see the Prediction Center website http://predictioncenter.org/casp12/zscores_final.cgi?formula=assessors). Figure 8A identifies four groups – McGuffin, VoroMQA-select, Zhang and ProQ2, which show better results than the rest of predictors. The methodologies of the first, second and fourth groups are largely based on the meta-predictor approach, and use accuracy assessment methods to pick the best models from the available set of CASP server models, followed by subsequent model refinement. The methodology of the Zhang human-expert group is based on the I-TASSER prediction pipeline27, which uses all CASP server models as an input. Among servers, two servers from the Zhang group, Zhang-server and QUARK, are at the top of the ranking chart (Figure 8B). Brief descriptions of the best-performing TBM groups can be found in the online CASP12 Abstract Book (http://predictioncenter.org/casp12/doc/CASP12_Abstracts.pdf).
Figure 8.

Performance of (A) all CASP12 groups on a subset of all-group (a.k.a. human) TBM + TBM/FM targets and (B) server groups on a complete set of TBM + TBM/FM targets. Human methods are in blue, servers in red. The data for all groups (panel A) are provided for the top 50 methods only (tables including all groups are available online). Groups are ranked based on the sum of per-target Z-scores calculated from the distribution of first model scores; negative Z-scores are set to 0 before the summation. Z-scores from different measures are combined in the formula Total_z = 1/3*z_GDT_HA + 1/9*(z_LDDT+z_CADaa+z_SG) + 1/3*z_ASE.
To establish the statistical significance of differences in group performance, we applied t-tests (requiring normal distribution of the data) and the Wilcoxon tests (not requiring normal distribution of the data) to each pair of top performing groups and carried out a head to head comparison of the results on the common sets of predicted targets. Outcomes of t-tests and Wilcoxon tests are very similar. Since the majority of CASP12 per-target results are non-normally distributed, we report here only the results of the Wilcoxon tests. Table 1 shows the data for the best 20 ranked groups among (A) all groups and (B) server-only groups. Panel (A) demonstrates that the top ranked group, McGuffin, is statistically indistinguishable from the following eight groups, including three groups - VoroMQA_select, Zhang and ProQ2 that show very similar results to those of the McGuffin group (pairwise p-values ≥0.8). For the top nine predictors (also including the Wallner, MULTICOM, wfRos-ProQ-ModF6, Seok-refine and Zhang-Server groups), 31 out of 36 pair-wise statistical tests could not reject the null hypothesis of the similarity of these groups at the 95% confidence level. The head to head comparison of the top performing groups (Table 2A) shows that top nine groups have also comparable percentage of wins and losses (with small exceptions). The VoroMQA_select group outperforms all groups on more than half of the targets with a win margin of over 25% for all but 5 groups. In general, the results of the head to head tests are in agreement with the results of the Wilcoxon tests: in 88% of cases the groups that have similar/different head-to-head results are correspondingly statistically indistinguishable/different according to the Wilcoxon tests (i.e., shading of cells in (A)-panels of Tables 1 and 2 coincide). This tendency holds true for server-only results, with shading of corresponding cells in (B)-panels of Tables 1 and 2 coinciding in 95% of cases. Results of two server methods - Zhang-server and QUARK, both from Yang Zhang’s group - are indistinguishable between themselves and better than those from all other groups. These servers are also better than all the others in head-to-head comparisons.
Table 1.
Results of the Wilcoxon signed rank tests on combined z-scores according to five evaluation measures (see Materials for the formula) for (A) all groups on ‘human’ targets and (B) server-only groups on all released targets. The upper right part of the table shows the numbers of common domains predicted. The lower part displays the probabilities that the differences between two combined z-scores are due to chance (values below 0.05 are marked as ‘<’ for compactness). Shaded cells highlight pairs of statistically indistinguishable groups at the 0.05 significance level. Server methods are in italics.
| (A) | |||||||||||||||||||||
|---|---|---|---|---|---|---|---|---|---|---|---|---|---|---|---|---|---|---|---|---|---|
| 1 | 2 | 3 | 4 | 5 | 6 | 7 | 8 | 9 | 10 | 11 | 12 | 13 | 14 | 15 | 16 | 17 | 18 | 19 | 20 | ||
| McGuffin | 1 | - | 29 | 29 | 29 | 29 | 29 | 28 | 29 | 29 | 29 | 29 | 29 | 27 | 28 | 29 | 29 | 27 | 29 | 29 | 29 |
| VoroMQA-select | 2 | 0.8 | - | 29 | 29 | 29 | 29 | 28 | 29 | 29 | 29 | 29 | 29 | 27 | 28 | 29 | 29 | 27 | 29 | 29 | 29 |
| Zhang | 3 | 1.0 | 0.4 | - | 29 | 29 | 29 | 28 | 29 | 29 | 29 | 29 | 29 | 27 | 28 | 29 | 29 | 27 | 29 | 29 | 29 |
| ProQ2 | 4 | 0.9 | 0.5 | 0.3 | - | 29 | 29 | 28 | 29 | 29 | 29 | 29 | 29 | 27 | 28 | 29 | 29 | 27 | 29 | 29 | 29 |
| Wallner | 5 | 0.1 | 0.2 | < | 0.3 | - | 29 | 28 | 29 | 29 | 29 | 29 | 29 | 27 | 28 | 29 | 29 | 27 | 29 | 29 | 29 |
| MULTICOM | 6 | 0.2 | < | < | 0.2 | 0.9 | - | 28 | 29 | 29 | 29 | 29 | 29 | 27 | 28 | 29 | 29 | 27 | 29 | 29 | 29 |
| wfRos-ProQ-ModF6 | 7 | 0.2 | 0.3 | 0.5 | 0.6 | 0.8 | 0.8 | - | 28 | 28 | 28 | 28 | 28 | 26 | 28 | 28 | 28 | 26 | 28 | 28 | 28 |
| Seok-refine | 8 | 0.2 | 0.1 | 0.1 | 0.1 | 0.4 | 0.9 | 0.7 | - | 29 | 29 | 29 | 29 | 27 | 28 | 29 | 29 | 27 | 29 | 29 | 29 |
| Zhang-Server | 9 | 0.1 | < | < | 0.6 | 1.0 | 0.8 | 0.5 | 0.5 | - | 29 | 29 | 29 | 27 | 28 | 29 | 29 | 27 | 29 | 29 | 29 |
| LEEab | 10 | < | < | < | < | < | < | < | < | < | - | 29 | 29 | 27 | 28 | 29 | 29 | 27 | 29 | 29 | 29 |
| LEE | 11 | < | < | < | < | < | < | < | < | < | 0.5 | - | 29 | 27 | 28 | 29 | 29 | 27 | 29 | 29 | 29 |
| QUARK | 12 | < | < | < | 0.2 | 0.2 | 0.7 | 0.2 | 0.7 | < | < | < | - | 27 | 28 | 29 | 29 | 27 | 29 | 29 | 29 |
| wfAll-Cheng | 13 | < | < | < | 0.2 | 0.1 | 0.1 | 0.2 | 0.5 | 0.2 | < | < | 0.9 | - | 26 | 27 | 27 | 25 | 27 | 27 | 27 |
| raghavagps | 14 | < | < | < | 0.1 | < | < | 0.1 | 0.4 | < | 0.1 | 0.1 | 0.2 | 0.5 | - | 28 | 28 | 26 | 28 | 28 | 28 |
| BAKER | 15 | < | < | < | < | < | < | < | < | < | < | < | < | < | < | - | 29 | 27 | 29 | 29 | 29 |
| Jones-UCL | 16 | < | < | < | < | < | < | 0.1 | 0.1 | < | 0.5 | 0.3 | 0.1 | 0.2 | 0.6 | < | - | 27 | 29 | 29 | 29 |
| Chicken_George | 17 | < | < | < | < | < | < | 0.1 | < | < | 1.0 | 0.8 | < | < | < | < | 0.4 | - | 27 | 27 | 27 |
| MUFOLD | 18 | < | < | < | < | < | < | < | < | < | < | < | < | < | < | 0.4 | < | 0.1 | - | 29 | 29 |
| wfMESHI-Seok | 19 | < | < | < | < | < | < | < | < | < | 0.7 | 1.0 | < | < | 0.1 | < | 0.2 | 0.9 | < | - | 29 |
| Pcomb-domain | 20 | < | < | < | < | < | < | < | < | < | < | < | < | < | < | < | < | < | < | < | - |
| (B) | |||||||||||||||||||||
|---|---|---|---|---|---|---|---|---|---|---|---|---|---|---|---|---|---|---|---|---|---|
| 1 | 2 | 3 | 4 | 5 | 6 | 7 | 8 | 9 | 10 | 11 | 12 | 13 | 14 | 15 | 16 | 17 | 18 | 19 | 20 | ||
| Zhang-Server | 1 | - | 57 | 57 | 57 | 57 | 57 | 57 | 57 | 57 | 57 | 57 | 57 | 57 | 57 | 53 | 56 | 57 | 57 | 57 | 57 |
| QUARK | 2 | 0.1 | - | 57 | 57 | 57 | 57 | 57 | 57 | 57 | 57 | 57 | 57 | 57 | 57 | 53 | 56 | 57 | 57 | 57 | 57 |
| BAKER-Rosettaserv | 3 | < | < | - | 57 | 57 | 57 | 57 | 57 | 57 | 57 | 57 | 57 | 57 | 57 | 53 | 56 | 57 | 57 | 57 | 57 |
| Seok-server | 4 | < | < | < | - | 57 | 57 | 57 | 57 | 57 | 57 | 57 | 57 | 57 | 57 | 53 | 56 | 57 | 57 | 57 | 57 |
| IntFOLD4 | 5 | < | < | < | 0.5 | - | 57 | 57 | 57 | 57 | 57 | 57 | 57 | 57 | 57 | 53 | 56 | 57 | 57 | 57 | 57 |
| GOAL | 6 | < | < | 1.0 | < | < | - | 57 | 57 | 57 | 57 | 57 | 57 | 57 | 57 | 53 | 56 | 57 | 57 | 57 | 57 |
| MULTICOM-cluster | 7 | < | < | < | 0.1 | 0.2 | < | - | 57 | 57 | 57 | 57 | 57 | 57 | 57 | 53 | 56 | 57 | 57 | 57 | 57 |
| MULTICOM-constr | 8 | < | < | < | 0.1 | 0.3 | 0.0 | 0.7 | - | 57 | 57 | 57 | 57 | 57 | 57 | 53 | 56 | 57 | 57 | 57 | 57 |
| MULTICOM-novel | 9 | < | < | 0.3 | < | < | 0.2 | < | < | - | 57 | 57 | 57 | 57 | 57 | 53 | 56 | 57 | 57 | 57 | 57 |
| RaptorX | 10 | < | < | < | < | < | < | < | < | < | - | 57 | 57 | 57 | 57 | 53 | 56 | 57 | 57 | 57 | 57 |
| myprotein-me | 11 | < | < | < | < | < | < | < | < | < | 0.4 | - | 57 | 57 | 57 | 53 | 56 | 57 | 57 | 57 | 57 |
| HHGG | 12 | < | < | < | < | < | < | < | < | < | 0.4 | 0.3 | - | 57 | 57 | 53 | 56 | 57 | 57 | 57 | 57 |
| HHPred0 | 13 | < | < | < | < | < | < | < | < | < | < | 0.6 | < | - | 57 | 53 | 56 | 57 | 57 | 57 | 57 |
| HHPred1 | 14 | < | < | < | < | < | < | < | < | < | < | 0.8 | < | 0.1 | - | 53 | 56 | 57 | 57 | 57 | 57 |
| ACOMPMOD | 15 | < | < | < | < | < | < | < | < | < | < | < | < | < | < | - | 52 | 53 | 53 | 53 | 53 |
| YASARA | 16 | < | < | < | < | < | < | < | < | < | 0.2 | 0.1 | 0.2 | < | < | < | - | 56 | 56 | 56 | 56 |
| MULTICOM-refine | 17 | < | < | < | < | < | < | < | < | < | < | < | < | < | < | 0.3 | < | - | 57 | 57 | 57 |
| FALCON_TOPO | 18 | < | < | < | < | < | < | < | < | < | < | < | < | < | < | < | 1.0 | < | - | 57 | 57 |
| RBO_Aleph | 19 | < | < | < | < | < | < | < | < | < | < | < | < | < | < | 0.5 | < | 0.4 | < | - | 57 |
| FALCON_TOPOX | 20 | < | < | < | < | < | < | < | < | < | < | < | < | < | < | < | 0.9 | < | 0.7 | < | - |
Table 2.
Results of the head-to-head comparisons of the bottom 20 groups on commonly predicted targets: (A) all groups on ‘human’ targets and (B) server-only groups on all targets. The table shows the percentage of targets Pij where the combined z-score of the group listed in the row i was higher than z-score of the group listed in the column j. Values Pij and Pji may not sum up to 100% as ties are omitted. Shaded cells highlight pairs of groups for which difference between the percentages of wins and losses is comparable (less than 25%). Server groups are in italics.
| (A) | |||||||||||||||||||||
|---|---|---|---|---|---|---|---|---|---|---|---|---|---|---|---|---|---|---|---|---|---|
| 1 | 2 | 3 | 4 | 5 | 6 | 7 | 8 | 9 | 10 | 11 | 12 | 13 | 14 | 15 | 16 | 17 | 18 | 19 | 20 | ||
| McGuffin | 1 | - | 45 | 48 | 48 | 62 | 59 | 54 | 59 | 66 | 90 | 90 | 69 | 74 | 75 | 100 | 62 | 78 | 93 | 90 | 100 |
| VoroMQA-select | 2 | 55 | - | 55 | 62 | 69 | 79 | 57 | 62 | 69 | 93 | 97 | 66 | 78 | 82 | 93 | 72 | 81 | 97 | 90 | 97 |
| Zhang | 3 | 52 | 45 | - | 55 | 69 | 72 | 50 | 69 | 69 | 93 | 97 | 72 | 70 | 75 | 97 | 66 | 89 | 93 | 86 | 97 |
| ProQ2 | 4 | 52 | 38 | 45 | - | 69 | 62 | 57 | 66 | 55 | 83 | 83 | 59 | 70 | 68 | 93 | 72 | 70 | 93 | 90 | 93 |
| Wallner | 5 | 38 | 31 | 31 | 31 | - | 45 | 46 | 52 | 48 | 93 | 93 | 55 | 67 | 68 | 93 | 62 | 67 | 93 | 86 | 100 |
| MULTICOM | 6 | 41 | 21 | 28 | 38 | 55 | - | 50 | 45 | 41 | 83 | 83 | 45 | 67 | 68 | 93 | 55 | 63 | 93 | 83 | 100 |
| wfRos-ProQ-ModF6 | 7 | 43 | 43 | 50 | 43 | 54 | 50 | - | 57 | 61 | 75 | 82 | 71 | 62 | 68 | 82 | 64 | 69 | 82 | 82 | 86 |
| Seok-refine | 8 | 41 | 38 | 31 | 34 | 48 | 55 | 43 | - | 52 | 76 | 76 | 48 | 59 | 61 | 90 | 59 | 70 | 86 | 83 | 90 |
| Zhang-Server | 9 | 34 | 31 | 31 | 45 | 52 | 59 | 39 | 48 | - | 90 | 93 | 66 | 56 | 50 | 90 | 59 | 70 | 97 | 79 | 97 |
| LEEab | 10 | 10 | 7 | 7 | 17 | 7 | 17 | 25 | 24 | 10 | - | 55 | 21 | 15 | 36 | 83 | 45 | 48 | 86 | 55 | 97 |
| LEE | 11 | 10 | 3 | 3 | 17 | 7 | 17 | 18 | 24 | 7 | 45 | - | 10 | 15 | 36 | 76 | 34 | 52 | 83 | 52 | 90 |
| QUARK | 12 | 31 | 34 | 28 | 41 | 45 | 55 | 29 | 52 | 34 | 79 | 90 | - | 48 | 46 | 86 | 52 | 48 | 93 | 76 | 93 |
| wfAll-Cheng | 13 | 26 | 22 | 30 | 30 | 33 | 33 | 38 | 41 | 44 | 85 | 85 | 52 | - | 58 | 93 | 59 | 68 | 93 | 78 | 93 |
| raghavagps | 14 | 25 | 18 | 25 | 32 | 32 | 32 | 32 | 39 | 21 | 64 | 64 | 43 | 42 | - | 82 | 54 | 69 | 79 | 61 | 89 |
| BAKER | 15 | 0 | 7 | 3 | 7 | 7 | 7 | 18 | 10 | 10 | 17 | 24 | 14 | 7 | 18 | - | 31 | 33 | 41 | 14 | 62 |
| Jones-UCL | 16 | 38 | 28 | 34 | 28 | 38 | 45 | 36 | 41 | 41 | 55 | 66 | 48 | 41 | 46 | 69 | - | 59 | 76 | 66 | 90 |
| Chicken_George | 17 | 22 | 19 | 11 | 30 | 33 | 37 | 31 | 30 | 11 | 52 | 48 | 30 | 32 | 12 | 63 | 41 | - | 63 | 48 | 74 |
| MUFOLD | 18 | 7 | 3 | 7 | 7 | 7 | 7 | 18 | 14 | 3 | 14 | 17 | 7 | 7 | 21 | 59 | 24 | 37 | - | 24 | 79 |
| wfMESHI-Seok | 19 | 10 | 10 | 14 | 10 | 14 | 17 | 18 | 17 | 21 | 45 | 48 | 24 | 22 | 39 | 86 | 34 | 52 | 76 | - | 86 |
| Pcomb-domain | 20 | 0 | 3 | 3 | 7 | 0 | 0 | 14 | 10 | 3 | 3 | 10 | 7 | 7 | 11 | 38 | 10 | 26 | 21 | 14 | - |
| (B) | |||||||||||||||||||||
|---|---|---|---|---|---|---|---|---|---|---|---|---|---|---|---|---|---|---|---|---|---|
| 1 | 2 | 3 | 4 | 5 | 6 | 7 | 8 | 9 | 10 | 11 | 12 | 13 | 14 | 15 | 16 | 17 | 18 | 19 | 20 | ||
| Zhang-Server | 1 | - | 60 | 89 | 61 | 70 | 93 | 70 | 72 | 84 | 100 | 91 | 98 | 93 | 96 | 100 | 80 | 100 | 98 | 96 | 98 |
| QUARK | 2 | 40 | - | 88 | 56 | 67 | 84 | 68 | 72 | 86 | 95 | 93 | 96 | 95 | 93 | 100 | 79 | 100 | 100 | 98 | 98 |
| BAKER-Rosettaserv | 3 | 11 | 12 | - | 35 | 28 | 53 | 40 | 39 | 46 | 81 | 60 | 74 | 65 | 65 | 94 | 64 | 93 | 86 | 75 | 84 |
| Seok-server | 4 | 39 | 44 | 65 | - | 61 | 72 | 67 | 63 | 74 | 82 | 81 | 86 | 81 | 84 | 92 | 77 | 91 | 88 | 88 | 88 |
| IntFOLD4 | 5 | 30 | 33 | 72 | 39 | - | 72 | 56 | 56 | 72 | 93 | 82 | 96 | 95 | 91 | 96 | 75 | 96 | 96 | 86 | 95 |
| GOAL | 6 | 7 | 16 | 47 | 28 | 28 | - | 30 | 33 | 40 | 93 | 67 | 91 | 72 | 79 | 100 | 63 | 96 | 100 | 81 | 100 |
| MULTICOM-cluster | 7 | 30 | 32 | 60 | 33 | 44 | 70 | - | 49 | 74 | 86 | 81 | 86 | 81 | 82 | 100 | 75 | 100 | 91 | 86 | 91 |
| MULTICOM-constr | 8 | 28 | 28 | 61 | 37 | 44 | 67 | 51 | - | 77 | 88 | 79 | 88 | 79 | 81 | 98 | 77 | 96 | 93 | 88 | 93 |
| MULTICOM-novel | 9 | 16 | 14 | 54 | 26 | 28 | 60 | 26 | 23 | - | 86 | 70 | 86 | 72 | 74 | 94 | 70 | 96 | 93 | 86 | 95 |
| RaptorX | 10 | 0 | 5 | 19 | 18 | 7 | 7 | 14 | 12 | 14 | - | 42 | 53 | 37 | 35 | 96 | 54 | 95 | 72 | 74 | 72 |
| myprotein-me | 11 | 9 | 7 | 40 | 19 | 18 | 33 | 19 | 21 | 30 | 58 | - | 61 | 53 | 53 | 87 | 54 | 75 | 67 | 72 | 65 |
| HHGG | 12 | 2 | 4 | 26 | 14 | 4 | 9 | 14 | 12 | 14 | 47 | 39 | - | 26 | 23 | 94 | 52 | 89 | 68 | 74 | 75 |
| HHPred0 | 13 | 7 | 5 | 35 | 19 | 5 | 28 | 19 | 21 | 28 | 63 | 47 | 74 | - | 56 | 96 | 48 | 91 | 82 | 77 | 82 |
| HHPred1 | 14 | 4 | 7 | 35 | 16 | 9 | 21 | 18 | 19 | 26 | 65 | 47 | 77 | 44 | - | 96 | 48 | 91 | 77 | 77 | 81 |
| ACOMPMOD | 15 | 0 | 0 | 6 | 8 | 4 | 0 | 0 | 2 | 6 | 4 | 13 | 6 | 4 | 4 | - | 33 | 51 | 4 | 43 | 4 |
| YASARA | 16 | 20 | 21 | 36 | 23 | 25 | 38 | 25 | 23 | 30 | 46 | 46 | 48 | 52 | 52 | 67 | - | 68 | 46 | 61 | 48 |
| MULTICOM-refine | 17 | 0 | 0 | 7 | 9 | 4 | 4 | 0 | 4 | 4 | 5 | 25 | 11 | 9 | 9 | 49 | 32 | - | 18 | 44 | 12 |
| FALCON_TOPO | 18 | 2 | 0 | 14 | 12 | 4 | 0 | 9 | 7 | 7 | 28 | 33 | 32 | 18 | 23 | 96 | 54 | 82 | - | 70 | 51 |
| RBO_Aleph | 19 | 4 | 2 | 25 | 12 | 14 | 19 | 14 | 12 | 14 | 26 | 28 | 26 | 23 | 23 | 57 | 39 | 56 | 30 | - | 30 |
| FALCON_TOPOX | 20 | 2 | 2 | 16 | 12 | 5 | 0 | 9 | 7 | 5 | 28 | 35 | 25 | 18 | 19 | 96 | 52 | 88 | 46 | 70 | - |
New in this CASP was inclusion of the ASE measure, reflecting ability to estimate residue-level errors, in determining rankings. One factor in this was that some groups mistakenly provided estimated crystallographic temperature factors instead of the requested error values and this did have a significant effect on their results. To illustrate this, we selected four groups - Zhang, McGuffin, Lee and Baker – who demonstrate comparable GDT_TS performance, but different ASE performance. Figure 9 shows that all the selected groups have GDT_TS scores around 75 for the easiest targets and around 50 for the most difficult. At the same time, these groups differ significantly according to the ASE measure: average scores for the Zhang and McGuffin groups are above 80, while for the Baker and Lee groups are only around 35 and 55, respectively. If judged on the backbone accuracy only (GDT_HA scores), or on the CASP11 assessors’ formula that includes global and local accuracy scores and does not take into account the ASE score, two J. Lee’s groups (LEE and LEEab) lead the all-group rankings (see Figure S1 in the Supplementary); however, they drop to #10 and #11 in the cumulative ranking (see Figure 8) because of the low ASE scores1. Similarly, the Baker group is positioned 6th in the GDT_HA only ranking and 4th in the ranking according to the CASP11 assessors’ formula, but drops to #15 in the cumulative ranking. Conversely, the McGuffin group is ranked 8th in the GDT_HA only ranking and 7th in the CASP11-style ranking, but climbs to the top of the cumulative ranking due to the relatively higher ASE scores. Ranking of the groups that show similar performance across the different measures remains quite stable. For example, the Zhang and VoroMQA_select groups occupy positions #3 and #4 in the GDT_HA based ranking and #2 and #3 in the cumulative ranking, correspondingly. On a separate note, Figure 9 also shows that all four of these groups improved accuracy of their backbone modeling in CASP12, if compared to CASP11 (i.e., achieved higher GDT_TS scores).
Figure 9.

GDT_TS (black lines) and ASE (red lines) scores of four selected groups as a function of target difficulty. All four groups attain high average GDT_TS scores, but only two of them (Zhang and McGuffin) score well on ASE scores, while the remaining two score poorly. For all four groups, GDT_TS trend lines run higher for CASP12 (solid line) than for CASP11 (dashed line), indicating accuracy improvement.
Since the ASE measure was used for the first time in the assessment of template-based models, we wanted to check if selection of a different measure for quantifying differences between the predicted and observed error distances would have changed the cumulative rankings. As an alternative local accuracy measure, we selected the log-linear correlation between the predicted and observed distances between the corresponding residues in a model and the target. The results of the analysis showed that the correlation between the ranking of groups according to the CASP12 formula and the ranking where ASE score in the CASP12 formula was substituted by the log-linear correlation is very high (Spearman CC=0.9). This shows that selection of the specific local accuracy measure (e.g., ASE vs the correlation) introduces only minimal disturbance into the final rankings in general. Since sometimes the presence of apparently poor results in the datasets tends to overinflate correlation, we also checked the agreement between the rankings only for the better performing groups. The top portions of the ranking tables according to the two ranking schemes are very similar, with the same group being recognized as best (McGuffin) and only one group from the top 12 in the ranking that includes ASE score being not included in the top 12 list of the ranking that includes correlation instead of ASE.
4 | Discussion
The analysis of the template based modeling results in the 12th round of CASP demonstrated measurable progress in template-based modeling from CASP11 to CASP12. The improvement in model accuracy is shown by all four analyses carried out in this paper: the accuracy of backbone modeling, alignment accuracy, accuracy of models versus the single best template, and accuracy of the non-template region modeling. Progress is evident both at the community-wide scale (comparing best models submitted on targets of similar accuracy in CASP12 and CASP11) and at the individual group scale (comparing results of the same groups in CASP12 and CASP11). It is always hard to dissect which part of the CASP-to-CASP progress comes from methodological advances and which from the change in the databases and difference in target sets. The data show, though, that the difficulties of CASP12 and CASP11 TBM targets (including TBM/FM) are very similar if judged by the average sequence identity (17% in both CASPs) and coverage (72% and 76%, correspondingly) of the targets by the best templates, and therefore non-methodological effects likely had a small impact.
To obtain insight into the methodological advances of the best methods, we checked the CASP12 Methods Abstracts (http://predictioncenter.org/casp12/doc/CASP12_Abstracts.pdf) and also got in touch with the authors. While every group had their own recipe for success2, we can summarize that much of the CASP12 progress in TBM comes from 1) more effective strategies to combine multiple templates or build missing parts in the templates regions ab initio, 2) enhanced refinement methods and 3) better methods for estimating model accuracy (EMA). The first two points in the list are discussed in the examples provided above. Better EMA methods enabled picking more accurate models from decoy sets for all top-performing groups, and in some cases helped identifying low reliability regions as candidates for refolding or refinement (see Yang Zhang’s paper, this issue). While using contact information in free modeling was a story of success in the recent two CASPs28 (see the Free Modeling assessment paper, this issue), the CASP12 TBM data showed that there is no trend for better performance of template-based methods on targets with deeper alignments. This general conclusion is confirmed in Yang Zhang’s paper (this issue), which shows that results of the Zhang-server on TBM targets with or without using contacts are essentially the same.
Performance of individual groups in CASP12 was ranked based on five measures belonging to three conceptually distinct classes. The first class of measures captures accuracy of modeling of the protein backbone, and is represented by the GDT_HA score. The second class of measures reports on the all-atom accuracy of modeling at the local scale, and includes three scores – LDDT (distance-based), CAD (contact-based) and SphereGrinder (local structure based). The third class gives credit to methods capable of providing accurate estimates of distance errors in the submitted models, and is represented by the ASE score. Combining all these scores in the final ranking gave benefit to groups with well-rounded results. Among completely automated methods, two servers from the Zhang group, Zhang-server and QUARK, outperform the rest of the servers in a statistically significant manner. They also win all head-to-head comparisons on common sets of predicted targets. Among all predictors, McGuffin, VoroMQA-select, Zhang and ProQ2 groups, in that order, are the top performers. The head-to-head comparisons and statistical tests on a wider cluster of nine top performing groups (also including Wallner, MULTICOM, wfRos-ProQ-ModF6, Seok-refine and Zhang-Server groups) could not establish statistically significant difference in their results (with small exception).
Inclusion of the ASE accuracy estimate measure in this evaluation was somewhat controversial and down-ranked some groups (e.g., Lee and Baker) that were good performers according to the previous CASP ranking schemes. We strongly encourage the prediction community to take advantage of the FORCASP forum (http://predictioncenter.org/forcasp/) to discuss approaches for evaluation of the TBM category before the next experiment starts, and so ensure that the community’s views are fully considered.
Supplementary Material
Figure S1. Performance of CASP12 groups in the template-based modeling on a set of TBM + TBM/FM targets according to (A) GDT_HA score and (B) CASP11 assessors’ formula (GDT_HA + GDC_ALL + lDDT + SG + 0.2*Molprb-Score). The data are provided for the top 50 methods only. Groups are ranked based on the sum of per-target Z-scores calculated from the distribution of corresponding scores for the first models; negative Z-scores are set to 0 before the summation. Bars are colored according to the average ASE score. Groups in the blue and green color spectrum were favored in the CASP12 rankings for correct estimates of per-residue errors, while groups in the red color spectrum were disadvantaged.
Acknowledgments
This paper is dedicated to the memory of our late friend and colleague Anna Tramontano, who was deeply involved in this TBM assessment.
This work was partially supported by the US National Institute of General Medical Sciences (NIGMS/NIH) – grant R01GM100482 to KF.
Footnotes
It was brought to our attention that the LEE and LEEab groups provided estimates of the crystallographic temperature factors in place of the required distance error estimates.
The detailed account of the better performing TBM methods can be found elsewhere in this issue.
References
- 1.Berman H, Henrick K, Nakamura H, Markley JL. The worldwide Protein Data Bank (wwPDB): ensuring a single, uniform archive of PDB data. Nucleic Acids Res. 2007;35:D301–303. doi: 10.1093/nar/gkl971. Database issue. [DOI] [PMC free article] [PubMed] [Google Scholar]
- 2.Zemla A, Venclovas, Moult J, Fidelis K. Processing and evaluation of predictions in CASP4. Proteins. 2001;(Suppl 5):13–21. doi: 10.1002/prot.10052. [DOI] [PubMed] [Google Scholar]
- 3.Xu J, Zhang Y. How significant is a protein structure similarity with TM-score = 0.5? Bioinformatics. 2010;26(7):889–895. doi: 10.1093/bioinformatics/btq066. [DOI] [PMC free article] [PubMed] [Google Scholar]
- 4.Kinch LN, Shi S, Cheng H, Cong Q, Pei J, Mariani V, Schwede T, Grishin NV. CASP9 target classification. Proteins. 2011;79(Suppl 10):21–36. doi: 10.1002/prot.23190. [DOI] [PMC free article] [PubMed] [Google Scholar]
- 5.Kryshtafovych A, Monastyrskyy B, Fidelis K. CASP11 statistics and the prediction center evaluation system. Proteins. 2016;84(Suppl 1):15–19. doi: 10.1002/prot.25005. [DOI] [PMC free article] [PubMed] [Google Scholar]
- 6.Kryshtafovych A, Monastyrskyy B, Fidelis K. CASP prediction center infrastructure and evaluation measures in CASP10 and CASP ROLL. Proteins. 2014;82(Suppl 2):7–13. doi: 10.1002/prot.24399. [DOI] [PMC free article] [PubMed] [Google Scholar]
- 7.Kryshtafovych A, Krysko O, Daniluk P, Dmytriv Z, Fidelis K. Protein structure prediction center in CASP8. Proteins. 2009;77(Suppl 9):5–9. doi: 10.1002/prot.22517. [DOI] [PMC free article] [PubMed] [Google Scholar]
- 8.Kryshtafovych A, Prlic A, Dmytriv Z, Daniluk P, Milostan M, Eyrich V, Hubbard T, Fidelis K. New tools and expanded data analysis capabilities at the Protein Structure Prediction Center. Proteins. 2007;69(Suppl 8):19–26. doi: 10.1002/prot.21653. [DOI] [PMC free article] [PubMed] [Google Scholar]
- 9.Kryshtafovych A, Milostan M, Szajkowski L, Daniluk P, Fidelis K. CASP6 data processing and automatic evaluation at the protein structure prediction center. Proteins. 2005;61(Suppl 7):19–23. doi: 10.1002/prot.20718. [DOI] [PubMed] [Google Scholar]
- 10.Tress M, Ezkurdia I, Grana O, Lopez G, Valencia A. Assessment of predictions submitted for the CASP6 comparative modeling category. Proteins. 2005;61(Suppl 7):27–45. doi: 10.1002/prot.20720. [DOI] [PubMed] [Google Scholar]
- 11.Kopp J, Bordoli L, Battey JN, Kiefer F, Schwede T. Assessment of CASP7 predictions for template-based modeling targets. Proteins. 2007;69(Suppl 8):38–56. doi: 10.1002/prot.21753. [DOI] [PubMed] [Google Scholar]
- 12.Mariani V, Biasini M, Barbato A, Schwede T. IDDT: a local superposition-free score for comparing protein structures and models using distance difference tests. Bioinformatics. 2013;29(21):2722–2728. doi: 10.1093/bioinformatics/btt473. [DOI] [PMC free article] [PubMed] [Google Scholar]
- 13.Olechnovic K, Kulberkyte E, Venclovas C. CAD-score: a new contact area difference-based function for evaluation of protein structural models. Proteins. 2013;81(1):149–162. doi: 10.1002/prot.24172. [DOI] [PubMed] [Google Scholar]
- 14.Kryshtafovych A, Barbato A, Monastyrskyy B, Fidelis K, Schwede T, Tramontano A. Methods of model accuracy estimation can help selecting the best models from decoy sets: Assessment of model accuracy estimations in CASP11. Proteins. 2016;84(Suppl 1):349–369. doi: 10.1002/prot.24919. [DOI] [PMC free article] [PubMed] [Google Scholar]
- 15.Huang YJ, Mao B, Aramini JM, Montelione GT. Assessment of template-based protein structure predictions in CASP10. Proteins. 2014;82(Suppl 2):43–56. doi: 10.1002/prot.24488. [DOI] [PMC free article] [PubMed] [Google Scholar]
- 16.Modi V, Xu Q, Adhikari S, Dunbrack RL., Jr Assessment of template-based modeling of protein structure in CASP11. Proteins. 2016;84(Suppl 1):200–220. doi: 10.1002/prot.25049. [DOI] [PMC free article] [PubMed] [Google Scholar]
- 17.Zemla A. LGA: A method for finding 3D similarities in protein structures. Nucleic Acids Res. 2003;31(13):3370–3374. doi: 10.1093/nar/gkg571. [DOI] [PMC free article] [PubMed] [Google Scholar]
- 18.Tramontano A, Morea V. Assessment of homology-based predictions in CASP5. Proteins. 2003;53(Suppl 6):352–368. doi: 10.1002/prot.10543. [DOI] [PubMed] [Google Scholar]
- 19.Cozzetto D, Kryshtafovych A, Fidelis K, Moult J, Rost B, Tramontano A. Evaluation of template-based models in CASP8 with standard measures. Proteins. 2009;77(Suppl 9):18–28. doi: 10.1002/prot.22561. [DOI] [PMC free article] [PubMed] [Google Scholar]
- 20.Mariani V, Kiefer F, Schmidt T, Haas J, Schwede T. Assessment of template based protein structure predictions in CASP9. Proteins. 2011;79(Suppl 10):37–58. doi: 10.1002/prot.23177. [DOI] [PubMed] [Google Scholar]
- 21.Keedy DA, Williams CJ, Headd JJ, Arendall WB, 3rd, Chen VB, Kapral GJ, Gillespie RA, Block JN, Zemla A, Richardson DC, Richardson JS. The other 90% of the protein: assessment beyond the Calphas for CASP8 template-based and high-accuracy models. Proteins. 2009;77(Suppl 9):29–49. doi: 10.1002/prot.22551. [DOI] [PMC free article] [PubMed] [Google Scholar]
- 22.Moult J, Fidelis K, Kryshtafovych A, Schwede T, Tramontano A. Critical assessment of methods of protein structure prediction: Progress and new directions in round XI. Proteins. 2016;84(Suppl 1):4–14. doi: 10.1002/prot.25064. [DOI] [PMC free article] [PubMed] [Google Scholar]
- 23.Kryshtafovych A, Fidelis K, Moult J. CASP10 results compared to those of previous CASP experiments. Proteins. 2014;82(Suppl 2):164–174. doi: 10.1002/prot.24448. [DOI] [PMC free article] [PubMed] [Google Scholar]
- 24.Kryshtafovych A, Fidelis K, Moult J. CASP9 results compared to those of previous casp experiments. Proteins. 2011;79(Suppl 10):196–207. doi: 10.1002/prot.23182. [DOI] [PMC free article] [PubMed] [Google Scholar]
- 25.Kryshtafovych A, Venclovas C, Fidelis K, Moult J. Progress over the first decade of CASP experiments. Proteins. 2005;61(Suppl 7):225–236. doi: 10.1002/prot.20740. [DOI] [PubMed] [Google Scholar]
- 26.Johnson PM, Gucinski GC, Garza-Sanchez F, Wong T, Hung LW, Hayes CS, Goulding CW. Functional Diversity of Cytotoxic tRNase/Immunity Protein Complexes from Burkholderia pseudomallei. J Biol Chem. 2016;291(37):19387–19400. doi: 10.1074/jbc.M116.736074. [DOI] [PMC free article] [PubMed] [Google Scholar]
- 27.Roy A, Kucukural A, Zhang Y. I-TASSER: a unified platform for automated protein structure and function prediction. Nat Protoc. 2010;5(4):725–738. doi: 10.1038/nprot.2010.5. [DOI] [PMC free article] [PubMed] [Google Scholar]
- 28.Kinch LN, Li W, Monastyrskyy B, Kryshtafovych A, Grishin NV. Evaluation of free modeling targets in CASP11 and ROLL. Proteins. 2016;84(Suppl 1):51–66. doi: 10.1002/prot.24973. [DOI] [PMC free article] [PubMed] [Google Scholar]
Associated Data
This section collects any data citations, data availability statements, or supplementary materials included in this article.
Supplementary Materials
Figure S1. Performance of CASP12 groups in the template-based modeling on a set of TBM + TBM/FM targets according to (A) GDT_HA score and (B) CASP11 assessors’ formula (GDT_HA + GDC_ALL + lDDT + SG + 0.2*Molprb-Score). The data are provided for the top 50 methods only. Groups are ranked based on the sum of per-target Z-scores calculated from the distribution of corresponding scores for the first models; negative Z-scores are set to 0 before the summation. Bars are colored according to the average ASE score. Groups in the blue and green color spectrum were favored in the CASP12 rankings for correct estimates of per-residue errors, while groups in the red color spectrum were disadvantaged.