Abstract
Stent thrombosis is a major complication of coronary stent and scaffold intervention. While often unanticipated and lethal, its incidence is low making mechanistic examination difficult through clinical investigation alone. Thus, throughout the technological advancement of these devices, experimental models have been indispensable in furthering our understanding of device safety and efficacy. As we refine model systems to gain deeper insight into adverse events, it is equally important that we continue to refine our measurement methods. We used digital signal processing in an established flow loop model to investigate local flow effects due to geometric stent features and ultimately its relationship to thrombus formation. A new metric of clot distribution on each microCT slice termed normalized clot ratio was defined to quantify this distribution. Three under expanded coronary bare-metal stents were run in a flow loop model to induce clotting. Samples were then scanned in a MicroCT machine and digital signal processing methods applied to analyze geometric stent conformation and spatial clot formation. Results indicated that geometric stent features play a significant role in clotting patterns, specifically at a frequency of 0.6225 Hz corresponding to a geometric distance of 1.606 mm. The magnitude-squared coherence between geometric features and clot distribution was greater than 0.4 in all samples. In stents with poor wall apposition, ranging from 0.27 mm to 0.64 mm maximum malapposition (model of real-world heterogeneity), clots were found to have formed in between stent struts rather than directly adjacent to struts. This early work shows how the combination of tools in the areas of image processing and signal analysis can advance the resolution at which we are able to define thrombotic mechanisms in in vitro models, and ultimately, gain further insight into clinical performance.
Keywords: Stent, Thrombosis, MicroCT, Malaposition, Image analysis
Introduction
Each year over 500,000 coronary stents are implanted in the US as a treatment for the most common type of heart disease, coronary artery disease (Go et al., 2014). A significant shortcoming of stent implantation is stent thrombosis (ST), the formation of a thrombotic material, which can ultimately lead to post-intervention vessel occlusion. In the acute scenario, ST has been shown to occur in up to 1.4% of stent implantations (Aoki et al., 2009) and even as high as 5% in certain patient subpopulations such as ST-segment elevation myocardial infarction (Heestermans et al., 2010). Furthermore, ST has continued as an issue throughout the historical development of stents even in the newest class of biorebsorbable stents. These challenges are not only limited to stents but also extend into the newest class of stent-based heart valves used in transcatheter aortic valve replacements. (Capodanno et al., 2015; Makkar et al., 2015; Wykrzykowska et al., 2017) Historically benchtop flow systems (Kolandaivelu & Edelman, 2002) have been used to examine the formation of clot under hemodynamic conditions similar to those found in the coronary arteries. Such benchtop settings offer enhanced ability to investigate a wide range of variables such as device design, deployment, and environmental conditions that have the propensity to lead to acute stent thrombosis. Stent-vessel interaction of complex systems (Garasic et al., 2000; Gundert, Marsden, Yang, & LaDisa, 2012; Hara, Nakamura, Palmaz, & Schwartz, 2006; Rogers & Edelman, 1995) such as these further complicates study. Often, numeric quantification of thrombosis within these benchtop setups are limited by global assays that represent integrated phenomenon (i.e. biochemical) rather than the local processes that define how clotting originates and progresses (Gunning, Saikrishnan, McNamara, & Yoganathan, 2014; Sinn, Scheuermann, Deichelbohrer, Ziemer, & Wendel, 2011). To increase the specificity and resolution of benchtop models a poor stent-wall apposition model was used as a model system. While further factors, such as plaques and resulting vessel narrowing, can be considered, the controlled stent-wall apposition model was utilized as a way to increase heterogeneity among samples and better test the sensitivity of a new method of quantitative spatial clot quantification. Using this model as a platform, we propose a method of spatial quantification of clot in in vitro flow loops through image-analysis and signal processing. We report our early findings from this study on a sub-sample of three stents.
Methods
Experimental Set-up
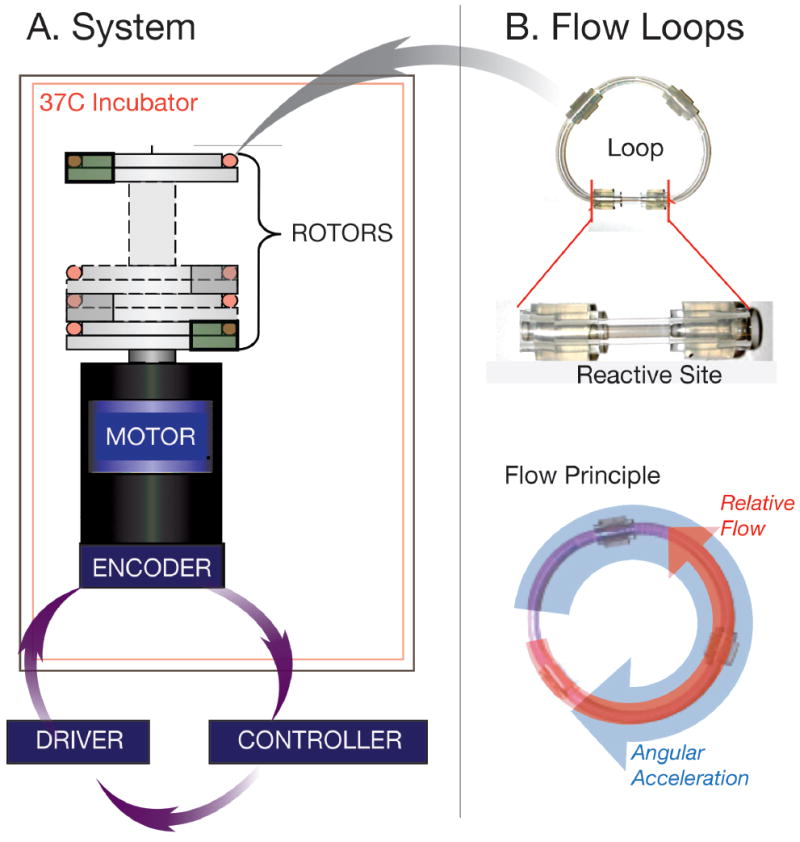
We constructed in vitro flow loops mounted in parallel (Figure 2), using an established flow loop model(Kolandaivelu et al., 2011). Three closed-cell, commercially available coronary bare metal stents (BMS; 3.0 × 18 mm) were used. An under-expansion model of the stents was induced via the fitting of Polyethylene tubing around the middle portion of angioplasty balloon catheter prior to mounting of the stent onto the balloon. Each stent was crimped (Machine Solutions, Inc., AZ) onto a modified balloon catheter delivery system setup previously employed (O’Brien et al., 2016) and deployed into silicone tubing. This setup created ranges of malapposition that reflect clinically reported ranges (Gutiérrez-Chico et al., 2012). A modified balloon catheter system was used to create artificial lack of stent wall-apposition or malapposition of the stent in a “dog-bone” shape (Figure 1B). Flow loop/stent and blood draw sample preparation is described in detail in Appendix A. Loops were then filled with ~2.5 ml of blood collected from healthy human subjects under established IRB protocols, rotor mounted and run for 5 minutes at 37 C to allow adequate time for formation of thrombosis. After each run was completed, samples were washed with a tyrode solution and infused with a 4% paraformaldehyde solution at a 4:1 ratio with ISOVUE- 370 (Bracco Diagnostics, Milano, Italy) contrast solution for fixation and imaging. This ratio was found to allow for greater differentiation of wall boundaries while still maintaining simultaneous differentiation of both stent and clot.
Figure 2.

Schematic Diagram of flow loop setup. Each of the flow loops are mounted to the rotor section atop of the motor and encoder system (A). These are driven when the computer controller and driver that has the specific rotational pattern used to create flow within the loop (B) The loops themselves are made up of reactive site (B) that contains the deployed malapposed stent.
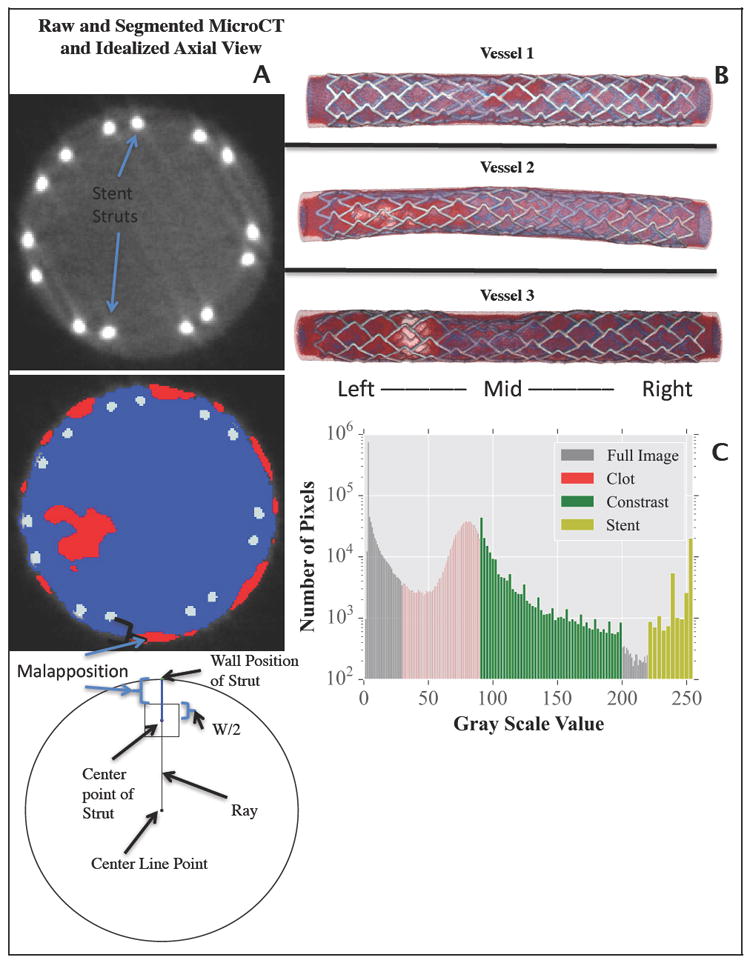
Figure 1.

MicroCT slice of malapposed stent and corresponding slice segmentation with red, blue, and silver representing clot, contrast and stent struts. A schematic diagram is shown displaying how malapposition of each stent struts was computed (A), a 3D reconstruction of each sample is shown (B). Calibration scan histogram (C) used to determine ranges of Hounsfield units used for segmentation of MicroCT slices into the masks of clot, contrast, and stent.
Ex vivo Visualization using MicroCT Scans
Upon fixation, each sample was scanned using a micro-computed tomography machine (eXplore CT 120 MicroCT; GE Healthcare, Milwaukee, Wisconsin, USA) with a slice thickness of 25 m (energy 120 kV, integration time 16 ms, 1×1 binning). MicroCT data in the form of DICOM (Digital Imaging and Communications in Medicine) files were downloaded and saved for offline segmentation and geometric reconstruction.
Prior to image segmentation, microCT calibration scans were conducted. Two scans were performed, one of a fully expanded stent in a silicon tube and one of thrombosed blood. These were performed to determine Hounsfield unit (HU) ranges to be used for later segmentation. After each scan, pixel intensity histograms (Figure 1C) were plotted and pixel intensity ranges for each were recorded. These ranges were used later in the ScanIP software package (Simpleware, Exeter, UK) to generate graphical representations (Figure 1B) and segmented structures of stent, clot, and contrast. Additional smoothing was performed on each of the masks to obtain continuous structures.
Image Analysis
Clot was quantified on a per microCT slice basis. On each microCT slice, the number of pixels defined as clot were divided by the total number of pixels encompassing the fluid domain on that slice, this value was then normalized on a scale from 0-1 for each vessel and termed the “normalized clot ratio”. This operation was performed on all slices for all samples. A normalized clot ratio of 1 indicated that a slice that was comprised completely of clot while a normalized clot ratio of 0 meant that no clot was measured on that slice.
Stent Under Expansion Quantification
Quantification of stent-wall malapposition was computed as the distance from the outer stent strut surface to the luminal wall (Figure 1A) and measured automatically on microCT images via a custom script (MATLAB; Mathworks, Natick, MA, USA). As several stent struts are present on each microCT slice several measurements of malapposition were recorded and the median value of that slice was taken. The use of a single malapposition value associated with each slice was necessary to facilitate co-registration between slice level quantification of thrombosis and slice-associated levels of stent malapposition.
Spatial Clot Quantification
Metrics of clot and stent-wall malapposition as a function of stent length were taken as 1-D signals and analyzed using frequency domain analysis (Cooley & Tukey, 1965) and magnitude squared coherence (Welch, 1967). Magnitude-squared coherence was specifically used as our statistical test to determine relationship between the clot and stent signals at each corresponding frequency.
Results
Image Analysis
Regional Correlation of Stent and Clot Location
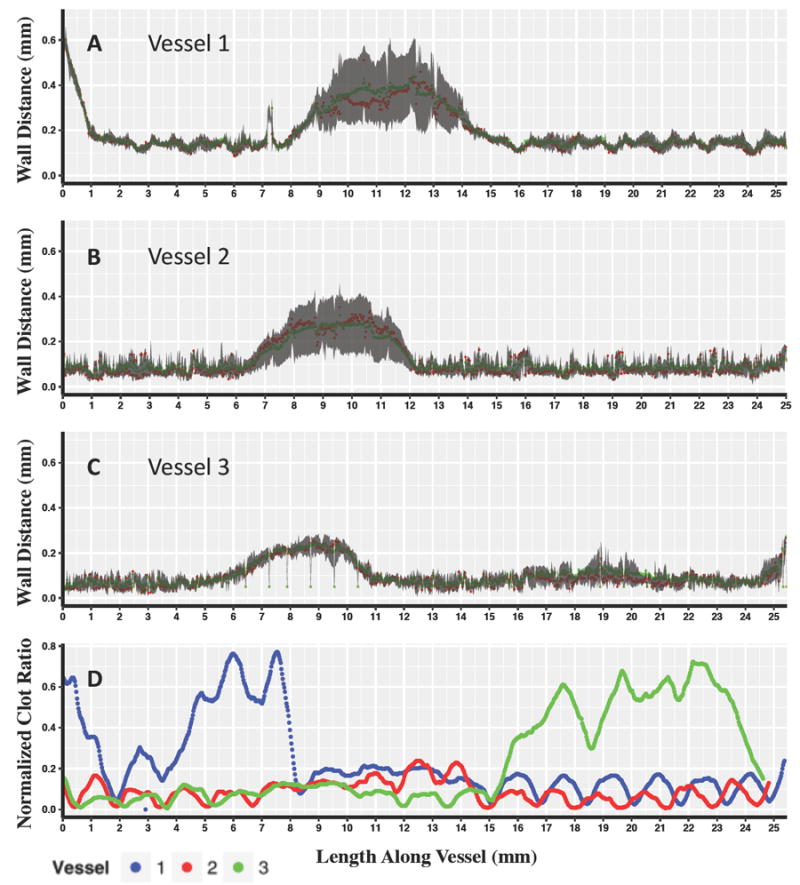
We examined correlations in stent-clot pattern at the regional scale of the entire stent, as well as the local scale of individual stent struts and cells (Figure 4). Patterns of stent-wall malapposition followed balloon deployment on the dog-bone shape modified balloon as expected. As the flow loop system itself uses bidirectional flow, ‘right’ and ‘left’ nomenclature was used instead of ‘proximal’ and ‘distal.’ Malapposition was measured most significantly in the mid-section of all three samples (Figure 3A, B, C). Peak malapposition for each stent was sample 1: 0.640 mm; sample 2: 0.351 mm; sample 3: 0.270 mm. A peak was seen on the left for sample 1 as opposed to peak malapposition for samples 2 and 3 which occurred in the mid-section. The peak seen in the left section of sample 1 in contrast with vessels 2 and 3 where peak malapposition was confined in the mid-section was likely due to variations of hand mounting stents on the dilation balloons for these in vitro experiments.
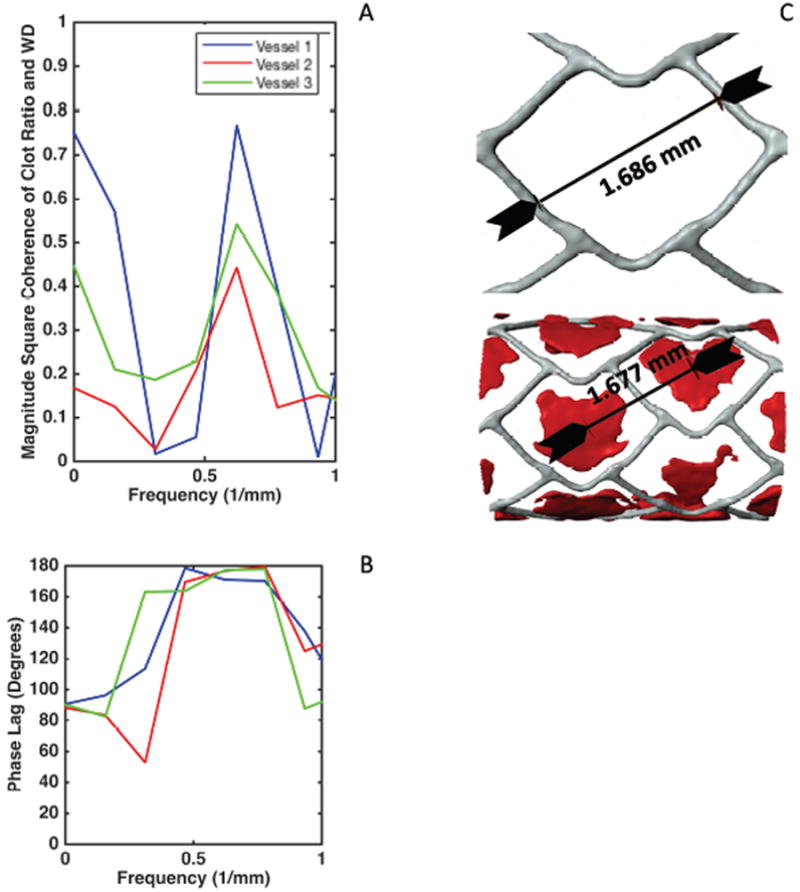
Figure 4.

Coherence estimate plot for malapposition and clot signals displaying frequency of interest at 0.6225 Hz (A) Phase lag plots (B) indicating the frequencies of interest and the nearly 180 degrees phase lag between malapposition and clot signal. This phase lag suggests as seen in (C) the fact that no clot is present on the struts but rather dispersed in between the struts.
Figure 3.

The top three panels display Wall Distance vs. Length Along the Vessel for Vessel 1 (A) Vessel 2 (B) and Vessel 3 (C) with red points indicating the median value for each microCT slice, and green points indicating the mean. The gray shaded region displays the 25%-75% interquartile range for each slice along the length of the vessel. The bottom panel displays Normalized clot ratio vs. length along the vessel (C) calculated as the number of pixel defined as clot over the total number of lumen defined pixels for each vessel.
Stent volume as calculated from image segmentation across all samples displayed good agreement. (sample 1: 3.85 mm3; sample 2: 4.05 mm3; sample 3: 3.78 mm3; Mean±SD: 3.89 ± 0.14).
The longitudinal spatial distribution of clot measured on each micro-CT slice along the stent length (Figure 3D), was different between samples and did not clearly follow device position in the low sample size considered.
Local Correlation of Strut and Clot Location
One dimensional signals generated from strut wall position and clot along the longitudinal spatial axis in each vessel generated signals that were similar in all three vessels with respect to wall strut position. Similarities in clot position were also seen visually but more so in samples 1 and 3, where smaller, lower amplitude fluctuations were observed throughout. Large peaks of strut wall positions were seen in the midsections, while additionally higher spatial frequency components (Figure 4A) seen as smaller fluctuations were then correlated with stent cell design and inter-strut spacing (Figure 4C). Signals were most correlated at a spatial frequency of 0.6225 1/mm (Figure 4A), corresponding to a geometric distance of 1.606 mm. This distance coincides with the approximate distance between the stent strut cells and the differences between the center of the clot formations between stent strut cells (Figure 4C). At this harmonic, the signal of clot lagged behind that of spatially distributed strut-wall signal by approximately 180 ± 3 degrees, indicating that at the point where malapposition was measured there was minimal clot. (Figure 4B), and that clotting was observed in between struts, rather than with direct strut association. This visually confirmed the value of our 3D visual reconstruction methods and algorithms for refining and automating the spatial assessment of these benchtop approaches (Figure 4C).
Discussion
MicroCT imaging and signal analysis can be invaluable methods for bench top quantification of thrombosis. Using our model system for validation of this method, signal, and imaging analysis showed that in areas with clot formation, clot was located in between struts and not on top of struts. These early results from three stents demonstrate that ex vivo blood flow loops coupled with microCT imaging and signal analysis can be used to resolve relationships between stent positioning and blood reactivity at the level of the stent strut (~10 microns). This distribution of clot and strut-wall apposition, with results to be expected based on studies from computational modeling, both in vivo (O ’Brien et al., 2016) (Kolandaivelu et al., 2011) and clinically (Foin et al., 2014). However, this is the first time this has been observed experimentally ex vivo due to the added spatial resolution 3D microCT offers.
Ex vivo models have by in large looked at bulk amounts of clot or biochemical markers as a quantitative surrogate for clot formation with spatial assessment largely made through qualitative visual techniques (Kolandaivelu et al., 2011). MicroCT imaging and image analysis provide unparalleled resolution enabling investigation of clot formation patterns on both a local and regional level. Furthermore, microCT imaging can also enable high-resolution 3D geometric reconstructions that can be used as a basis for flow simulations (O’Brien et al., 2016; Rikhtegar et al., 2013). The presented method provides new ability to investigate and bring together the local - around the strut - and regional organization of the device, flow, and biology in the in vitro setting.
Limitations
While the small sample size of this study is a limitation, the overall goal was to assess a method of quantification in a model system. Further, the model system employed uses material such as silicon tubing that cannot fully recreate vessel properties as seen in vivo. Yet even with this low sample size, were we able to detect significant differences both inter and intra-stent. A larger sample size, more controlled range of stent-wall apposition, and varied stent patterns are needed for a more exhaustive study.
Conclusions
In this early development work, we can see that thrombosis formation displays organized relationships at the level of formation around the stent struts and at the local level of the strut-wall interaction. These early results support past work conducted showing stratifications by malapposition and its relationship to clot formation (Kolandaivelu et al., 2011). Most importantly this method with its ability to bring together image and signal analysis techniques has the potential ability to investigate both global and local features of thrombus quantification in the presence of, controlled lack of stent-wall apposition as in the case presented. This method can allow for a more detailed investigation into the interaction between stent design and deployment on clot formation in the benchtop setting. Further, this method provides the potential for a higher degree of 3D spatial quantification of clot and can drive future stent designs.
Supplementary Material
Acknowledgments
Work was supported by a grant from the NIH (R01 GM-49039) to ERE. KK is supported in part by an AHA FTF Award (12FTF12080241). ACL is supported in part by an Arie Research Fellowship from the Brazilian Society of Interventional Cardiology.
Appendix A: Flow Loop Sample Preparation
Flow Loop Preparation Protocol
Stents were deployed in looped segments or “flow loops” in the silicone tubing (3.18-mm inner diameter/4.76-mm outer diameter; Shore 50A Durometer, 3350 Tygon). Loops were made reactive through coating an 8-hour incubation with 28.3% bovine type I collagen solution (Beckton Dickinson) which was followed by rinsing in PBS, pH7.4. Blood was collected and 10% acid-citrate-dextrose solution (85 mmol/L trisodium citrate, 69 mmol/L citric acid, 111 mmol/L glucose; pH 4.6) was added. Prior to use, blood was repleted with a 100 mmol/L CaCl2/75 mmol/L MgCl2 solution with 62.5 μL calcium/magnesium solution per 1 mL blood.
Subject Blood Draw Exclusion Criteria
I am less than 18 years of age or greater than 65 years of age
I suffer from an acute or chronic infection
I suffer from a known clotting condition
I suffer from diabetes
I suffer from renal disease
I suffer from liver disease
I have had a heart attack or stroke
I suffer from an autoimmune disease
I suffer from active malignant disease
I suffer from severe hypotension (low blood pressure)
I suffer from bleeding tendency or diathesis
I am pregnant
I use medication on a chronic basis
I use medications within the last 48 hours
I have given blood within the past 7 days
I am less than or equal to 110 lbs
I have a known diagnosis of anemia (hematocrit or red blood cell count < 38)
Footnotes
Conflicts of Interest
All authors report no conflict of interest
Publisher's Disclaimer: This is a PDF file of an unedited manuscript that has been accepted for publication. As a service to our customers we are providing this early version of the manuscript. The manuscript will undergo copyediting, typesetting, and review of the resulting proof before it is published in its final citable form. Please note that during the production process errors may be discovered which could affect the content, and all legal disclaimers that apply to the journal pertain.
References
- Aoki J, Lansky AJ, Mehran R, Moses J, Bertrand ME, McLaurin BT, Stone GW, et al. Early stent thrombosis in patients with acute coronary syndromes treated with drug-eluting and bare metal stents: The acute catheterization and urgent intervention triage strategy trial. Circulation. 2009;119(5):687–698. doi: 10.1161/CIRCULATIONAHA.108.804203. https://doi.org/10.1161/CIRCULATIONAHA.108.804203. [DOI] [PubMed] [Google Scholar]
- Capodanno D, Gori T, Nef H, Latib A, Mehilli J, Lesiak M, Tamburino C, et al. Percutaneous coronary intervention with everolimus-eluting bioresorbable vascular scaffolds in routine clinical practice: early and midterm outcomes from the European multicentre GHOST-EU registry. EuroIntervention. 2015;10(11):1144–1153. doi: 10.4244/EIJY14M07_11. https://doi.org/10.4244/EIJY14M07_11. [DOI] [PubMed] [Google Scholar]
- Cooley JW, Tukey JW. An Algorithm for the Machine Computation of the Complex Fourier Series. Mathematics of Computation. 1965;19:297. [Google Scholar]
- Foin N, Gutiérrez-Chico Juan Luis, Nakatani S, Torii R, Bourantas CV, Sen S, Serruys PW. Incomplete stent apposition causes high shear flow disturbances and delay in neointimal coverage as a function of strut to wall detachment distance implications for the management of incomplete stent apposition. Circulation: Cardiovascular Interventions. 2014;7(2):180–189. doi: 10.1161/CIRCINTERVENTIONS.113.000931. https://doi.org/10.1161/CIRCINTERVENTIONS.113.000931. [DOI] [PubMed] [Google Scholar]
- Garasic JM, Edelman ER, Squire JC, Seifert P, Williams MS, Rogers C. Stent and Artery Geometry Determine Intimal Thickening Independent of Arterial Injury. Circulation. 2000;101(7):812–818. doi: 10.1161/01.cir.101.7.812. https://doi.org/10.1161/01.CIR.101.7.812. [DOI] [PubMed] [Google Scholar]
- Go AS, Mozaffarian D, Roger VL, Benjamin EJ, Berry JD, Blaha MJ, Turner MB, et al. Heart disease and stroke statistics--2014 update: a report from the American Heart Association. Circulation. 2014;129 doi: 10.1161/01.cir.0000441139.02102.80. https://doi.org/10.1161/01.cir.0000441139.02102.80. [DOI] [PMC free article] [PubMed] [Google Scholar]
- Gundert TJ, Marsden AL, Yang W, LaDisa JF. Optimization of Cardiovascular Stent Design Using Computational Fluid Dynamics. Journal of Biomechanical Engineering. 2012;134(1):11002. doi: 10.1115/1.4005542. https://doi.org/10.1115/1.4005542. [DOI] [PubMed] [Google Scholar]
- Gunning PS, Saikrishnan N, McNamara LM, Yoganathan AP. An in vitro evaluation of the impact of eccentric deployment on transcatheter aortic valve hemodynamics. Annals of Biomedical Engineering. 2014;42(6):1195–206. doi: 10.1007/s10439-014-1008-6. https://doi.org/10.1007/s10439-014-1008-6. [DOI] [PubMed] [Google Scholar]
- Gutiérrez-Chico JL, Wykrzykowska J, Nüesch E, Van Geuns RJ, Koch KT, Koolen JJ, Serruys PW, et al. Vascular tissue reaction to acute malapposition in human coronary arteries sequential assessment with optical coherence tomography. Circulation: Cardiovascular Interventions. 2012;5(1):20–29. doi: 10.1161/CIRCINTERVENTIONS.111.965301. https://doi.org/10.1161/CIRCINTERVENTIONS.111.965301. [DOI] [PubMed] [Google Scholar]
- Hara H, Nakamura M, Palmaz JC, Schwartz RS. Role of stent design and coatings on restenosis and thrombosis. Advanced Drug Delivery Reviews. 2006 doi: 10.1016/j.addr.2006.01.022. https://doi.org/10.1016/j.addr.2006.01.022. [DOI] [PubMed]
- Heestermans AACM, van Werkum JW, Zwart B, van der Heyden Ja, Kelder JC, Breet NJ, ten Berg JM, et al. Acute and subacute stent thrombosis after primary percutaneous coronary intervention for ST-segment elevation myocardial infarction: incidence, predictors and clinical outcome. Journal of Thrombosis and Haemostasis : JTH. 2010;8(11):2385–2393. doi: 10.1111/j.1538-7836.2010.04046.x. https://doi.org/10.1111/j.1538-7836.2010.04046.x. [DOI] [PubMed] [Google Scholar]
- Kolandaivelu K, Edelman ER. Low Background, Pulsatile, In Vitro Flow Circuit for Modeling Coronary Implant Thrombosis. Journal of Biomechanical Engineering. 2002;124(6):662. doi: 10.1115/1.1517062. https://doi.org/10.1115/1.1517062. [DOI] [PubMed] [Google Scholar]
- Kolandaivelu K, Swaminathan R, Gibson WJ, Kolachalama VB, Nguyen-Ehrenreich K-L, Giddings VL, Edelman ER, et al. Stent thrombogenicity early in high-risk interventional settings is driven by stent design and deployment and protected by polymer-drug coatings. Circulation. 2011;123(13):1400–9. doi: 10.1161/CIRCULATIONAHA.110.003210. https://doi.org/10.1161/CIRCULATIONAHA.110.003210. [DOI] [PMC free article] [PubMed] [Google Scholar]
- Makkar RR, Fontana G, Jilaihawi H, Chakravarty T, Kofoed KF, de Backer O, Søndergaard L, et al. Possible Subclinical Leaflet Thrombosis in Bioprosthetic Aortic Valves. New England Journal of Medicine. 2015 doi: 10.1056/NEJMoa1509233. 151005110046004. https://doi.org/10.1056/NEJMoa1509233. [DOI] [PubMed]
- O’Brien CC, Kolandaivelu K, Brown J, Lopes AC, Kunio M, Kolachalama VB, Edelman ER. Constraining OCT with knowledge of device design enables high accuracy hemodynamic assessment of endovascular implants. PLoS ONE. 2016;11(2) doi: 10.1371/journal.pone.0149178. https://doi.org/10.1371/journal.pone.0149178. [DOI] [PMC free article] [PubMed] [Google Scholar]
- O ’Brien CC, Lopes AC, Kolandaivelu K, Kunio M, Brown J, Kolachalama VB, Conway C. Vascular Response to Experimental Stent Malapposition and Under-Expansion. Annals of Biomedical Engineering. 2016 doi: 10.1007/s10439-015-1518-x. https://doi.org/10.1007/s10439-015-1518-x. [DOI] [PMC free article] [PubMed]
- Rikhtegar F, Pacheco F, Wyss C, Stok KS, Ge H, Choo RJ, Kurtcuoglu V, et al. Compound ex vivo and in silico method for hemodynamic analysis of stented arteries. PloS One. 2013;8(3):e58147. doi: 10.1371/journal.pone.0058147. https://doi.org/10.1371/journal.pone.0058147. [DOI] [PMC free article] [PubMed] [Google Scholar]
- Rogers C, Edelman ER. Endovascular Stent Design Dictates Experimental Restenosis and Thrombosis. Circulation. 1995;91(12):2995–3001. doi: 10.1161/01.cir.91.12.2995. https://doi.org/10.1161/01.CIR.91.12.2995. [DOI] [PubMed] [Google Scholar]
- Sinn S, Scheuermann T, Deichelbohrer S, Ziemer G, Wendel HP. A novel in vitro model for preclinical testing of the hemocompatibility of intravascular stents according to ISO 10993-4. Journal of Materials Science: Materials in Medicine. 2011;22(6):1521–1528. doi: 10.1007/s10856-011-4335-2. https://doi.org/10.1007/s10856-011-4335-2. [DOI] [PubMed] [Google Scholar]
- Welch P. The use of fast Fourier transform for the estimation of power spectra: A method based on time averaging over short, modified periodograms. IEEE Transactions on Audio and Electroacoustics. 1967;15(2) [Google Scholar]
- Wykrzykowska JJ, Kraak RP, Hofma SH, van der Schaaf RJ, Arkenbout EK, IJsselmuiden AJ, Henriques JPS. Bioresorbable Scaffolds versus Metallic Stents in Routine PCI. New England Journal of Medicine. 2017 doi: 10.1056/NEJMoa1614954. NEJMoa1614954. https://doi.org/10.1056/NEJMoa1614954. [DOI] [PubMed]
Associated Data
This section collects any data citations, data availability statements, or supplementary materials included in this article.


