

Abstract
Antimicrobials including parabens, triclosan, and triclocarban have endocrine disrupting properties. Among 501 male partners of couples planning to become pregnant, preconception urinary biomarkers of parabens, triclosan and triclocarban exposure were quantified in spot urine samples. Men also provided two fresh semen samples collected approximately one month to undergo 24-hour semen quality analysis. Linear mixed-effects models, adjusted for creatinine, race, age and body mass index, were utilized to assess the relationship between log transformed chemical concentrations rescaled by their standard deviations and semen parameters. Methyl, ethyl and butyl parabens, were associated with diminished sperm count and several sperm motility parameters. Hydroxylated paraben metabolites and triclosan were significantly positively associated with select semen quality parameters. Overall, our findings suggest that specific urinary parabens found in consumer goods (methyl, ethyl and butyl parabens) may adversely impact sperm quality parameters among reproductive-age male partners of couples trying for pregnancy.
Keywords: antimicrobials, parabens, triclocarban, triclosan, semen quality
Graphical Abstract
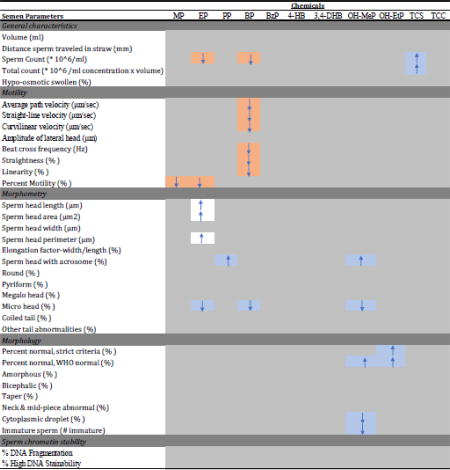
Significant associations between urinary chemical concentrations and semen parameters.
Significant associations (p<0.05) between parabens, triclosan, and triclocarban and semen quality parameters, with ↓ and ↑ indicating negative and positive effect estimates between 1 natural logtransformed, standardized the standard deviation unit increase for each chemical concentration and each semen parameter. Associations shaded in orange are generally thought to be associated with diminished semen quality, whereas associations shaded in blue are thought to suggestive enhanced semen quality. Nebulous interpretations (highlighted in white).
1. Introduction
Antimicrobial preservatives including parabens (esters of 4-hydroxybenzoic acid), triclosan (TCS), and triclocarban (TCC), are common additives in consumer goods [1–5] with reported endocrine disrupting properties [6–8]. Biomonitoring data corroborate widespread human exposure to these environmental chemicals with 58% – 99% of a demographically diverse group of adult males and females from the U.S. general population having detectable concentrations of parabens and TCS in urine [9].
Having weak estrogenic properties in comparison with estradiol, parabens possess an affinity for the estrogen receptor in a manner directly related with the size of the alkyl group; butyl paraben (BP) and propyl paraben (PP) having stronger estrogenic activity than ethyl paraben (EP) and methyl paraben (MP) [10]. Suggested reproductive toxicity of these antimicrobial chemicals has primarily been demonstrated in rodent models. In a study of male rats aged 19–21 days, with dietary exposure to BP for eight weeks at doses of 10–15, 100–150 or 1000–1500 mg per kg of body weight; the weights of the seminal vesicles with coagulation glands and the epididymal were significantly lower in the group with the highest exposure compared to the less exposed controls [11]. Additionally, the authors reported a dose-dependent decrease in sperm counts in the testis and the concentration of testosterone. In a similar rodent study, with dietary exposure to PP instead of BP, the authors observed a dose-dependent decrease in sperm concentration, sperm count in the cauda epididymal sperm reserves and reduced testosterone secretion [12].
The purported antiandrogenic activity of TCS has been previously observed in a study of male rats at postnatal days 23–53, with a 200 mg/kg oral dose of TCS resulting in decreased serum testosterone [13]. Likewise, male albino rats that were treated with varying doses of TCS (5–20 mg) for 60 days were shown to have decreased weights of the testes and sex accessory organs (epididymis, vas deferens) by 35–49% at the highest exposure dose and a reduced level of steroidogenic acute regulatory (StAR) protein in testicular Leydig cells [14]. Furthermore, a study of Leydig cells isolated from male Wistar albino rats treated with varying concentrations of TCS (0.001 – 10 µM) reported reduced production of testosterone in a dose-dependent manner [15].
As previously reviewed in the literature, TCC, the other antimicrobial commonly found in consumer goods, does not appear to bind to the androgen receptor; in vitro and in vivo exposures to TCC has been shown to induce an interaction between TCC and endogenous testosterone resulting in the amplification of testosterone effects on reproductive organs [10].
Epidemiological studies of parabens, TCS and TCC in the context of male reproductive endpoints are scarce and the few existing studies are not representative of the general population. In studies of male partners of subfertile couples seeking care in the U.S., urinary concentrations of BP were associated with sperm DNA damage [16]; urinary MP and PP were associated with decreased odds of live birth following intrauterine insemination [17]. Similarly, urinary BP and PP levels of male partners attending an infertility clinic in Lodz, Poland were positively associated with sperm chromosome disomy [18]. Similarly, among male volunteers from a reproductive health clinic in Shanghai, China, higher concentrations of TCS were associated with the percentage of sperm with normal morphology and the number of forward moving sperm [19].
To our knowledge, there are no studies assessing urinary levels of antimicrobials in relation to semen quality parameters among men recruited from the general population. In the present analysis, we investigated such a relationship among male partners in a prospective cohort study with preconception recruitment of couples trying for pregnancy.
2. Materials and Methods
2.1 Study population and cohort
The analytic cohort comprised male partners from the Longitudinal Investigation of Fertility and the Environment (LIFE) Study, a prospective cohort of 501 reproductive aged male-female couples from16 counties in Michigan and Texas between 2005 and 2009 who were recruited upon discontinuing contraception for purposes of becoming pregnant [20]. Inclusion criteria were: male partners aged ≥18 years; in a committed relationship; no physician-diagnosed infertility; ability to communicate in English or Spanish; and couple off contraception for ≤ 2 months. Institutional review board approvals were obtained from all collaborating institutions; couples gave written informed consent prior to study participation and any data collection.
2.2 Data and biospecimen collection
Upon enrollment, in-person interviews were conducted with male partners to ascertain lifestyle and reproductive history followed by standard anthropometric assessments to measure body mass index (BMI) [21]. During the enrollment home visit, male partners provided a baseline urine sample. Following a 2-day period of abstinence, male participants provided a baseline semen sample and a second sample approximately 1 month later. Specimens were obtained via masturbation without the use of lubricants using at-home collection kits [22]. To insure sample integrity, collection kits included a glass collection jar with an attached button thermometer to monitor temperature every half hour throughout the process (I-Button; Maxim Integrated, San Jose, CA). Also, men placed a pre-filled glass straw containing hyaluronic acid and plugged at one end (Vitrotubes 3520; VitroCom Inc., Mountain Lakes, NJ) into the specimen as a global marker of sperm motility and viability at the time of collection, and returned the sample in a prepaid overnight shipping container that included freezer pack (Hamilton Research, Beverly, MA). Semen delivered to a central andrology laboratory by overnight mail in insulated mailing kits have been successful in maintaining specimens for other studies [22–24]. Men recorded the time of ejaculation and any spillage on the labels, as directed. All analyses were performed at the andrology laboratory, National Institute for Occupational Safety and Health (Cincinnati, OH). Semen analysis after home collection has been reported to be reliable for all semen parameters with the exception of motility parameters [24, 25].
2.3 Toxicological analysis
Toxicologic analysis included urinary concentrations for 11 chemicals: methyl paraben (MP), ethyl paraben (EP), PP, BP, benzyl paraben (BzP), heptyl paraben (HP), 4-hydroxy benzoic acid (4-HB), 3,4-dihydroxy benzoic acid (3,4-DHB), methyl-protocatechuic acid (OH-MeP), ethylprotocatechuic acid (OH-EtP), TCS and TCC, all of which were performed at Wadsworth Center, New York State Department of Health [26]. Specifically, 300 µL of 1 M ammonium acetate containing 30 U of β-glucuronidase (pH=5.5) was added to 500 µL of urine sample, followed by incubation at 37 °C overnight. Target analytes were extracted three times with ethyl acetate and were quantified as nanograms/milliliter (ng/mL) by ultra-performance liquid chromatography (Acquity I Class; Waters, Milford, MA) coupled with an electrospray triple quadrupole tandem mass spectrometry (API 5500; AB SCIEX, Framingham, MA) (UPLC-ESI-MS/MS). Separation of target analytes was carried by a Kinetex C18 column (1.3 µm, 100A, 50 × 2.1 mm; Phenomenex, Torrance, CA) with a SecurityGuard® guard column (Phenomenex, Torrance, CA). Quality assurance and quality control parameters included procedural blanks, matrix spikes and duplicate analysis of samples. Labeled internal standards were spiked into all samples and quantification was by isotope dilution. Limit of quantification (LOQ) ranged from 0.05 to 5.00 ng/mL. Creatinine was quantified using a Roche/Hitachi Model 912 clinical analyzer (Dallas, TX) and the Creatinine Plus Assay.
2.4 Semen analysis
Following receipt of semen samples, a 24-hour analysis was performed after inspecting sample integrity such as within temperature range (I-Button Thermometer; Maxim Integrated, San Jose, CA) and general characteristics including turbidity, color, liquefaction, and volume. Samples were then warmed to 37°C and volume was measured to the nearest 0.1 mL.
Sperm concentration was assessed using the IVOS system and the IDENT™ stain (all from Hamilton Thorne Biosciences, Beverly, MA)[27]. A migration straw was used so the lab could microscopically assess the distance the vanguard sperm traveled to the nearest millimeter, which indicated sperm motility at the time of collection, in light of using next-day analysis [28]. Sperm viability was determined by hypo-osmotic swelling (HOS assay)[29, 30]. Sperm motility was assessed using the HTM-IVOS computer assisted semen analysis system (CASA) microscope slides were prepared for sperm morphometry. Morphology was assessed via slides prepared by Fertility Solutions® (Cleveland, OH) and was assessed using both traditional (World Health Organization 1992) and strict [31] classifications. Sperm morphometry was conducted using the IVOS METRIX system (Hamilton Thorne Biosciences, Beverly, MA). One aliquot of whole semen was diluted in TNE buffer and frozen for the sperm chromatin stability assay (SCSA) [32]. SCSA® analysis was conducted by SCSA Diagnostics (Brookings, SD) using a Coulter Epics Elite Flow Cytometer (Coulter, Miami, FL). The SCSA® assay measures sperm DNA damage, which is then quantified as the percentage of separated or damaged DNA (DNA fragmentation index; DFI) and the percentage of highly immature sperm nuclei with abnormal proteins (high stainability) [33].
A total of 35 semen parameters were quantified in five categories: 1) 5 general characteristics: sperm concentration (×106/mL), semen volume (mL), total sperm count (×106/ejaculate), straw distance (mm), hypo-osmotic swollen (%); 2) 8 motility measures: average path velocity (µm/sec), straight line velocity (µm/sec), curvilinear velocity (µm/sec), amplitude head displacement (µm), beat cross frequency (Hz), straightness (%), linearity (%), and percent motility (%); 3) 6 sperm head measures: length (µm), area (µm2), width (µm), perimeter (µm), elongation factor (%), and acrosome area of head (%); 4) 14 morphology measures: strict criteria (%), traditional normal (%), amorphous (%), round (%), pyriform (%), bicephalic (%), taper (%), megalo head (%), micro head (%), neck and midpiece abnormalities (%), coiled tail (%), other tail abnormalities (%), cytoplasmic droplet (%), and immature sperm (n); and 5) 2 sperm chromatin stability measures: DNA fragmentation index (%) and high DNA stainability (%). Six parameters were derived from other parameters: sperm concentration is equal to total sperm count divided by volume; sperm head area, perimeter, and elongation factor are functions of sperm head length and width; percent linearity is a function of the straight-line and curvilinear velocity; percent straightness is a function of straight-line and average path velocity. The second semen sample was assessed to conduct an abbreviated semen analysis on key endpoints (i.e., volume, concentration, next-day motility, and sperm head morphology) and to corroborate azoospermia observed in the first sample (n=5, 1%) so that men could be informed and seek care.
2.5 Statistical analysis
Univariate analyses assessed the distributions of antimicrobials and relevant covariates. Significance was assessed using the Chi-Square and Wilcoxon non-parametric tests for categorical and continuous covariates, respectively, when comparing men who did and did not provide a semen sample by lifestyle characteristics. Median and accompanying interquartile ranges (IQRs) of urinary chemical concentrations were calculated; medians were compared between males who did/did not provide a semen sample using Wilcoxon-Mann-Whitney tests.
To avoid biasing regression estimates, instrument-derived values for all antimicrobials were used in all models with log-transformed urinary creatinine included as a covariate; urinary concentrations below the LOQ were not substituted in any manner to avoid introducing bias when estimating human health effects [34–36]. Urinary antimicrobials were natural-log (1+x) transformed (ln) to normalize distributions; concentrations were also rescaled by their standard deviations (SD) for a meaningful interpretation of regression estimates. Semen parameters underwent Box-Cox transformations to approach approximately normal distributions and to avoid potential inflation of regression coefficient estimates prior to regression analyses [37].
Of the 473 (94%) men who provided semen samples, 378 (80%) provided two samples requiring the use of linear mixed effects models to account for the dependency in repeated semen measures. Urinary concentrations of antimicrobials were modeled individually for each semen parameter and adjusted based on a priori selection of covariates: age (years), urinary creatinine (ng/mL), body mass index (kg/m2), and race (non-Hispanic White, non-Hispanic Black, Hispanic, other). All analyses were performed using SAS (version 9.4; SAS Institute Inc., Cary, NC).
3.0 Results
Among the 473 (94%) men who provided ≥ 1 semen samples, 419 (89%) had available urine for toxicologic analysis. As such, the cohort comprised mostly white non-Hispanic men (79%) with a mean (± SD) age of 31.8 ± 4.9 years and a mean BMI of 29.8 ± 5.6 (Table 1). In general, there were no differences between men who did or did not provide a semen sample.
Table 1.
Comparison of male characteristics by semen sample status.
| Overall (n = 501) | Provided sample (n = 473) | No sample (n = 28) | |
|---|---|---|---|
| Age categories | n (%) | n (%) | n (%) |
| <30 | 176 (35.1) | 167 (35.3) | 9 (32.1) |
| 30–40 | 303 (60.5) | 285 (60.3) | 18 (64.3) |
| 40+ | 22 (4.4) | 21 (4.4) | 1 (3.6) |
| Age (years), mean ± SD | 31.8 ± 4.9 | 31.8 ± 4.9 | 31.7 ± 5.9 |
| BMI categories | |||
| Under/healthy (BMI < 25) | 84 (16.9) | 81 (17.3) | 3 (10.7) |
| Overweight (25 <= BMI < 30) | 206 (41.5) | 192 (41.0) | 14 (50.0) |
| Obese (30 <= BMI <35) | 131 (26.4) | 122 (26.1) | 9 (32.1) |
| Morbidly Obese (BMI >= 35) | 75 (15.1) | 73 (15.6) | 2 (7.1) |
| BMI (kg/m2) mean ± SD | 29.8 ± 5.6 | 29.9 ± 5.6 | 29.2 ± 4.0 |
| Race/Ethnicity* | |||
| Non-Hispanic White | 394 (79.1) | 381 (80.9) | 13 (48.1) |
| Non-Hispanic Black | 23 (4.6) | 20 (4.2) | 3 (11.1) |
| Hispanic | 45 (9.0) | 38 (8.1) | 7 (25.9) |
| Other | 36 (7.2) | 32 (6.8) | 4 (14.8) |
| Conditional Parity | |||
| No pregnancies | 215 (43.2) | 206 (43.7) | 9 (33.3) |
| Never fathered a pregnancy | 44 (8.8) | 40 (8.5) | 4 (14.8) |
| Fathered a pregnancy | 239 (48.0) | 225 (47.8) | 14 (51.9) |
| Income | |||
| < $50,000 | 77 (15.7) | 71 (15.3) | 6 (22.2) |
| $50,000 – $99,000 | 237 (48.3) | 227 (48.9) | 10 (37.0) |
| at least $100,000 | 177 (36.0) | 166 (35.8) | 11 (40.7) |
p-values < 0.05 are from independent t-test for continuous characteristics or chi-square test for categorical characteristics.
Distributions of urinary antimicrobials for male partners who did or did not provide a semen sample are displayed in Table 2. Overall, antimicrobial chemicals were readily detected in male urine (range 12% –100%), with the exception of TCC and HP. While median (IQR) urinary concentrations tended to be slightly higher among men who did not relative to those who did provide a semen sample, the differences were not significant. Among various chemicals measured, 4-HB was the most abundant in urine followed by 3,4-DHB, OH-MeP, TCS and MeP. Median concentrations of other antimicrobials were below 5 ng/mL.
Table 2.
Comparison of median urinary chemical concentrations by semen sample status.
| Overall (n = 439) | Provided sample (n = 419) | No sample (n = 20) | |
|---|---|---|---|
| Urinary Chemicals (ng/mL) | Median (IQR) | Median (IQR) | Median (IQR) |
| Methyl-paraben | 6.55 (2.13, 26.4) | 6.51 (2.16, 26.4) | 7.23 (1.83, 75.0) |
| Ethyl-paraben | 0.37 (0.17, 1.26) | 0.36 (0.17, 1.24) | 0.88 (0.18, 3.81) |
| Propyl-paraben | 1.45 (0.49, 5.55) | 1.39 (0.49, 5.52) | 2.41 (0.51, 18.2) |
| Butyl-paraben | 0.03 (0.01, 0.17) | 0.03 (0.01, 0.17) | 0.03 (0.02, 0.17) |
| Benzyl-paraben | 0.02 (0.00, 0.04) | 0.02 (0.00, 0.04) | 0.01 (0.00, 0.05) |
| 4-hydroxy benzoic acid | 614 (348, 920) | 612 (348, 922) | 668 (397, 877) |
| 3,4-dihydroxy benzoic acid | 33.0 (18.6, 57.2) | 33.3 (18.7, 57.3) | 25.9 (15.3, 36.0) |
| Methyl-protocatechuic acid | 20.9 (12.3, 45.6) | 21.2 (12.2, 48.1) | 19.5 (14.4, 34.1) |
| Ethyl-protocatechuic acid | 3.57 (1.17, 11.81) | 3.57 (1.17, 11.81) | 4.29 (1.1, 11.0) |
| Triclosan | 17.6 (4.42, 77.1) | 17.2 (4.39, 77.5) | 26.8 (6.60, 48.8) |
| Triclocarban | 0.01 (0.00, 0.03) | 0.01 (0.00, 0.03) | 0.01 (0.00, 0.10) |
Abbreviations: IQR, interquartile range.
Effect estimates and 95% CIs for urinary chemicals and semen quality parameters for which a significant association was observed are presented in Table 3. Inverse associations were observed between a 1-SD increase in ln-EP and ln-BP and sperm count [β (95% CI) = −6.96 (−12.8, −1.08) and −6.89 (−12.9, −0.85), respectively]; and ln-MP and ln-EP and percent motile sperm [β (95% CI) = −1.56 (−2.87, −0.26) and −1.50 (−2.76, −0.24), respectively]. Consistently, BP was associated with reductions in most sperm motility parameters: [β (95% CI), average path velocity: −1.95 (−3.35, − 0.54); straight-line velocity: −3.32 (−5.54, −1.10); curvilinear velocity: −2.71 (−5.14, −0.27); beat cross frequency: −0.95 (−1.76, −0.13); percent straightness: −3.32 (−5.54, −1.10) and; percent linearity: −2.30 (−3.78, −0.82)], with the exception of amplitude of lateral head and percent motility. A 1-SD increase in several natural-log-transformed concentrations of urinary chemicals were associated with potential enhanced semen quality parameters. In particular, in EP, BP and OHMeP were associated with a smaller percentage of micro head sperm [β (95% CI) = −0.17 (−0.30, − 0.04), −0.15 (−0.28, −0.01) and −0.16 (−0.29, −0.02), respectively]. Additionally, PP and OH-MeP were associated with increases in the percentage of sperm head with acrosome [β (95% CI) = 0.72 (0.17, 1.27) and 0.73 (0.18, 1.27), respectively]. Other associations reflective of enhanced semen quality include a 1-SD increase in natural-log transformed OH-MeP and OH-EtP and sperm morphology. Specifically, OH-MeP was positively associated with percent normal sperm [β (95% CI) = 1.44 (0.08, 2.80)] and reductions in percent cytoplasmic droplet [β (95% CI) = −0.72 (−1.28, −0.16)] and the number of immature sperm [β (95% CI) = −2.15 (−4.17, −0.13)]. Additionally, OHEtP was consistently associated with an increased % normal sperm based on both the strict [β (95% CI) = 1.31 (0.22, 2.40)] and the WHO criteria [β (95% CI) = 1.74 (0.38, 3.09)]. Associations between urinary antimicrobials and sperm morphometry endpoints included a 1-SD increase in natural-log transformed EP and increases in sperm head length; sperm head area; and sperm head perimeter [β (95% CI) = 0.04 (0.01, 0.07), 0.14 (0.04, 0.23), and 0.09 (0.03, 0.14), respectively].
Table 3.
Significant associations between urinary antimicrobial concentrations and semen quality parameters.
| MP | EP | PP | BP | OH-MeP | OH-EtP | TCS | |
|---|---|---|---|---|---|---|---|
| Semen parameter | β (95% CI) | β (95% CI) | β (95% CI) | β (95% CI) | β (95% CI) | β (95% CI) | β (95% CI) |
| General characteristics | |||||||
| Sperm concentration (* 10^6/ml) | −1.91 (−8.03, 4.21) | −6.96 (−12.8, −1.08) | −2.38 (−8.45, 3.69) | −6.89 (−12.9, −0.85) | 0.95 (−5.06, 6.96) | 1.69 (−4.34, 7.72) | 6.44 (0.20, 12.7) |
| Total count (* 10^6/ml concentration × volume) | −14.6 (−35.3, 6.05) | −18.7 (−38.7, 1.30) | −6.67 (−27.3, 13.9) | −11.1 (−31.7, 9.46) | 8.13 (−12.2, 28.5) | 4.45 (−16.0, 24.9) | 22.1 (0.98, 43.3) |
| Motility | |||||||
| Average path velocity (µm/sec) | −1.24 (−2.66, 0.19) | −1.04 (−2.43, 0.34) | −0.35 (−1.77, 1.07) | −1.95 (−3.35, −0.54) | 0.54 (−0.86, 1.95) | 1.05 (−0.36, 2.45) | 0.11 (−1.36, 1.58) |
| Straight-line velocity (µm/sec) | −0.88 (−2.06, 0.3) | −0.91 (−2.06, 0.23) | −0.05 (−1.22, 1.13) | −1.67 (−2.83, −0.51) | 0.77 (−0.39, 1.93) | 0.86 (−0.30, 2.03) | −0.21 (−1.43, 1.00) |
| Curvilinear velocity (µm/sec) | −1.6 (−4.06, 0.86) | −1.15 (−3.53, 1.24) | −0.59 (−3.04, 1.86) | −2.71 (−5.14, −0.27) | 0.24 (−2.18, 2.66) | 1.30 (−1.13, 3.72) | 0.82 (−1.71, 3.35) |
| Beat cross frequency (Hz) | −0.47 (−1.29, 0.36) | −0.06 (−0.86, 0.74) | −0.34 (−1.16, 0.48) | −0.95 (−1.76, −0.13) | 0.03 (−0.78, 0.84) | 0.74 (−0.07, 1.55) | −0.17 (−1.01, 0.68) |
| Straightness (%) | −0.72 (−2.98, 1.54) | −1.31 (−3.49, 0.87) | 0.15 (−2.10, 2.39) | −3.32 (−5.54, −1.1) | 0.53 (−1.68, 2.75) | 1.32 (−0.91, 3.54) | −0.98 (−3.30, 1.33) |
| Linearity (%) | −0.81 (−2.32, 0.7) | −1.19 (−2.64, 0.27) | 0.07 (−1.43, 1.57) | −2.30 (−3.78, −0.82) | 0.61 (−0.87, 2.09) | 0.81 (−0.68, 2.29) | −0.76 (−2.31, 0.79) |
| Percent Motility (%) | −1.56 (−2.87, −0.26) | −1.5 (−2.76, −0.24) | −1.03 (−2.33, 0.27) | −0.95 (−2.25, 0.35) | 0.48 (−0.81, 1.77) | 0.94 (−0.34, 2.23) | −1.07 (−2.41, 0.27) |
| Morphometry | |||||||
| Sperm head length (µm) | −0.01 (−0.04, 0.02) | 0.04 (0.01, 0.07) | 0.00 (−0.03, 0.03) | 0.01 (−0.02, 0.04) | 0.00 (−0.03, 0.03) | −0.01 (−0.04, 0.02) | −0.01 (−0.04, 0.02) |
| Sperm head area (µm2) | 0.02 (−0.08, 0.12) | 0.14 (0.04, 0.23) | 0.07 (−0.03, 0.17) | 0.08 (−0.02, 0.18) | −0.01 (−0.10, 0.09) | 0.03 (−0.07, 0.12) | −0.01 (−0.11, 0.09) |
| Sperm head width (µm) | 0.01 (−0.01, 0.03) | 0.01 (−0.01, 0.03) | 0.02 (0.00, 0.04) | 0.01 (0.00, 0.03) | 0.01 (−0.01, 0.03) | 0.02 (0.00, 0.03) | 0.00 (−0.02, 0.02) |
| Sperm head perimeter (µm) | 0.00 (−0.06, 0.05) | 0.09 (0.03, 0.14) | 0.02 (−0.04, 0.07) | 0.03 (−0.02, 0.09) | −0.01 (−0.07, 0.04) | −0.01 (−0.06, 0.05) | −0.01 (−0.07, 0.05) |
| Sperm head with acrosome (%) | 0.43 (−0.13, 0.99) | −0.32 (−0.86, 0.22) | 0.72 (0.17, 1.27) | −0.42 (−0.98, 0.13) | 0.73 (0.18, 1.27) | −0.03 (−0.58, 0.52) | 0.05 (−0.52, 0.62) |
| Micro head (%) | −0.14 (−0.27, 0.00) | −0.17 (−0.3, −0.04) | −0.14 (−0.27, 0.00) | −0.15 (−0.28, −0.01) | −0.16 (−0.29, −0.02) | −0.10 (−0.24, 0.03) | −0.09 (−0.23, 0.06) |
| Morphology | |||||||
| Percent normal, strict criteria (%) | 0.02 (−1.1, 1.14) | −0.89 (−1.95, 0.17) | 0.13 (−0.98, 1.23) | −0.14 (−1.22, 0.94) | 0.91 (−0.19, 2.00) | 1.31 (0.22, 2.40) | 0.27 (−0.88, 1.43) |
| Percent normal, WHO normal (%) | 0.19 (−1.2, 1.58) | −1.14 (−2.46, 0.18) | 0.43 (−0.94, 1.81) | −0.2 (−1.55, 1.14) | 1.44 (0.08, 2.80) | 1.74 (0.38, 3.09) | 0.31 (−1.12, 1.74) |
| Cytoplasmic droplet (%) | −0.02 (−0.59, 0.56) | 0.01 (−0.53, 0.56) | −0.14 (−0.71, 0.43) | −0.24 (−0.79, 0.32) | −0.72 (−1.28, −0.16) | −0.25 (−0.81, 0.32) | 0.06 (−0.52, 0.65) |
| Immature sperm (# immature) | −1.22 (−3.28, 0.84) | −0.54 (−2.50, 1.42) | −0.43 (−2.46, 1.61) | −0.68 (−2.67, 1.31) | −2.15 (−4.17, −0.13) | −0.10 (−2.12, 1.93) | −0.49 (−2.61, 1.63) |
Abbreviations: MP, methyl-paraben; EP, ethyl-paraben; PP, propyl-paraben; BP, butyl-paraben; OH-MeP, methyl-protocatechuic acid; OH-EtP, ethyl-protocatechuic acid and TCS, triclosan; β, regression coefficient; CI, confidence intervals.
Linear mixed models were adjusted for creatinine (ng/g), race, age (years) and body mass index (kg/m2).
Statistically significant associations (p<0.05) are presented in bold.
4.0 Discussion
Among men recruited from the general population who were participating in a prospective pregnancy study with preconception enrollment, we observed important bi-directional associations between environmentally relevant concentrations of urinary antimicrobials and semen quality. Associations observed for urinary parabens, MP, EP and BP were suggestive of diminished sperm count and motility parameters. Conversely, positive associations were observed between the hydroxylated metabolites, OH-MeP and OH-EtP, and sperm morphometry and morphology parameters suggesting possible improvements in semen quality[31]. Of note, OH-MeP and OHEtP were associated with a 1.4 % and 1.7% increase % normal sperm morphology, respectively. Additionally, TCS was associated with increased sperm count and total concentration, which is derived in part from sperm count divided by volume, which was not related with any of the urinary antimicrobials under study in this analysis. Moreover, none of the urinary antimicrobials were associated with sperm DNA integrity, as measured by the percentage of DNA fragmentation or high stainability [32, 38].
Our findings are not directly comparable with other work as we found none that studied men from the general population. Comparing our findings with two studies of men seeking clinical care, important differences emerged. Distinctively, one study of males from subfertile couples from Massachusetts, USA, seeking treatment at an infertility clinic reported that BP categories were associated with a dose-related increase in percent DNA located in the tail [16]; an endpoint that was not assessed in our analysis. Furthermore, in a study of males with normal semen concentration from Lodz, Poland who attended an infertility clinic for diagnostic purposes, BP concentrations to be significantly associated with an increase in % abnormal sperm and a decrease in % motile sperm [39]. We observed several inverse associations between BP and motility parameters (average path velocity, straight line velocity, curvilinear velocity, beat cross frequency, straightness, and linearity) among our cohort. Suggesting that while speed and directionality of sperm may be affected, % motile sperm may remain impervious to environmental insults. It is also important to consider that in LIFE, a cohort of men recruited from the general population, we may be underpowered to detect such effects, compared with men from the infertility population, having a higher percentage of men with poorer semen quality endpoints. Another possible explanation for heterogeneity in study findings may be the result of the next-day motility assessment. While we acknowledge that a percentage of sperm are alive after 24 hours and a next-day motility assessment still can be made and may provide important information on sperm function and survivability [25], 24-hour semen analysis is not entirely comparable to clinical analysis.
Urinary concentrations of parabens measured in LIFE males were much smaller than those in previous studies. Given that the males in the National Health and Nutrition Examination Survey (NHANES) were ≥ 6 years of age [40], we compared urinary paraben concentrations from our cohort with those from previous studies of males of reproductive age. Specifically, uncorrected median urinary MP, PP, BP (the only three parabens that were measured across all three studies) concentrations were reported to be 27.4, 3.45, < 0.2 µg/L, respectively, for men recruited from an IVF clinic [16], whereas the concentrations were 6.6, 1.5, 0.03, respectively, for our men. Likewise, Jurewicz et al., 2017 measured higher MP, PP and BP concentrations [15.6, 3.7, 3.5 µg/L, respectively] among their male participants in comparison with our study[39]. We are unable to compare concentrations of paraben metabolites with other studies of the general U.S. population as majority of these studies focus only on the parent esters in urine. Still, we found 3,4-DHB, OH-MeP to be the most abundant of all chemicals measured in urine, which is expected given that parabens are metabolized extensively and only 2% of parabens are excreted as parent compounds.
In consideration of biologic plausibility, the emergence of BP as the paraben predominantly associated with diminished semen quality endpoints in our study is consistent with both in vitro and animal data that is suggestive of BP-related reproductive toxicity on spermatogenesis via spermicidal or estrogenic action [41]. Some research even suggest that BP has greater estrogenic activity with the order of the others being (MP< EP < PP) [42]. Moreover, our finding of decreased sperm concentration in the context of BP is in agreement with previously reported reductions in sperm concentration and daily sperm production among Wistar rats to whom BP was administered at 3 weeks old [11]. Nevertheless, it is worth noting that overall associations in this work were suggestive of both diminished and enhanced semen quality. Such findings are in line with our previous findings suggesting that the potential effects of paraben exposures on couples’ fecundability, as measured by a longer time-to-pregnancy, in the LIFE Study may be predominantly driven by female and not male partners’ exposures [26]. Nonetheless, we cannot ignore the possibility of chance findings in light of multiple analyses having been performed. Still, the number of observed significant associations was greater than what was to be expected merely by chance at the α=0.05 level. While speculative, our findings may suggest that semen quality may be affected by specific parabens and metabolites, but these findings await corroboration.
Findings from the present analysis are strengthened by recruitment of a large number of men from the general population, high compliance rates for the collection of two semen samples with no observed differences in urinary concentrations between men who did or did not provide a sample, analyses of a range (n=35) semen endpoints, and attention to relevant covariates. Still, cautious interpretation of the findings is needed, given important study limitations including reliance on a single spot urine, uncorrected comparisons, and potential for residual confounding given the observational study design. Collectively, the findings support continued investigation into EDCs including parabens and male fecundity.
5.0 Conclusions
We found evidence of an inverse association between BP and sperm concentration and specific motility markers, while hydroxylated metabolites and TCS were suggestive of enhanced sperm morphometry and morphology.
Highlights.
Several significant bi-directional associations were observed
Methyl, ethyl and butyl parabens were associated with diminished semen quality
Hydroxylated metabolites were consistently associated with enhanced semen quality
Butyl paraben associated with diminished velocity and direction, not % motility
No evidence of association between urinary antimicrobials and sperm DNA damage
Acknowledgments
Funding: This work was supported by the National Institutes of Health, Intramural Research Program, Eunice Kennedy Shriver National Institute of Child Health and Human Development (contracts N01-HD-3–3355; N01-HD-3–3356; NOH-HD-3–3358; HHSN27500003).
Abbreviations
- MP
methyl-paraben
- EP
ethyl-paraben
- PP
propyl-paraben
- BP
butyl-paraben
- BzP
benzyl-paraben
- 4-HB
4-hydroxy benzoic acid
- 3,4-DHB
3,4-dihydroxy benzoic acid
- OH-MeP
methyl-protocatechuic acid
- OH-EtP
ethyl-protocatechuic acid
- TCS
triclosan
- TCC
triclocarban.
Footnotes
Publisher's Disclaimer: This is a PDF file of an unedited manuscript that has been accepted for publication. As a service to our customers we are providing this early version of the manuscript. The manuscript will undergo copyediting, typesetting, and review of the resulting proof before it is published in its final citable form. Please note that during the production process errors may be discovered which could affect the content, and all legal disclaimers that apply to the journal pertain.
Competing Financial Interests: The authors declare they have no actual or potential competing financial interests.
References
- 1.Liao C, Liu F, Kannan K. Occurrence of and dietary exposure to parabens in foodstuffs from the United States. Environ Sci Technol. 2013;47(8):3918–25. doi: 10.1021/es400724s. [DOI] [PubMed] [Google Scholar]
- 2.Guo Y, Kannan K. A survey of phthalates and parabens in personal care products from the United States and its implications for human exposure. Environ Sci Technol. 2013;47(24):14442–9. doi: 10.1021/es4042034. [DOI] [PubMed] [Google Scholar]
- 3.Schettler T. Human exposure to phthalates via consumer products. Int J Androl. 2006;29(1):134–9. doi: 10.1111/j.1365-2605.2005.00567.x. discussion 181-5. [DOI] [PubMed] [Google Scholar]
- 4.Dodge LE, et al. Medications as a source of paraben exposure. Reproductive Toxicology. 2015;52(0):93–100. doi: 10.1016/j.reprotox.2015.02.002. [DOI] [PMC free article] [PubMed] [Google Scholar]
- 5.Liao C, Kannan K. Concentrations and composition profiles of parabens in currency bills and paper products including sanitary wipes. Sci Total Environ. 2014;475:8–15. doi: 10.1016/j.scitotenv.2013.12.097. [DOI] [PubMed] [Google Scholar]
- 6.Chen J, et al. Antiandrogenic properties of parabens and other phenolic containing small molecules in personal care products. Toxicol Appl Pharmacol. 2007;221(3):278–84. doi: 10.1016/j.taap.2007.03.015. [DOI] [PMC free article] [PubMed] [Google Scholar]
- 7.Boberg J, et al. Possible endocrine disrupting effects of parabens and their metabolites. Reproductive Toxicology. 2010;30(2):301–312. doi: 10.1016/j.reprotox.2010.03.011. [DOI] [PubMed] [Google Scholar]
- 8.Halden RU, et al. The Florence Statement on Triclosan and Triclocarban. Environ Health Perspect. 2017;125(6):064501. doi: 10.1289/EHP1788. [DOI] [PMC free article] [PubMed] [Google Scholar]
- 9.Ye X, et al. Parabens as Urinary Biomarkers of Exposure in Humans. Environ Health Perspect. 2006;114(12):1843–6. doi: 10.1289/ehp.9413. [DOI] [PMC free article] [PubMed] [Google Scholar]
- 10.Witorsch RJ, Thomas JA. Personal care products and endocrine disruption: A critical review of the literature. Crit Rev Toxicol. 2010;40(Suppl 3):1–30. doi: 10.3109/10408444.2010.515563. [DOI] [PubMed] [Google Scholar]
- 11.Oishi S. Effects of butylparaben on the male reproductive system in rats. Toxicol Ind Health. 2001;17(1):31–9. doi: 10.1191/0748233701th093oa. [DOI] [PubMed] [Google Scholar]
- 12.Oishi S. Effects of propyl paraben on the male reproductive system. Food and Chemical Toxicology. 2002;40(12):1807–1813. doi: 10.1016/s0278-6915(02)00204-1. [DOI] [PubMed] [Google Scholar]
- 13.Zorrilla LM, et al. The effects of triclosan on puberty and thyroid hormones in male Wistar rats. Toxicol Sci. 2009;107(1):56–64. doi: 10.1093/toxsci/kfn225. [DOI] [PubMed] [Google Scholar]
- 14.Kumar V, et al. Alteration of testicular steroidogenesis and histopathology of reproductive system in male rats treated with triclosan. Reprod Toxicol. 2009;27(2):177–85. doi: 10.1016/j.reprotox.2008.12.002. [DOI] [PubMed] [Google Scholar]
- 15.Kumar V, Balomajumder C, Roy P. Disruption of LH-induced testosterone biosynthesis in testicular Leydig cells by triclosan: probable mechanism of action. Toxicology. 2008;250(2–3):124–31. doi: 10.1016/j.tox.2008.06.012. [DOI] [PubMed] [Google Scholar]
- 16.Meeker JD, et al. Urinary concentrations of parabens and serum hormone levels, semen quality parameters, and sperm DNA damage. Environ Health Perspect. 2011;119(2):252–7. doi: 10.1289/ehp.1002238. [DOI] [PMC free article] [PubMed] [Google Scholar]
- 17.Dodge LE, et al. Paternal Urinary Concentrations of Parabens and Other Phenols in Relation to Reproductive Outcomes among Couples from a Fertility Clinic. Environ Health Perspect. 2015 doi: 10.1289/ehp.1408605. [DOI] [PMC free article] [PubMed] [Google Scholar]
- 18.Jurewicz J, et al. Environmental exposure to parabens and sperm chromosome disomy. Int J Environ Health Res. 2017:1–12. doi: 10.1080/09603123.2017.1339784. [DOI] [PubMed] [Google Scholar]
- 19.Zhu W, et al. Environmental Exposure to Triclosan and Semen Quality. International Journal of Environmental Research and Public Health. 2016;13(2):224. doi: 10.3390/ijerph13020224. [DOI] [PMC free article] [PubMed] [Google Scholar]
- 20.Buck Louis GM, et al. Designing prospective cohort studies for assessing reproductive and developmental toxicity during sensitive windows of human reproduction and development--the LIFE Study. Paediatr Perinat Epidemiol. 2011;25(5):413–24. doi: 10.1111/j.1365-3016.2011.01205.x. [DOI] [PMC free article] [PubMed] [Google Scholar]
- 21.Lohman TG, Roche AF, Martorell R. Anthropometric standardization reference manual. Champaign, IL: Human Kinetics Books; 1988. [Google Scholar]
- 22.Royster MO, et al. Evaluation of a container for collection and shipment of semen with potential uses in population-based, clinical, and occupational settings. J Androl. 2000;21(3):478–84. [PubMed] [Google Scholar]
- 23.Luben TJ, et al. The healthy men study: an evaluation of exposure to disinfection byproducts in tap water and sperm quality. Environ Health Perspect. 2007;115(8):1169–76. doi: 10.1289/ehp.10120. [DOI] [PMC free article] [PubMed] [Google Scholar]
- 24.Olshan AF, et al. The healthy men study: design and recruitment considerations for environmental epidemiologic studies in male reproductive health. Fertil Steril. 2007;87(3):554–64. doi: 10.1016/j.fertnstert.2006.07.1517. [DOI] [PubMed] [Google Scholar]
- 25.Stovall DW, et al. Sperm recovery and survival: two tests that predict in vitro fertilization outcome. Fertil Steril. 1994;62(6):1244–9. doi: 10.1016/s0015-0282(16)57193-3. [DOI] [PubMed] [Google Scholar]
- 26.Smarr MM, et al. Urinary Concentrations of Parabens and Other Antimicrobial Chemicals and Their Association with Couples' Fecundity. Environ Health Perspect. 2017;125(4):730–736. doi: 10.1289/EHP189. [DOI] [PMC free article] [PubMed] [Google Scholar]
- 27.Zinaman MJ, et al. Evaluation of computer-assisted semen analysis (CASA) with IDENT stain to determine sperm concentration. J Androl. 1996;17(3):288–92. [PubMed] [Google Scholar]
- 28.Turner T, Schrader S. Sperm migration assay as measure of recently ejaculated sperm motility in specimens shipped overnight [Abstract] J Androl. 2006;27(suppl) (58) [Google Scholar]
- 29.Jeyendran RS, Van der Ven HH, Zaneveld LJ. The hypoosmotic swelling test: an update. Arch Androl. 1992;29(2):105–16. doi: 10.3109/01485019208987714. [DOI] [PubMed] [Google Scholar]
- 30.Schrader SM, Turner TW, Simon SD. Longitudinal study of semen quality of unexposed workers: sperm head morphometry. J Androl. 1990;11(1):32–9. [PubMed] [Google Scholar]
- 31.Organization), W.W.H. Laboratory Manual for the Examination of Human Semen and Semen-Cervical Mucus Interaction. 1992 [Google Scholar]
- 32.Evenson DP, Larson KL, Jost LK. Sperm chromatin structure assay: its clinical use for detecting sperm DNA fragmentation in male infertility and comparisons with other techniques. J Androl. 2002;23(1):25–43. doi: 10.1002/j.1939-4640.2002.tb02599.x. [DOI] [PubMed] [Google Scholar]
- 33.Evenson DP. Sperm chromatin structure assay (SCSA(R)) Methods Mol Biol. 2013;927:147–64. doi: 10.1007/978-1-62703-038-0_14. [DOI] [PubMed] [Google Scholar]
- 34.Schisterman EF, et al. The limitations due to exposure detection limits for regression models. Am J Epidemiol. 2006;163(4):374–83. doi: 10.1093/aje/kwj039. [DOI] [PMC free article] [PubMed] [Google Scholar]
- 35.Lubin JH, et al. Epidemiologic Evaluation of Measurement Data in the Presence of Detection Limits. Environ Health Perspect. 2004;112(17):1691–6. doi: 10.1289/ehp.7199. [DOI] [PMC free article] [PubMed] [Google Scholar]
- 36.Richardson DB, Ciampi A. Effects of exposure measurement error when an exposure variable is constrained by a lower limit. Am J Epidemiol. 2003;157(4):355–63. doi: 10.1093/aje/kwf217. [DOI] [PubMed] [Google Scholar]
- 37.Handelsman DJ. Optimal power transformations for analysis of sperm concentration and other semen variables. J Androl. 2002;23(5):629–34. [PubMed] [Google Scholar]
- 38.Bungum M, Bungum L, Giwercman A. Sperm chromatin structure assay (SCSA): a tool in diagnosis and treatment of infertility. Asian J Androl. 2011;13(1):69–75. doi: 10.1038/aja.2010.73. [DOI] [PMC free article] [PubMed] [Google Scholar]
- 39.Jurewicz J, et al. Human Semen Quality, Sperm DNA Damage, and the Level of Reproductive Hormones in Relation to Urinary Concentrations of Parabens. J Occup Environ Med. 2017 doi: 10.1097/JOM.0000000000001106. [DOI] [PubMed] [Google Scholar]
- 40.Calafat AM, et al. Urinary Concentrations of Four Parabens in the U.S. Population: NHANES 2005–2006. Environ Health Perspect. 2010;118(5):679–85. doi: 10.1289/ehp.0901560. [DOI] [PMC free article] [PubMed] [Google Scholar]
- 41.Garcia T, et al. Effects on the reproductive system of young male rats of subcutaneous exposure to n-butylparaben. Food Chem Toxicol. 2017;106(Pt A):47–57. doi: 10.1016/j.fct.2017.05.031. [DOI] [PubMed] [Google Scholar]
- 42.Darbre PD, Harvey PW. Paraben esters: review of recent studies of endocrine toxicity, absorption, esterase and human exposure, and discussion of potential human health risks. J Appl Toxicol. 2008;28(5):561–78. doi: 10.1002/jat.1358. [DOI] [PubMed] [Google Scholar]