Abstract
Infusion of prostaglandin (PG) D2 into the lateral ventricle of the brain induced an increase in the amount of non-rapid eye movement sleep in wild-type (WT) mice but not in mice deficient in the PGD receptor (DP). Immunofluorescence staining of WT mouse brain revealed that DP immunoreactivity was dominantly localized in the leptomeninges (LM) of the basal forebrain but that PGD synthase immunoreactivity was widely distributed in the LM of the entire brain. Electron microscopic observation indicated that DP-immunoreactive particles were predominantly located on the plasma membranes of arachnoid trabecular cells of the LM. The region with the highest DP immunoreactivity was clearly defined as bilateral wings in the LM of the basal forebrain located lateral to the optic chiasm in the proximity of the ventrolateral preoptic area, one of the putative sleep centers, and the tuberomammillary nucleus, one of the putative wake centers. The LM of this region contained DP mRNA 70-fold higher than that in the cortex as judged from the results of quantitative reverse transcription–PCR. PGD2 infusion into the subarachnoid space of this region increased the extracellular adenosine level more than 2-fold in WT mice but not in the DP-deficient mice. These results indicate that DPs in the arachnoid trabecular cells of the basal forebrain mediate an increase in the extracellular adenosine level and sleep induction by PGD2.
Prostaglandin (PG) D2 is a potent endogenous sleep-promoting substance in monkeys and rats, and its somnogenic mechanism is the best characterized among those of various sleep-inducing substances (reviewed in ref. 1). In brief, PGD2 infused into the subarachnoid space underlying the rostral basal forebrain was effective in inducing sleep but not when infused into most parts of the brain parenchyma of rats (2). The amount of PGD2-induced sleep was reduced by pretreatment with KF17837, the specific adenosine A2A receptor antagonist, in a dose-dependent manner (3). Administration of CGS21680, a selective A2A receptor agonist, into the subarachnoid space induced sleep (4), suggesting that PGD2-induced sleep is mediated by adenosine through the adenosine A2A receptor system. Furthermore, PGD2 infusion significantly increased Fos expression in the leptomeninges (LM) and neurons within the ventrolateral preoptic area, one of the putative sleep centers, and simultaneously decreased Fos expression in the tuberomammillary nucleus, one of the putative wake centers (5).
PGD synthase (PGDS) is mainly produced in the LM and choroid plexus of the brain (6) and secreted into the cerebrospinal fluid (CSF) to become β-trace, a major CSF protein (reviewed in ref. 7). We recently reported that human PGDS-overexpressing transgenic mice exhibited excessive amounts of non-rapid eye movement (NREM) sleep, but not rapid eye movement (REM) sleep, in response to the noxious stimulus by tail clipping, coupled with a significant increase in the PGD2 content in the brain (8). Therefore, PGD2, PGDS, and the PGDS gene are considered to be involved in the regulation of NREM sleep.
The cDNA for the PGD receptor (DP) has been isolated and characterized as one for a seven-transmembrane Gs protein-coupled rhodopsin-type receptor (9). The DP mRNA was abundant in the LM of mice (10) and rats (11). Furthermore, homozygous mutant mice deficient in DP (DP−/−) have been generated (12). However, the exact action site of PGD2 remains to be elucidated.
In this study, we raised a polyclonal antibody specific for mouse DP and demonstrated that the DP immunoreactivity was almost exclusively localized in a subpopulation of arachnoid trabecular cells of mouse basal forebrain. The pattern of DP immunoreactivity was compared with that of PGDS immunoreactivity by confocal double immunofluorescence histochemistry. We also demonstrated by using DP−/− mice that DP mediates an increase in the extracellular adenosine content in the subarachnoid space of the rostral basal forebrain and NREM sleep induction after PGD2 infusion.
Materials and Methods
Antibodies.
A 22-mer peptide, TRPLIYRNWSSHSQQSNVESTL, corresponding to the C-terminal cytoplasmic tail of mouse DP was synthesized, coupled to maleimide-activated keyhole limpet hemocyanin (Pierce), and then administered to guinea pigs by intradermal injection for immunization. After boosting, blood was collected to obtain serum, and the IgG fraction was affinity purified by passage through a column containing the synthetic peptide covalently coupled to NHS-activated Sepharose (Amersham Pharmacia) and used as anti-DP antibody. Rabbit polyclonal antibody against mouse PGDS was prepared as reported (7).
Transfected Cells.
Mouse cDNAs for DP (9), four subtypes of PGE receptors (EP1, EP2, EP3, EP4; refs. 13–16), PGI receptor (17), thromboxane A receptor (18), and PGF receptor (19) were subcloned and used to transfect COS7 cells by the lipofection method according to the manufacturer's protocol (GIBCO/BRL). Chinese hamster ovary (CHO) cells stably expressing each recombinant prostanoid receptor were established as reported (13–15, 17).
Western Blot.
Glutathione transferase–fusion protein containing the C-terminal fragment of DP was expressed in Escherichia coli. The transfected COS7 cells were lysed with 0.062 M Tris⋅HCl (pH 6.8) containing 3% SDS and 0.5% glycerol. Proteins in E. coli and COS7 cell lysates were separated by SDS/PAGE and then transferred to a nitrocellulose membrane. The transferred membrane was incubated with the DP antibody (1 μg/ml) followed by horseradish peroxidase-labeled goat anti-guinea pig IgG (Jackson ImmunoResearch) according to the manufacturer's instructions. The immunoreactive bands were then visualized by using an ECL Plus system (Amersham Pharmacia).
Mice.
Male wild-type (WT) and DP−/− mice of the inbred C57BL/6 strain (12) and WT mice of the ddy strain weighing 25.7 ± 0.9 g (12–15 weeks) were used in the experiments. The DP gene of DP−/− mice was disrupted by insertion of a neomycin resistance gene into the first coding exon, exon 2 (12). The animals were maintained under a 12:12 light/dark cycle (light from 8 a.m.) in temperature/humidity-controlled (23.0 ± 0.5°C/55 ± 2%) chambers and had free access to food and water. The experimental protocols were approved by the Animal Research Committee of Osaka Bioscience Institute.
Immunohistochemistry.
CHO cells stably expressing recombinant prostanoid receptors were fixed with 0.1% paraformaldehyde in 0.1 M sodium phosphate (pH 7.3) and immunostained as described below for mouse brain sections.
WT mice [C57BL/6 (n = 18) and ddy (n = 12)] and DP−/− (n = 6) mice were used to obtain basically identical data concerning the localization of DP. Under deep anesthesia with ether, the mice were intracardially perfused between 10 a.m. and 11 a.m. with PBS (pH 7.4) containing 10 μM p-amidinophenyl-methanesulfonyl fluoride and 10 μg/ml leupeptin, followed by 2% paraformaldehyde in 0.1 M sodium phosphate (pH 7.3). The brains were then removed, cryoprotected, and frozen in liquid nitrogen as described (20). Serial 10-μm-thick sections of the frozen coronal slices were incubated with the DP antibody and/or the PGDS antibody (1 μg of IgG/ml), followed with fluorescein-conjugated anti-guinea pig IgG antibody (Jackson ImmunoResearch) and/or the anti-rabbit IgG antibody coupled with Texas Red (Amersham Pharmacia). For single-label controls, the DP antibody preadsorbed with an excess amount of its antigen (50 μg/ml) or normal guinea pig IgG was used as a primary antibody. For double-label controls, one of the primary antibodies was omitted or replaced with the normal serum of the respective animal. The sections were finally viewed with a Bio-Rad MRC-1024 confocal imaging system. For immunoelectron microscopy, the preembedding silver-intensified immunogold method was used as described (20, 21).
Quantitative PCR.
Perfused mouse brains were divided into six brain areas (Table 1) under a microscope. Total RNA was extracted from each sample (22) and transcribed to first-strand cDNA with random primers by AMV reverse transcriptase (Takara Shuzo, Kyoto). For quantitative PCR, we amplified the cDNA by using a LightCycler (Roche Diagnostics) with a LightCycler-DNA Master SYBR Green I kit (Roche Diagnostics) and primers specific for mouse glyceraldehyde-3-phosphate dehydrogenase (GAPDH; 5′-TGAACGGGAAGCTCACTGG-3′ and 5′-TACAGCAACAGGGTGGTGGA-3′; expected PCR product size, 307 bp), mouse PGDS (5′-CAGGAAAAACCACGTGTGAGACC-3′ and 5′-AGAGGGTGGCCATGCGGAAG-3′; 195 bp), and mouse DP (5′-TTTGGGAAGTTCGTGCAGTACT-3′ and 5′-GCCATGAGGCTGGAGTAGA-3′; 113 bp) according to the manufacturer's instructions. The reactions were cycled 40 times with denaturation at 95°C for 3 s, annealing for both GAPDH and DP at 57°C for 5 s and for PGDS at 58°C for 5 s, and elongation at 72°C for 10 s. Temperature gradients for denaturation, annealing, and elongation were 20°C/s, 2°C/s, and 20°C/s, respectively. Fluorescence was acquired after heating at 20°C/s to a temperature of 2°C below the product melting temperature and holding this temperature for 1 s. All PCR products were sequenced to confirm their origin from the intended mRNAs.
Table 1.
Expression level of mRNA for DP or PGDS relative to that for GAPDH in various brain areas of WT mice
| Brain area | DP/GAPDH (×10−3) | PGDS/GAPDH |
|---|---|---|
| LM of rostral basal forebrain | 120.1 ± 14.0 | 311.6 ± 27.1 |
| LM of medulla oblongata | 41.3 ± 3.7 | 312.6 ± 24.0 |
| Cerebral neocortex with LM* | 1.7 ± 0.4 | 3.1 ± 0.6 |
| Choroid plexus | 7.9 ± 1.4 | 6.5 ± 0.7 |
| Gray matter | 1.4 ± 0.5 | 1.3 ± 0.1 |
| White matter | 1.6 ± 0.3 | 1.5 ± 0.3 |
Data represent means ± SEM (n = 4).
The surface portion of the neocortex with LM was collected.
Adenosine Measurement.
Under urethane anesthesia (1.6 g/kg, i.p.), mice were implanted with a microdialysis probe (CUP7, membrane length of 1 mm, Carnegie Medicin, Stockholm) into the subarachnoid space below the rostral basal forebrain at a position of 0.9 mm anterior and 0 mm lateral from the bregma and of 5.1 mm depth from the dura according to a mouse brain atlas (23). Artificial CSF (140 mM NaCl/3 mM KCl/1.3 mM CaCl2/1 mM MgCl2/4.5 mM glucose, pH 7.4) containing 1 mM erythro-9-(2-hydroxy-3-nonyl) adenine hydrochloride, an adenosine deaminase inhibitor, was perfused alone or with PGD2 at a flow rate of 1 μl/min and collected every 20 min. The adenosine content in the dialysate (20 μl) was determined by RP-HPLC with UV detection (24). The location of the probe was histologically verified at the end of each experiment.
Sleep Monitoring.
Under pentobarbital anesthesia (50 mg/kg, i.p.), mice were implanted with electrodes for recording of the electroencephalogram (EEG) and electromyogram (EMG), as described (8), and with a cannula for continuous infusion of vehicle (artificial CSF) or PGD2 into the lateral ventricle of the brain placed as follows. One stainless steel cannula (outer diameter, 0.2 mm) was stereotaxically placed 2.0 mm lateral from the bregma and inserted to a depth of 2.2 mm from the surface of the cortex at an angle of 25° from the midsagittal plane (25). After 10 days of recovery, the mice were transferred to the recording cages in the sound-attenuated shielded box and allowed 3 days of habituation. The infusion and the EEG and EMG recordings were carried out by means of a swivel and a slip ring designed to minimize the restriction of the behavioral movement of animals. Artificial CSF was continuously infused into the lateral ventricle of the brain at a flow rate of 1 μl/h for 5 days. On the fifth day, PGD2 was infused between 8 p.m. and 2 a.m. for 6 h. The EEG and EMG were recorded for two consecutive 24-h periods, baseline and experimental days, from the fourth day.
The EEG/EMG signals were amplified, filtered (EEG, 0.5–30 Hz; EMG, 20–200 Hz), digitized at a sampling rate of 128 Hz, and recorded by using SLEEPSIGN software (Kissei Comtec, Nagano, Japan) (8, 25). The vigilance states were automatically classified off-line by 4-s epochs into 3 stages of wakefulness, NREM, and REM sleep by SLEEPSIGN, according to the standard criteria (25, 26). Defined sleep–wake stages were finally examined visually and corrected, if necessary.
Statistics.
For vigilance studies, amounts of the different sleep–wake states were expressed in minutes. Statistical analyses were performed by use of the paired t test, with each animal serving as its own control. For the microdialysis data, two-way analysis of variance, followed by the Fisher's probable least-squares difference test, was used to determine whether the difference between groups was statistically significant. In all cases, P < 0.05 was taken as the level of significance.
Results
Preparation and Characterization of Anti-DP Antibody.
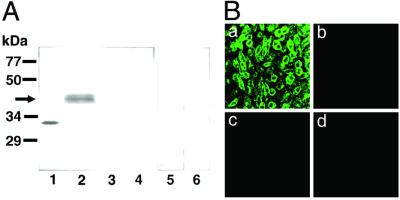
As judged by Western blotting (Fig. 1A), the DP antibody reacted with the fusion protein containing the C-terminal fragment of DP (32 kDa) as a positive control and also recognized a protein band of about 40 kDa in the DP-expressing COS cells corresponding to the calculated molecular weight (40,012) of the native mouse DP (9). However, no immunoreactive band was detected in COS cells expressing receptors for PGE (EP1–4), PGF, PGI, or thromboxane A (see Fig. 1A). Furthermore, no positive staining was observed in the DP-expressing cells when normal guinea pig serum or the preadsorbed antibody was used. By immunofluorescence staining, the DP antibody reacted with the DP-expressing CHO cells but not with the native CHO cells or those expressing receptors for EP2 or PGF (Fig. 1B), or others (data not shown). These data demonstrate that the DP antibody specifically reacted with DP and not with other PG receptors.
Figure 1.
Specificity of the DP antibody. (A) Western blot analysis with the DP antibody. The glutathione transferase-fused C-terminal fragment of DP expressed in E. coli (30 ng of protein, lane 1) and homogenate (200 μg of protein) of COS cells expressing receptor for DP (lanes 2, 5, and 6), EP2 (lane 3), or PGF (lane 4) were subjected to SDS/PAGE and transferred to a nitrocellulose membrane. The blot was immunostained with the DP antibody (lanes 1–4), normal guinea pig IgG (lane 5), or preadsorbed DP antibody (lane 6). (B) Immunofluorescence staining with the DP antibody. Photographs indicate the native CHO cells (b) and CHO cells stably expressing DP (a), EP2 receptor (c), or PGF receptor (d).
Double Immunofluorescence Detection of DP and PGDS in the Mouse Brain.
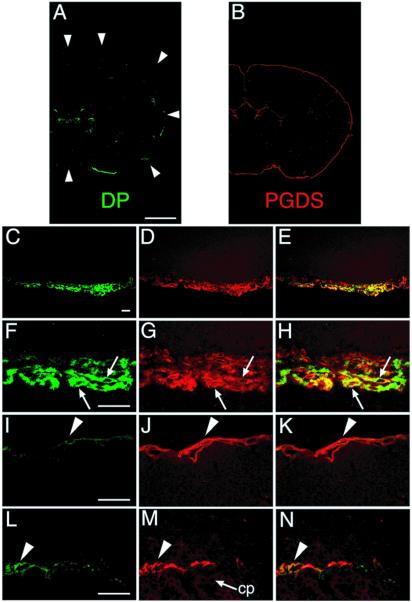
Serial coronal sections of the WT mouse brain were stained with both DP and PGDS antibodies. Typical confocal immunofluorescence images are given in Fig. 2. The DP immunoreactivity was localized almost exclusively in the LM on the ventral surface of the basal forebrain except the weak immunoreactivity in the pia/arachnoid membrane in the choroid plexus of the lateral and the third ventricles (Fig. 2A). When normal guinea pig IgG or the preadsorbed DP antibody was used, no positive immunofluorescence was observed in the coronal sections. The absence of DP-immunopositive staining was also confirmed in the LM of DP−/− mice (data not shown). In contrast, the PGDS immunoreactivity was localized in the LM surrounding the whole brain and in the choroid plexus facing the ventricles (Fig. 2B), in good agreement with our previous studies on rats (6).
Figure 2.
Double-immunofluorescence labeling of both DP and PGDS in WT mouse brain. Serial coronal sections were stained with two antibodies, one against DP (green; A, C, F, I, and L) and the other against PGDS (red; B, D, G, J, and M). Typical immunofluorescence-positive images (A–D, F, G, I, J, L, and M) and merged images (E, H, K, and N) are shown. (A) A coronal section 0.2 mm caudal to the bregma. The faint staining in the subcentral area is not associated with the choroid plexus. The circumference of the brain is outlined by the arrowheads. (B) A coronal section 0.5 mm caudal to the bregma. (C–E) A coronal section 0.1 mm caudal to the bregma. (F–H) A coronal section at the bregma. Arrows indicate the LM cells expressing both DP and PGDS. (I–K) A coronal section 3.5 mm caudal to the bregma. Arrowhead indicates the PGDS-expressing LM cells of the occipital cortex. (L–N) A coronal section 2.3 mm caudal to the bregma. The DP immunoreactivity was weakly detected in the neighboring LM cells at the ventricles (arrowhead) but not in the epithelial cells of the choroid plexus (cp). (Bar in A and B, 1 mm; bar in C–E, 30 μm; bar in F–N, 20 μm.)
When the DP-concentrated region on the ventral surface of the basal forebrain was observed at higher magnification (Fig. 2 C–H), the DP immunoreactivity was localized in a subpopulation of LM cells that were spindle or oval in shape, ≈20 μm long, and overlapped to form several layers in the arachnoid membrane (Fig. 2 C and F). The DP immunoreactivity was not detected in the dura mater, pia mater, or brain parenchyma. As the PGDS immunoreactivity was found in most of the LM cells (Fig. 2 D and G), the DP-expressing LM cells were simultaneously positive for the PGDS immunoreactivity (Fig. 2 E and H). The arachnoid cells positive for both DP and PGDS were intermingled with other arachnoid cells that were positive only for PGDS (Fig. 2H).
Outside the DP-concentrated region, the DP immunoreactivity was rarely found in the LM cells of the occipital cortex (Fig. 2 I–K) with a density of less than five immunoreactive cells per mm2 of arachnoid membrane. The DP immunoreactivity was not detected in the choroid plexus epithelial cells within the ventricles but was weakly present in the neighboring LM cells (Fig. 2L), whereas the PGDS immunoreactivity was widely distributed in both LM cells and choroid plexus epithelial cells (Fig. 2 M and N).
Electron Microscopic Localization of DP in the Arachnoid Trabecular Cells.
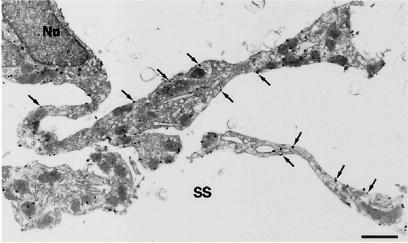
The ultrastructural localization of DP in the LM cells of the ventral surface of the basal forebrain was examined by immunoelectron microscopy. The DP-expressing cells had spindle-shaped cell bodies with well developed cellular processes projecting far into the subarachnoid space (Fig. 3). These immunoreactive cells were morphologically identified as arachnoid trabecular cells (2, 27). The immunogold particles for DP were mainly located on the plasma membranes (60.3 ± 6.2%; mean ± SEM, n = 5) and with less frequency on the intracellular membranes, such as the vesicles and endoplasmic reticulum (24.9 ± 3.6%). Little, if any, immunoreactivity was seen in arachnoid barrier cells and arachnoid pia mater cells.
Figure 3.
Ultrastructural localization of DP in arachnoid trabecular cells. The DP immunoreactivity is shown by black immunogold dots. A spindle-shaped cell body with a nucleus (Nu) and well developed cellular processes projecting far into the subarachnoid space (SS) are seen. The immunogold particles located on the plasma membranes are indicated by arrows. (Bar, 1 μm.)
Distribution of the DP-Expressing LM Cells in the Ventral Surface of the Basal Forebrain.
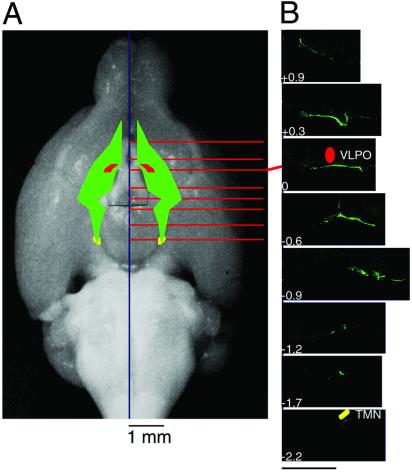
The DP-concentrated region in the ventral surface of the basal forebrain is schematically presented in Fig. 4A with emphasis on its topological relation with the ventrolateral preoptic area, one of the putative sleep centers (28), and tuberomammillary nucleus, one of the putative wake centers (5, 29). Among the more than 700 serial coronal sections used for the reconstruction, typical immunofluorescence-positive images are given in Fig. 4B. All other areas were almost completely negative, clearly indicating that the DPs were localized solely in this area. The DP-concentrated region began rostrally where a moderate level of immunoreactivity was noted between 0.3 and 0.7 mm lateral to the midline at the level 0.9 mm rostral to the bregma, and a high level of it was restricted to the site in contact with the optic nerves. The main portion of the region with the highest immunoreactivity was located from 0.3 mm rostral to 0.9 mm caudal to the bregma. It was located between 0.3 and 1.0 mm lateral to the midline at the level 0.3 mm rostral to the bregma and between 0.7 and 1.6 mm lateral to the midline at the level 0.6 mm caudal to the bregma. This main portion completely covered the basal aspect of the ventrolateral preoptic area. The caudal portion of the region with diminishing immunoreactivity separated from the optic tract at the position 0.9 mm caudal to the bregma ran caudally and medially and ended 2.2 mm caudal to the bregma, reaching the basal aspect of the tuberomammillary nucleus. Therefore, the rostral and main portions of the DP-concentrated region were associated with the visual pathway composed of the optic nerves, optic chiasm, and optic tracts.
Figure 4.
Schematic representation of the location of DP reconstructed from serial coronal sections. (A) The DP-concentrated region in the ventral surface of the basal forebrain is schematically represented by the green color with emphasis on its topological relation with the ventrolateral preoptic area (VLPO, red) and tuberomammillary nucleus (TMN, yellow). (B) Typical coronal sections are shown in rostral and caudal directions from bregma. The values represent the distance from bregma (mm). (Bar, 800 μm.)
Quantification of mRNAs for DP and PGDS in the LM.
When the amounts of mRNAs for DP, PGDS, and GAPDH were determined in six brain areas by quantitative reverse transcription–PCR (Table 1), the relative expression level of DP mRNA was the highest in the LM of the rostral basal forebrain (0.120), low in the LM of the medulla oblongata (0.041), and very low in the cortex with the LM, isolated choroid plexus, and gray and white matter. On the other hand, the relative expression level of PGDS mRNA was the same in the LM between the rostral basal forebrain and medulla oblongata (approximately 310). The expression level of PGDS mRNA in the LM of the rostral basal forebrain was ≈50-fold to 240-fold higher than those levels in the neocortex, choroid plexus, gray matter, and white matter. These results are in good agreement with the immunohistochemical distributions of DP and PGDS (Fig. 2).
Contribution of DP to PGD2-Induced Sleep.
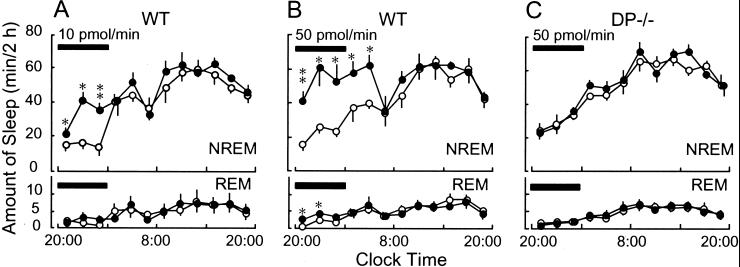
To clarify the involvement of DP in PGD2-induced sleep, we infused PGD2 into the lateral ventricle of WT and DP−/− mice at flow rates of 10 and 50 pmol/min for 6 h starting from 8 p.m. and determined the amounts of NREM and REM sleep (Fig. 5). In WT mice, the PGD2 infusion at a flow rate of 10 pmol/min significantly increased NREM sleep even 2 h after the start of the infusion. The total amount of NREM sleep during the infusion (99.0 ± 3.6 min/6 h) was about 2-fold higher than that of the base-line day (45.9 ± 9.2 min/6 h; P < 0.001; Fig. 5A). A higher dose of PGD2 (50 pmol/min) induced a larger amount and more prolonged NREM sleep than the lower dose (Fig. 5B). NREM sleep increased to the maximum level observed during the day time from 4 h after starting the infusion to 4 h after ending it. The total amount of NREM sleep for 10 h after starting the infusion (272.2 ± 35.9 min) was about 2-fold higher than that of the base-line day (145.3 ± 14.9 min; P < 0.007). On the other hand, REM sleep increased during the PGD2 infusion only with 50 pmol/min (P < 0.02) from 4.8 ± 0.9 min to 10.6 ± 1.4 min for 6 h. In marked contrast, in DP−/− mice, the amount of neither NREM nor REM sleep was changed at all by the PGD2 infusion even at a flow rate of 50 pmol/min (Fig. 5C). These results clearly demonstrate that PGD2 predominantly increased NREM sleep in WT mice and that DPs are crucially involved in the PGD2-induced NREM sleep.
Figure 5.
Effect of PGD2 infusion on sleep induction in WT and DP−/− mice. Vehicle (○) or PGD2 (10 and 50 pmol/min, ●) was infused for 6 h (black bars) into the lateral ventricle of the brain in WT (A and B) and DP−/− (C) mice. The values (means ± SEM, n = ≈5–6) were calculated as the amount of sleep for every 2 h. *, P < 0.05; **, P < 0.01, compared with the vehicle group.
DP-Mediated Increase in Extracellular Adenosine Level of Subarachnoid Space of Basal Forebrain.
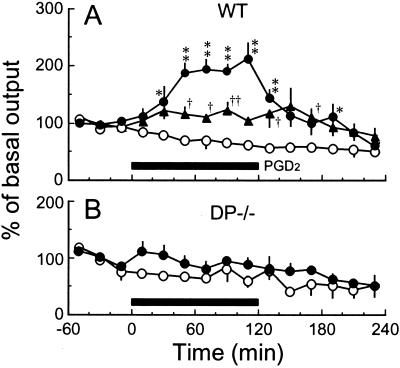
Finally, we determined the extracellular adenosine level in the subarachnoid space of the basal forebrain, the DP-enriched zone, of WT and DP−/− mice after PGD2 perfusion through a microdialysis probe (Fig. 6). In the WT mice, the adenosine level increased to the maximum level ≈1.2-fold and 2-fold higher than the basal level about 1 h after PGD2 perfusion at flow rates of 100 and 400 pmol/min, respectively (Fig. 6A). However, the adenosine level was not increased in DP−/− mice after the PGD2 perfusion (Fig. 6B) or in either WT or DP−/− mice after the vehicle perfusion (Fig. 6). These results indicate that the activation of DPs in the arachnoid trabecular cells of the basal forebrain triggered the local increase in the extracellular adenosine level.
Figure 6.
Effect of PGD2 perfusion on the extracellular adenosine level in the subarachnoid space below the rostral basal forebrain of WT and DP−/− mice. Vehicle (○) or PGD2 (100 pmol/min, ▴; 400 pmol/min, ●) was perfused for 2 h (black bar) into the subarachnoid space below the rostral basal forebrain of WT (A) and DP−/− (B) mice under anesthesia. The basal level of adenosine during 1 h before the PGD2 perfusion was 0.46 ± 0.04 pmol/20 μl in WT mice and 0.24 ± 0.04 pmol/20 μl in DP−/− mice. The data are expressed as a percentage of the base-line value (mean ± SEM, n = ≈5–8). *, †, P < 0.05; **, ††, P < 0.01, compared with the vehicle group.
Discussion
This study reports the localization of DP in the brain as visualized with antibody highly specific for DP (Fig. 1). We show that the DPs were almost exclusively located in a subpopulation of arachnoid trabecular cells of the basal forebrain of mice by confocal double immunofluorescence histochemistry (Figs. 2 and 4), immunoelectron microscopy with the DP antibody (Fig. 3), and reverse transcription–PCR (Table 1). In contrast, PGDS was widely distributed in the LM cells of the entire brain and choroid plexus (Fig. 2 and Table 1), as previously reported to be the case in rats, monkeys, and humans (7). The DP-expressing LM cells were also positive for PGDS (Fig. 2), indicating that PGD2 acts as an autocrine/paracrine agent, although PGD2 produced in other parts of the brain may also be active in promoting sleep. A subpopulation of LM cells producing PGD2 may differentiate into the DP-expressing LM cells in the vicinity of the target neurons and participate in the signal conversion from PGD2 to the secondary transmitter, adenosine, acting on the targets.
In the DP-expressing LM cells, the majority of the receptors were located on the plasma membranes, with about 25% being on the intracellular membranes (Fig. 3). Receptors on intracellular membranes are generally regarded to be either in the process of being transported to the plasma membrane or to have come from the plasma membrane via endocytosis. In either case, these results indicate that the turnover of DP is active in the arachnoid trabecular cells of the basal forebrain. The region with the highest DP-immunoreactive LM cells in the mice was located between 0.9 mm rostral and 0.9 mm caudal to the bregma (Fig. 4), whereas the site most effective in promoting sleep by PGD2 infusion in rats was between 0.5 and 2 mm rostral to the bregma (2). This distribution difference may be because of the different animal species. Alternatively, it might be because of the flow of the CSF. For example, if CSF is assumed to circulate in a rostrocaudal direction, PGD2 administered by the microdialysis probe would diffuse in the caudal direction in the subarachnoid space to function as the somnogenic agent.
PGD2 infusion into the lateral ventricle of WT mice increased preferentially NREM sleep rather than REM sleep (Fig. 5 A and B). The PGD2 infusion at a higher dose (50 pmol/min) increased NREM sleep of WT mice to the maximum sleep level during the day time (≈60 min/2 h) but did not induce rebound wakefulness observed after the cessation of the infusion. These results are in good agreement with our previous findings that NREM sleep was selectively induced by PGD2 infusion into the subarachnoid space of the rat basal forebrain (2) and that the rebound wakefulness was not observed after induction of an excess NREM sleep by PGD2 infusion for 36 h (30). Therefore, we consider PGD2 is potentially useful for the development of a somnogenic drug without side effects such as weak rebound of wakefulness.
In the DP−/− mice, the amount of NREM sleep did not increase after PGD2 infusion into the brain (Fig. 5C), and the extracellular adenosine level was also unchanged in the subarachnoid space of the basal forebrain (Fig. 6). Therefore, the DP-expressing cells are considered to be important for the production and release of adenosine into the subarachnoid space of the rostral basal forebrain after PGD2 infusion to induce NREM sleep. However, the base-line sleep–wake patterns were essentially identical between WT and DP−/− mice. Therefore, the DP-mediated system may not be crucial for basal sleep–wake regulation. Alternatively, the deficiency of the DP-mediated system may be efficiently compensated by some other system(s) involved in the regulation of basal sleep. Recently, we found that DP−/− mice exhibited remarkably weak rebound of NREM sleep after sleep deprivation, as compared with WT mice (N.E., Y.U., and O.H., unpublished results). Therefore, we hypothesize that endogenous PGD2 is involved in the homeostatic regulation of NREM sleep.
Quite recently, another type of DP, CRTH2, was discovered in the T helper type 2 cells, eosinophils, and basophils in humans and mice (31). CRTH2 is involved in the chemotactic activity of PGD2 toward these cells and is also expressed in the mouse brain (32). However, the expression level of CRTH2 mRNA in the brain was essentially unchanged between WT and DP−/− mice (data not shown). Therefore, CRTH2 is considered not to contribute to the PGD2-induced sleep and the adenosine release.
Acknowledgments
We are grateful to Dr. A. Borbély, Dr. C. B. Saper, Dr. N. Mizuno, and Dr. K. Kitahama for comments during the preparation of this manuscript. We thank Dr. M. Tafti, University of Geneva, for helpful advice concerning the infusion technique used; we also thank K. Okamoto and Y. Kuwahata of the Core Research for Evolutional Science and Technology, Japan Science and Technology Corporation and T. Okada, N. Uodome, and S. Matsumoto of Osaka Bioscience Institute for technical assistance. We are also grateful to Prof. S. Kawaguchi, Kyoto University, for his generous contribution to the histological study. This study was supported by research grants from the Ministry of Health and Welfare of Japan (to A.M. and O.H.), the Special Funds for Promoting Brain Science and Technology (to A.M.), the Special Coordination Funds for Promoting Science and Technology from the Science and Technology Agency of the Japanese Government (Grant 13557016 to N.E and Grant 12558078 to Y.U.), Suntory Institute for Bioorganic Research (to N.E.), the Takeda Science Foundation (to N.E.), the Yamanouchi Foundation for Research on Metabolic Disorders (to N.E.), and ONO Medical Research Foundation (to N.E.) and Osaka City.
Abbreviations
- PG
prostaglandin
- PGDS
PGD synthase
- LM
leptomeninges
- CSF
cerebrospinal fluid
- NREM
non-rapid eye movement
- REM
rapid eye movement
- DP
PGD receptor
- EP
prostaglandin E receptor
- WT
wild type
- EEG
electroencephalogram
- EMG
electromyogram
- CHO
Chinese hamster ovary
- GAPDH
glyceraldehyde-3-phosphate dehydrogenase
References
- 1.Hayaishi O. Philos Trans R Soc London B. 2000;355:275–280. doi: 10.1098/rstb.2000.0564. [DOI] [PMC free article] [PubMed] [Google Scholar]
- 2.Matsumura H, Nakajima T, Osaka T, Satoh S, Kawase K, Kubo E, Sri Kantha S, Kasahara K, Hayaishi O. Proc Natl Acad Sci USA. 1994;91:11998–12002. doi: 10.1073/pnas.91.25.11998. [DOI] [PMC free article] [PubMed] [Google Scholar]
- 3.Satoh S, Matsumura H, Suzuki F, Hayaishi O. Proc Natl Acad Sci USA. 1996;91:5980–5984. doi: 10.1073/pnas.93.12.5980. [DOI] [PMC free article] [PubMed] [Google Scholar]
- 4.Satoh S, Matsumura H, Hayaishi O. Eur J Pharmacol. 1998;351:155–162. doi: 10.1016/s0014-2999(98)00302-1. [DOI] [PubMed] [Google Scholar]
- 5.Scammell T, Gerashchenko D, Urade Y, Onoe H, Saper C, Hayaishi O. Proc Natl Acad Sci USA. 1998;95:7754–7759. doi: 10.1073/pnas.95.13.7754. [DOI] [PMC free article] [PubMed] [Google Scholar]
- 6.Beuckmann C T, Lazarus M, Gerashchenko D, Mizoguchi A, Nomura S, Mohri I, Uesugi A, Kaneko T, Mizuno N, Hayaishi O, et al. J Comp Neurol. 2000;428:62–78. doi: 10.1002/1096-9861(20001204)428:1<62::aid-cne6>3.0.co;2-e. [DOI] [PubMed] [Google Scholar]
- 7.Urade Y, Hayaishi O. Biochim Biophys Acta. 2000;1482:259–271. doi: 10.1016/s0167-4838(00)00161-8. [DOI] [PubMed] [Google Scholar]
- 8.Pinzar E, Kanaoka Y, Inui T, Eguchi N, Urade Y, Hayaishi O. Proc Natl Acad Sci USA. 2000;97:4903–4907. doi: 10.1073/pnas.090093997. . (First Published April 18, 2000; 10.1073/pnas.090093997) [DOI] [PMC free article] [PubMed] [Google Scholar]
- 9.Hirata M, Kakizuka A, Aizawa M, Ushikubi F, Narumiya S. Proc Natl Acad Sci USA. 1994;91:11192–11196. doi: 10.1073/pnas.91.23.11192. [DOI] [PMC free article] [PubMed] [Google Scholar]
- 10.Oida H, Hirata M, Sugimoto Y, Ushikubi F, Ohishi H, Mizuno N, Ichikawa A, Narumiya S. FEBS Lett. 1997;417:53–56. doi: 10.1016/s0014-5793(97)01253-2. [DOI] [PubMed] [Google Scholar]
- 11.Gerashchenko D Y, Beuckmann C T, Kanaoka Y, Eguchi N, Gordon W C, Urade Y, Bazan N G, Hayaishi O. J Neurochem. 1998;71:937–945. doi: 10.1046/j.1471-4159.1998.71030937.x. [DOI] [PubMed] [Google Scholar]
- 12.Matsuoka T, Hirata M, Tanaka H, Takahashi Y, Murata T, Kabashima K, Sugimoto Y, Kobayashi T, Ushikubi F, Aze Y, et al. Science. 2000;287:2013–2017. doi: 10.1126/science.287.5460.2013. [DOI] [PubMed] [Google Scholar]
- 13.Watabe A, Sugimoto Y, Honda A, Irie A, Namba T, Negishi M, Ito S, Narumiya S, Ichikawa A. J Biol Chem. 1993;268:20175–20178. [PubMed] [Google Scholar]
- 14.Katsuyama M, Nishigaki N, Sugimoto Y, Morimoto K, Negishi M, Narumiya S, Ichikawa A. FEBS Lett. 1995;372:151–156. doi: 10.1016/0014-5793(95)00966-d. [DOI] [PubMed] [Google Scholar]
- 15.Sugimoto Y, Namba T, Honda A, Hayashi Y, Negishi M, Ichikawa A, Narumiya S. J Biol Chem. 1992;267:6463–6466. [PubMed] [Google Scholar]
- 16.Honda A, Sugimoto Y, Namba T, Watabe A, Irie A, Negishi M, Narumiya S, Ichikawa A. J Biol Chem. 1993;268:7759–7762. [PubMed] [Google Scholar]
- 17.Namba T, Oida H, Sugimoto Y, Kakizuka A, Negishi M, Ichikawa A, Narumiya S. J Biol Chem. 1994;269:9986–9992. [PubMed] [Google Scholar]
- 18.Namba T, Sugimoto Y, Hirata M, Hayashi Y, Honda A, Watabe A, Negishi M, Ichikawa A, Narumiya S. Biochem Biophys Res Commun. 1992;184:1197–1203. doi: 10.1016/s0006-291x(05)80009-9. [DOI] [PubMed] [Google Scholar]
- 19.Sugimoto Y, Hasumoto K, Namba T, Irie A, Katsuyama M, Negishi M, Kakizuka A, Narumiya S, Ichikawa A. J Biol Chem. 1994;269:1356–1360. [PubMed] [Google Scholar]
- 20.Mandai K, Nakanishi H, Satoh A, Obaishi H, Wada M, Nishioka H, Ito M, Mizoguchi A, Aoki T, Fujimoto T, et al. J Cell Biol. 1997;139:517–528. doi: 10.1083/jcb.139.2.517. [DOI] [PMC free article] [PubMed] [Google Scholar]
- 21.Mizoguchi A, Yano Y, Hamaguchi H, Yanagida H, Ide C, Zahraoui A, Shirataki H, Sasaki T, Takai Y. Biochem Biophys Res Commun. 1994;202:1235–1243. doi: 10.1006/bbrc.1994.2063. [DOI] [PubMed] [Google Scholar]
- 22.Chomczynski P, Sacchi N. Anal Biochem. 1987;162:156–159. doi: 10.1006/abio.1987.9999. [DOI] [PubMed] [Google Scholar]
- 23.Franklin K B J, Paxinos G. The Mouse Brain in Stereotaxic Coordinates. San Diego: Academic; 1997. [Google Scholar]
- 24.Pedata F, Pazzagli M B J, Tilli S, Pepeu G. Naunyn-Schmiedeberg's Arch Pharmacol. 1990;342:447–453. doi: 10.1007/BF00169463. [DOI] [PubMed] [Google Scholar]
- 25.Huang Z L, Qu W M, Li W D, Mochizuki T, Eguchi N, Watanabe T, Urade Y, Hayaishi O. Proc Natl Acad Sci USA. 2001;98:9965–9970. doi: 10.1073/pnas.181330998. . (First Published August 7, 2001; 10.1073/pnas.181330998) [DOI] [PMC free article] [PubMed] [Google Scholar]
- 26.Tobler I, Deboer T, Fischer M. J Neurosci. 1997;17:1869–1879. doi: 10.1523/JNEUROSCI.17-05-01869.1997. [DOI] [PMC free article] [PubMed] [Google Scholar]
- 27.Peters A, Palay S L, Webster H. The Fine Structure of the Nervous System: The Neurons and Their Supporting Cells. Philadelphia: Saunders; 1976. [Google Scholar]
- 28.Sherin J, E, Shiromani P J, McCarley R W, Saper C B. Science. 1996;271:216–219. doi: 10.1126/science.271.5246.216. [DOI] [PubMed] [Google Scholar]
- 29.Sherin J E, Elmquist J K, Torrealba F, Saper C B. J Neurosci. 1998;18:4705–4721. doi: 10.1523/JNEUROSCI.18-12-04705.1998. [DOI] [PMC free article] [PubMed] [Google Scholar]
- 30.Gerashchenko D, Okano Y, Urade Y, Inoue S, Hayaishi O. J Sleep Res. 2000;9:81–87. doi: 10.1046/j.1365-2869.2000.00175.x. [DOI] [PubMed] [Google Scholar]
- 31.Hirai H, Tanaka K, Yoshie O, Ogawa K, Kenmotsu K, Takamori Y, Ichimasa K, Sugamura K, Nakamura M, Takano S, et al. J Exp Med. 2001;193:255–261. doi: 10.1084/jem.193.2.255. [DOI] [PMC free article] [PubMed] [Google Scholar]
- 32.Abe H, Takeshita T, Nagata K, Arita T, Endo Y, Fujita T, Takayama H, Kubo M, Sugamura K. Gene. 1999;227:71–77. doi: 10.1016/s0378-1119(98)00599-x. [DOI] [PubMed] [Google Scholar]


