Abstract
Background
Treatment of cardiac arrhythmias often involves ablating viable muscle tissue within or near islands of scarred myocardium. Yet, today there are limited means by which the boundaries of such scars can be visualized during surgery and distinguished from the sites of acute injury caused by radiofrequency (RF) ablation.
Objective
We sought to explore a hyperspectral imaging (HSI) methodology to delineate and distinguish scar tissue from tissue injury caused by RF ablation.
Methods
RF ablation of the ventricular surface of thoracotomized live rats was followed by a two-month animal recovery period. During a second surgery, new RF lesions were placed next to the scarred tissue from the previous ablation procedure. Myocardial infarction model was used as an alternative way to create scar tissue.
Results
Excitation-emission matrices acquired from the sites of RF lesions, scar region, and the surrounding unablated tissue revealed multiple spectral changes. These findings justified HSI of heart surface using illumination with 365nm ultraviolet light while acquiring spectral images from visible range. Autofluorescence-based HSI enabled to distinguish sites of RF lesions from scar or unablated myocardium in open chest rats. A pilot version of a percutaneous HSI catheter was used to demonstrate the feasibility of RF lesion visualization in atrial tissue of live pigs.
Conclusions
Hyperspectral imaging based on changes in tissue autofluorescence is a highly effective tool for revealing, in vivo and with high spatial resolution, surface boundaries of a myocardial scar and discriminating it from areas of acute necrosis caused by RF ablation.
Keywords: hyperspectral imaging, ablation, scar, myocardium
INTRODUCTION
To eliminate arrhythmogenic activity associated with scars, new rounds of tissue ablation often need to be performed. To achieve a more precise targeting of arrhythmogenic sources and pathways, it can be extremely helpful to visualize scar boundaries and any isthmuses of viable tissue within the scar while doing the next round of ablation procedures. A number of approaches are currently being developed to address this need, including several noninvasive techniques that help to identify scar transmurality1,2. Yet, as of today, these approaches require additional surgery time and the injection of contrast agents and offer a relatively low spatial resolution. The latter is the major limitation because viability gaps of less than 1mm have been shown to conduct aberrant beats, leading to recurrent tachycardia and fibrillation3.
One way to achieve high spatial resolution imaging is via direct visual observation of scarred tissue surface. With this goal in mind, several groups, including ours, have been developing percutaneous cardiac visualization catheters4–6. Availability of such catheters further suggests that more advanced methods of acquiring and analyzing the returning light can provide a wealth of additional information about the ventricular and atrial surfaces to be treated, being them endo or epicardial. This was the main premise of our study. Specifically, we explored autofluorescence hyperspectral imaging (HSI) to help identify myocardial scar tissue and distinguish it from radiofrequency (RF) ablation sites. HSI spatial resolution highly depends on optical parts involved, but theoretically it can be 2–3 orders of magnitude more precise than the current cardiac imaging techniques7.
METHODS
Animal Surgery
Ablations were performed in 2-month-old adult Sprague-Dawley rats (200–300g) of mixed sexes. A thoracotomy was performed to expose the heart, followed by an RF ablation on the epicardium of exposed ventricles. After the animals underwent two months of recovery, a second round of RF ablation was performed using the same anesthesia protocol. Alternatively, to create scar tissue by myocardial infarction, one of left coronary artery branches was permanently ligated, followed by two months of animal recovery. On the final day of the protocol the hearts were removed, perfused with saline, and used for either ex-vivo HSI or spectral analysis. Alternatively, HSI of exposed heart surfaces was performed in live, blood-perfused animals (to avoid motion artifacts heart rate was slowed to 0.2 Hz by immersing animal into ice bath). All studies conformed to the Guide for the Care and Use of Laboratory Animals and were approved by the Institutional Animal Use and Care Committee. Testing of percutaneous HSI catheter in live pigs was conducted at a fully certified and accredited animal testing facility (Synchrony Labs, Durham, NC).
Excitation-Emission Matrix Recordings
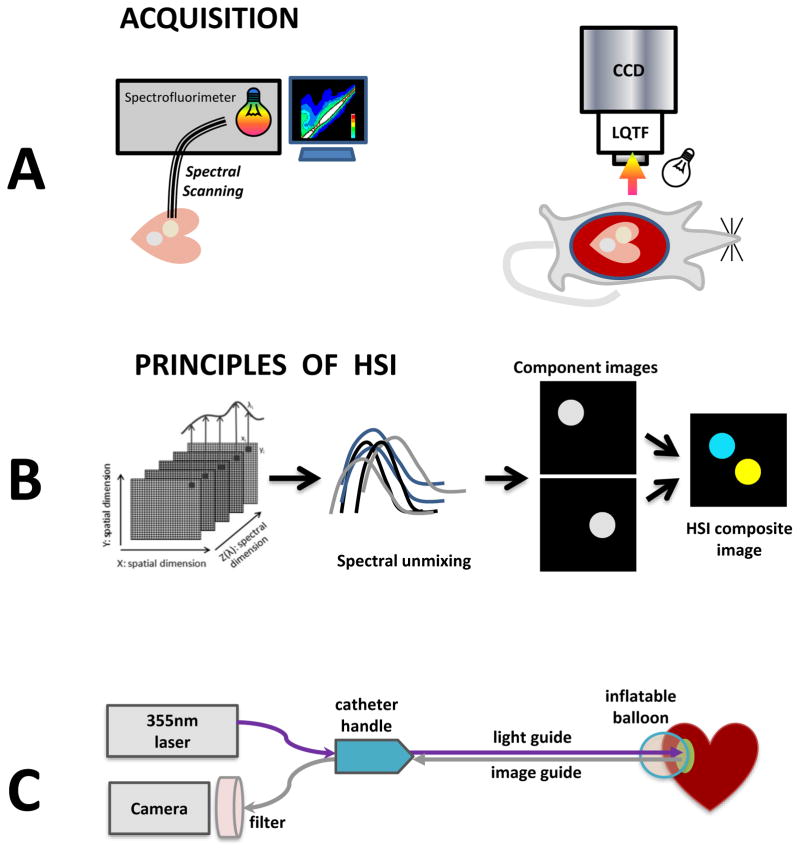
A dual fiberoptic guide connected to a spectrofluorometer (HORIBA Jobin Yvon FluoroMax-3) was placed at specified sites of the epicardial surface of the excised, saline-perfused rat ventricles (Fig. 1A, left). The fiber has a 2mm opening at the end, allowing it to deliver excitation light to the sample and collect emitted and reflected light back to the detector. To create an excitation-emission matrix (EEM), each site of interest was sequentially illuminated by the specified wavelength while recording returning light spectra. Due to time involved in EEM acquisition, experiments were conducted in saline-perfused excised hearts to avoid running into contraction artifacts, blood coagulation, and animal loss.
Fig. 1. Cartoons of main protocols.
A. Imaging setup for obtaining EEMs or HSI images in blood-free and blood-perfused rat hearts.
B. Principles involved in HSI spectral unmixing.
C. Conceptual drawing of an HSI-based percutaneous catheter.
Hyperspectral Imaging Protocol
Hypercubes containing wavelengths ranging from 420 to 720nm were collected using a Nuance FX HSI system (PerkinElmer/Cri, Waltham, MA) fitted with a Nikon AF Micro-Nikkor 60mm f/2.8D lens. A 4x3cm field of view was captured at 1392x1040 pixels, yielding a 30micron/pixel spatial resolution. The LED light source (either 365nm or 4000K warm white - both from Mightex, Pleasanton, CA) were oriented ~5–8cm from the tissue surface (Fig. 1A, right). A region-of-interest (ROI) based selection, followed by the Nuance FX spectral unmixing algorithm, was applied to extract lesion component images from each hypercube as previously described8,9. Placing ROIs at different random locations within the lesion did not significantly change the outcome of spectral unmixing (Appendix, Fig. A). Component images corresponding to scar, RF-ablated or unablated tissue were then combined to form pseudocolor HSI composite image (Fig. 1B).
Percutaneous HSI catheter
A proof-of-concept version of HSI catheter (Fig. 1C) was put together using major elements of an autofluorescence imaging catheter previously reported in abstract form6,10,11. It encompasses a steerable handle, illumination and imaging ports. A saline infusion port is used to inflate a urethane balloon for blood displacement. Image guide includes 17000 individual 4-um optical fibers and can be directly coupled to the Nuance FX HSI system.
Histopathology
Immediately after the experiment, hearts were Langendorff-perfused with a Tyrode’s solution containing 40mM Triphenyl tetrazolium chloride (TTC) and then submerged in a TTC solution for an additional 15 minutes. To confirm the presence of collagen deposition at the ablation sites, the heart was fixed, sliced transmurally across the lesions and stained with Masson’s trichrome stain.
Statistical Analysis
Values are presented as mean ± SD unless stated otherwise. One-way ANOVA was performed on normalized fluorescence values for each wavelength. P-values where determined using Tukey posthoc test at 95% significance levels. Pearson correlation coefficient was used to compare shapes of difference spectra.
RESULTS
Visual appearance of RF lesions and scar tissue under broadband and ultraviolet illumination
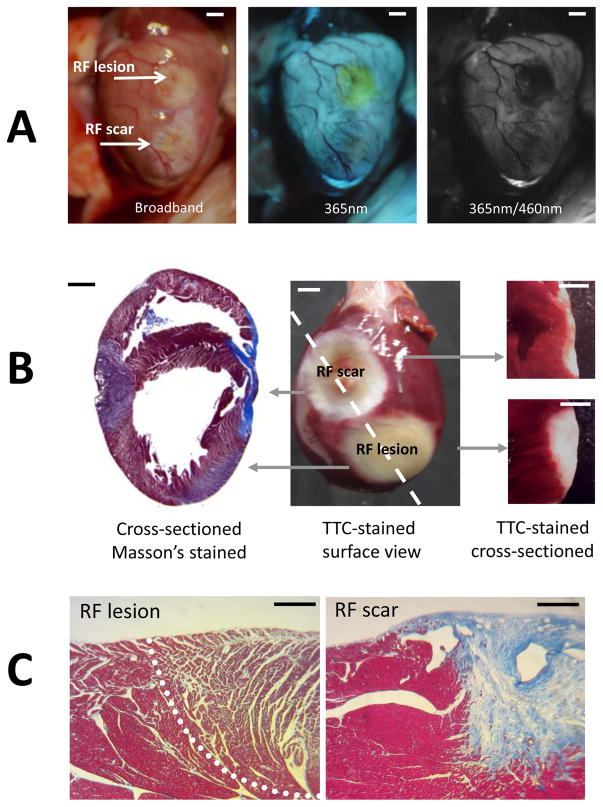
When illuminated with white light within an open chest of a live animal, scar sites and RF lesions appear as blanched, pale regions of tissue (Fig. 2A, left). When the same tissue was illuminated with UV light, RF lesions had a distinct yellow hue, while the scar tissue was nearly undistinguishable from unablated tissue (Fig. 2A, middle). When the acquisition settings were changed to correspond to excitation and emission maxima of endogenous NADH (365nm/460nm), the RF lesions showed up as black holes (Fig. 2A) due to the dramatic drop in NADH fluorescence as per previous findings by us and others12,13. Under 365nm/460nm excitation-emission settings, the scar tissue exhibited a highly variable appearance ranging from being intensely bright to being undistinguishable from surrounding muscle autofluorescence. Layers of deposited collagen at the scar sites were readily verified by Masson’s trichrome staining in histology slides. Both scar and RF lesions were void of TTC staining when observed at the surface or when cross-sectioned (Fig. 2B).
Fig. 2. In-vivo appearance of lesions and associated pathology.
A. Appearance of a blood-perfused rat heart with a RF lesion and a scar from a previous ablation under specified illumination/acquisition settings. Scale bars 2mm.
B. Typical staining outcomes for a heart with an RF lesion and a scar from a previous RF procedure. Left: heart cross-section stained with Masson’s trichrome stain. Middle: the appearance of both lesions on the ventricular surface after TTC-staining. Right: cross-sections showing the depth of both lesions. Scale bars 2mm
C. Histological appearance of an RF lesion (demarcated by a dashed line) and the scar site from a previous ablation procedure. Scale bars 0.2mm
Excitation-Emission Matrices (EEMs) from RF ablation and scar sites
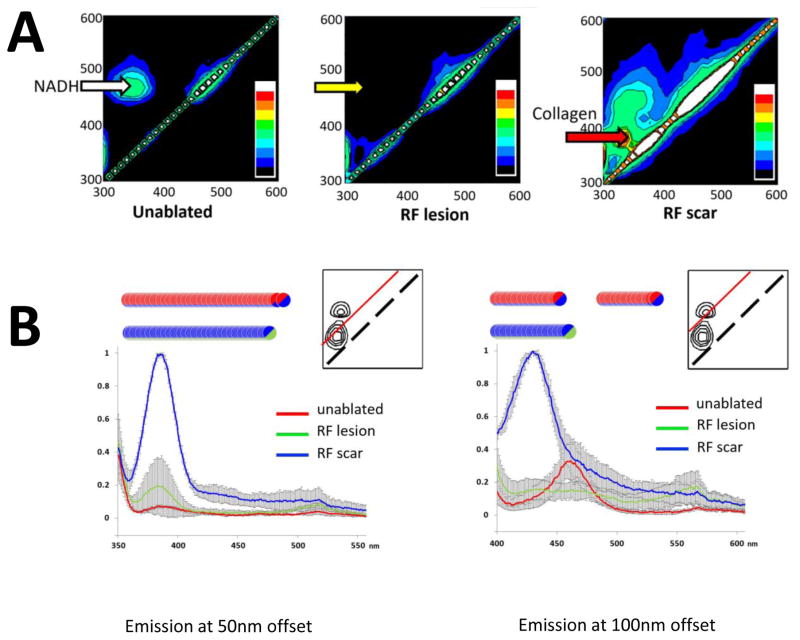
To better understand spectral ranges that can distinguish all three conditions, we acquired excitation-emission matrices (EEM) from corresponding sites. Each EEM consists of hundreds of individual measurements at different excitation and emission wavelengths which are compiled into a 2D color map. The EEMs showed multiple spectral changes in the autofluorescence and reflectance profiles (Fig. 3A). The major change was an expected drop in NADH-associated autofluorescence at RF ablation sites, which is represented by the disappearance of NADH peak at ~350/465nm (yellow arrow). Collagen deposited at the scar sites appeared as a distinct new peak in the autofluorescence profile (red arrow). Its coordinates were different from those of the endogenous NADH fluorescence peak of viable muscle. The diffuse reflectance profile, represented by the diagonal line on the EEMs, increased at the RF ablation and scar sites, confirming previous findings by us and others12,14.
Fig 3. Excitation-Emission Matrices for unablated myocardium, an RF lesion, and scar tissue.
A. Left: EEM from a healthy, unablated myocardium with a prominent NADH peak at 360/460nm. Middle: EEM from an RF lesion demonstrating the loss of the NADH and a moderate increase in diffuse reflectance (i.e., intensity of diagonal line). Right: EEM from scar site showing collagen fluorescence peak and a marked increase in diffuse reflectance. Shown EEM set is a representative from four independent experiments. The color bar depicts the relative intensity of the signal.
B. Emission intensity profiles acquired with 50 and 100nm offsets from the excitation wavelength (n=3). The red line within the inserts shows the location of such spectral profile within the EEM space. The inserts also show the locations of collagen and NADH peaks (solid black lines). Circles indicate statistical difference between the two tissue states indicated by corresponding color.
Major spectral differences revealed by EEMs were confirmed and compared by acquiring profiles of emission intensity with 50 and 100nm offsets from the excitation wavelength (Fig. 3B). Most revealing was the quantitative outcome of spectral scanning using a 100nm offset (Fig. 3B, right). Traces from RF lesions (shown in green) reveal a dramatic loss of NADH fluorescence as compared to unablated tissue (red). On the other hand, the intensity of the collagen peak from scar tissue (blue) shows about equal intensity with the NADH peak collected from unablated tissue. This explains why autofluorescence from collagen deposition can compensate for lack of NADH signal in the scar tissue, rendering is undistinguishable from surrounding unablated tissue.
Choice of HSI modality
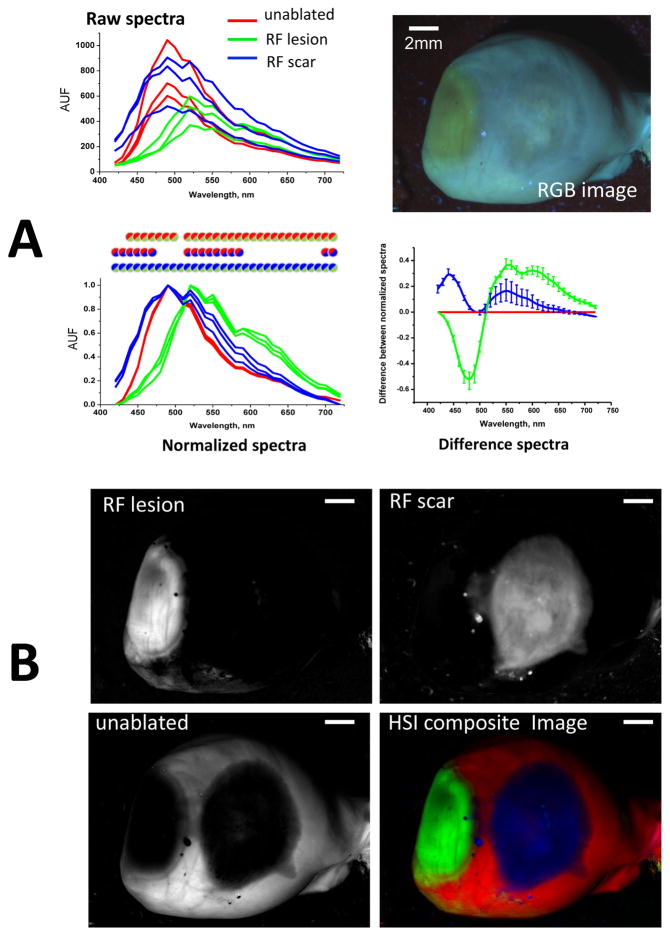
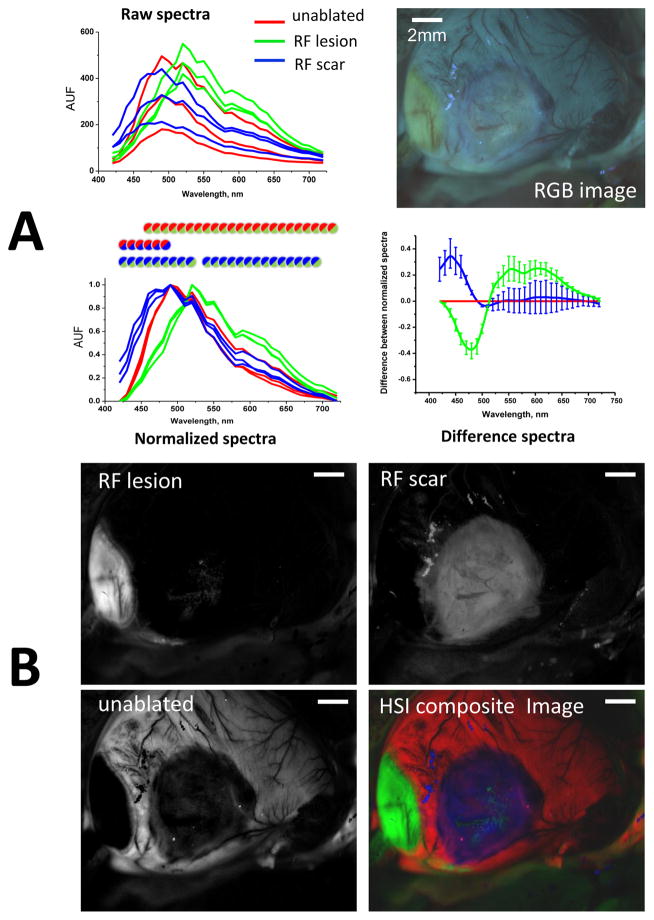
The spectral differences identified by EEMs suggested that two different HSI modalities can help differentiate RF lesions from scar tissue. The first one involves illumination with broadband white light while acquiring within the visible range. The second modality involves tissue illumination with a UV source while collecting light across the visible range (Appendix, Fig. B). A side-by-side visual comparison of unmixing outcomes of the two modalities using six different hearts suggested that the second modality (thereafter called autofluorescence-HSI) provides better classification outcomes between the three tissue conditions. Figure 4 illustrates how it works: the raw traces extracted from different ROIs of the HSI hypercube have varied shapes and amplitudes. Yet when they are normalized, the spectra from pixels located within RF lesions (green traces) becomes distinct in shape from those located on unablated tissue (red traces) or scar sites (blue traces). To better illustrate these spectral divergences, the same data can be displayed as a difference plot between normalized intensity values versus that of unablated tissue. The differences between normalized spectra from autofluorescence-based HSI hypercubes were significant within extended spectral ranges. Specifically, for pixels from scar areas, there is a significant increase at the 420–460nm range that can be attributed to collagen accumulation. For pixels derived from RF lesions, the intensity drops within a 420–500nm range indicating the loss of NADH, while the contribution from 560–650nm wavelengths is significantly enhanced due to increased tissue scattering.
Fig. 4. Spectral changes underlying autofluorescence HSI of saline-perfused hearts.
A. Top: raw spectral traces from three regions-of-interest within unablated, ablated, and scar areas of a saline-perfused, UV-illuminated heart. Bottom: the same spectra but normalized between their respective minima and maxima (circles indicate statistical difference between the two tissue states as per corresponding color). The average differences between the normalized spectra as compared those of unablated tissue are shown on the right.
B. The three grayscale panels correspond to the HSI component images revealed by spectrally unmixing the HSI hypercube. The HSI composite image is shown using pseudocolor. Scale bars - 2mm.
Effect of blood on observed spectral differences
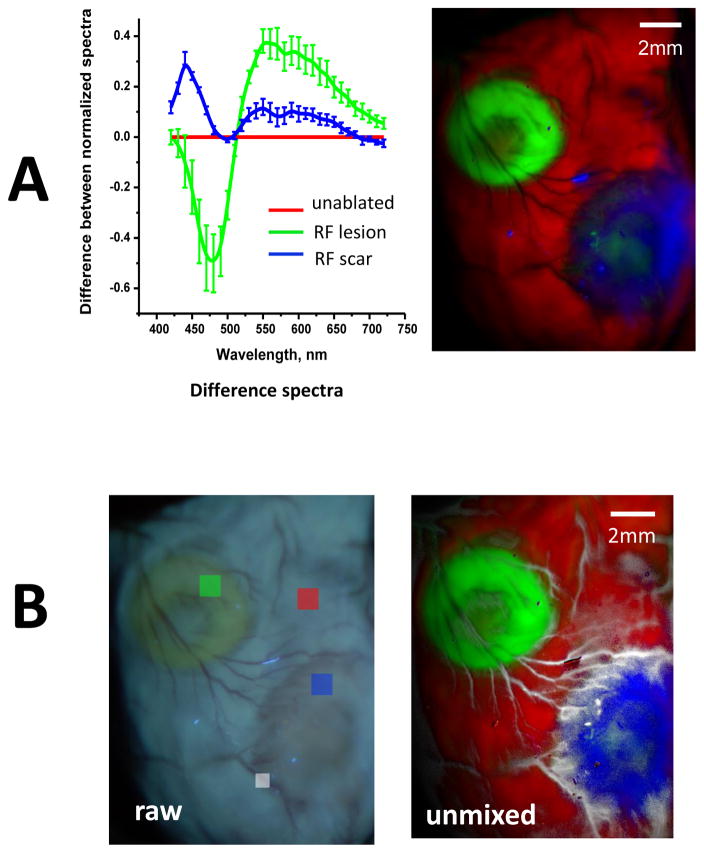
Data shown in Fig. 4 were obtained from excised, saline-perfused hearts. The next step was to confirm that similar spectral changes occur in vivo. This is shown in Fig. 5, which illustrates the results of autofluorescence HSI done in the same heart as shown in Fig. 4, but acquired while the heart was still within the chest of a live animal. When one compares traces between Figs. 4 and 5, it becomes evident that the presence of blood in microcirculation has minimal impact on normalized autofluorescence spectra. In fact, an HSI hypercube of a blood-perfused heart can be successfully unmixed using spectral profiles derived from an HSI hypercube acquired from a saline-perfused heart or vice versa. Even more importantly, the observed changes were highly consistent between the animals, therefore spectral library from one animal heart could successfully unmix HSI hypercube from another. Alternatively, spectra averaged from several different hearts unmixed the HSI hypercube of a new heart without prior knowledge of the target tissue type (Fig. 6A).
Fig 5. Spectral changes underlying autofluorescence-based HSI in blood-perfused hearts.
A. Top: raw and normalized spectral traces from three ROIs within unablated, ablated, or scar areas of a blood-perfused, in-vivo heart (circles indicate statistical difference between the two tissue states as per corresponding color). The HSI settings were identical to those used in the ex-vivo experiment shown in Fig.4. Bottom: the quantitative differences between the normalized spectra for acute lesions, scar and unablated tissue.
B. The three grayscale panels correspond to the HSI component images revealed by spectrally unmixing the HSI hypercube. The HSI composite image is shown using pseudocolor. Scale bars - 2mm.
Fig 6. Use of spectral libraries and additional features that can be extracted from autofluorescence-based HSI datasets.
A. Average spectral differences associated with RF lesions and scar tissue in blood-perfused hearts (n=6). The HSI composite image shows the outcome of spectral unmixing when the mean spectra from the six hearts were used as a spectral library to unmix an HSI hypercube of another blood-perfused heart without prior knowledge of the target tissue type.
B. An HSI hypercube contains information about other elements within the field of view that have unique spectral signatures. As an example, when an additional ROI was placed on a blood vessel (small white box), the HSI unmixing algorithm used its spectral profile to reveal areas of extensive vascularization around the scar (shown in white pseudocolor).
HSI can distinguish other features within the field of view
Analysis of spectral information contained within the HSI hypercubes offers a wealth of additional features that can be clinically relevant. Fig. 6B, for example, shows an image of the same heart as Fig. 6A but with an additional ROI placed on blood vessels. By including additional target spectra in the unmixing algorithm, a highly-vascularized scar boundary can be directly identified. In effect, visualization of any spectrally different targets within the field of view, whether endogenous (i.e., fat deposits, conductive fibers) or exogenous (i.e., sutures, patches, guidewires), can be greatly enhanced by the HSI.
Identification of scar tissue from myocardial infarction and visualization of atrial RF lesions in vivo
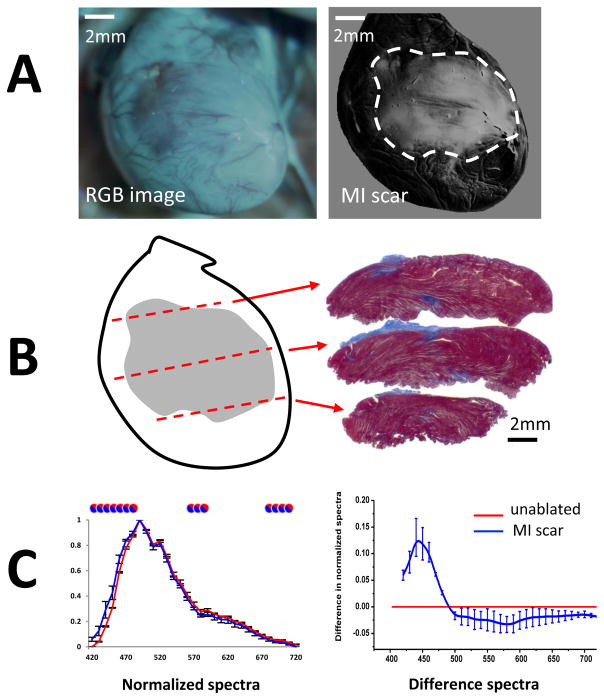
Lastly, we confirmed that similar spectral changes occur in the cases of i) myocardial infarction induced ventricular scar and ii) RF lesions made on the endocardial surface of atrial tissue. The first set of these proof-of-principle experiments was done by imaging blood-perfused hearts of live rats, each with a coronary ligation-induced ventricular scar (Fig. 7). Use of autofluorescence HSI successfully outlined scar boundaries with data being in good agreement with histology (Fig. 7B). The observed spectral differences were nearly identical to the ones we saw in hearts with scar tissue from healed RF ablations (R=0.96, p<0.001, blue difference curves in Figs. 5A&7C). Thus, scar regions in infarcted animal group can be identified using spectra from RF-induced scar rats and vice versa.
Fig 7. Autofluorescence HSI for in vivo visualization of scar tissue from myocardial infarction.
A. Left: an RGB image showing visual appearance of a scar on a left ventricular surface of a rat as it appears within the open chest of an animal under UV illumination. Right: HSI scar component image.
B. Left: an outline of an HSI-identified scar with dotted lines used to section the heart. Right: Corresponding sections stained with Masson’s blue.
C. Left: normalized spectra from control (red) and scar areas (blue) averaged from three different animals. Circles indicate statistical difference between the two tissue states. Right: The average spectral difference between normalized spectra of scar tissue as compared to unablated tissue (red line).
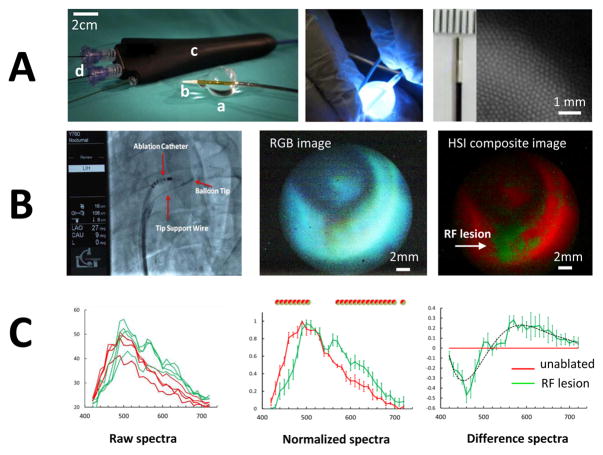
The second set of confirmatory experiments was conducted in live pigs using a pilot version of a custom made percutaneous HSI catheter (Figs. 1C&8A). Blood between image guide and atrial surface was displaced using a custom-made urethane balloon, followed by HSI acquisition. Spectral changes induced by RF ablation in blood perfused pig atria exhibited high correlation with observed changes in ablated ventricles of live rats (R=0.83, p<0.001, green difference curves in Figs. 5A&8C) and were consistent with our previous reports for excised human and porcine atrial tissue9,15.
Fig. 8. Proof-of principle HSI visualization of endocardial RF lesions in live pigs.
A. Left: percutaneous HSI catheter comprised of a custom shaped urethane balloon (a), an atraumatic soft radiopaque tip (b), catheter body (c), and a steerable handle. The catheter body includes several ports (d) allowing insertion of an illumination guide, an image guide, and adding saline for balloon inflation. Middle: illumination guide delivers light from 355nm argon laser to the tip of the catheter. Right: tip of the imaging guide and a closeup of an image produced by multiple 4-um optical fibers.
B. Left: catheter can be deployed in the vasculature through a 12Fr sheath placed in the femoral vein. Middle: RGB image of ablated atrial surface. Right: composite HSI image showing RF lesion in green, unablated tissue in red.
C. Raw (left), normalized (center) and difference (right) spectra from RF-ablated and intact porcine endocardial surface. Circles above normalized spectra indicate statistical difference between the two tissue states as per corresponding color.
DISCUSSION
The physiological assessment and visualization of myocardial scar tissue can be critically important for cardiac procedures such as the surgical treatment of ventricular and supraventricular arrhythmias1,16. The current non-invasive methods include different modalities of cardiac magnetic resonance imaging3,17, positron emission tomography1, and single photon emission computed tomography18. These methods are effective pre-surgery means to visualize the bulk of the scar within the myocardial wall. Yet they are poorly suitable for intraoperative surgical guidance, particularly when a direct, high-spatial resolution view of the cardiac surface is needed. Several minimally invasive, catheter-based methods are being developed to address this clinical need. They include intra-cardiac echocardiography19, OCT20,21, photoacoustic22 and polarization spectroscopy-based23 catheters. The optical approach explored in this study presents another novel technique that can be implemented using percutaneous access.
HSI can be implemented with minimally invasive tools and without a need for contrast agents since it relies on intrinsic changes in tissue absorption, scattering, and endogenous fluorescence. The latter has proven to be a particularly reliable index due to a marked loss of muscle NADH at the ablation sites and the following buildup of highly fluorescent collagen once the injured tissue heals24. Importantly, in addition to capturing changes in the NADH or collagen fluorescence (seen as a spectral drop and rise, respectively, within the 420–500nm range), autofluorescence HSI also detects changes in light scattering and absorption as these properties affect the travel path of emitted photons and the likelihood of their escape from tissue9. Decreased tissue absorption therefore explains, for example, the increased contribution of longer wavelengths to the spectra of RF lesions (seen as a rise in normalized spectra at wavelengths above 530nm).
Besides revealing the usefulness of autofluorescence HSI for scar identification, our experiments offered two noteworthy observations. The first was that the reflectance HSI was less effective in distinguishing between RF lesions and scar tissue. The likely reason behind this was the relatively nonselective increase in diffuse reflectance intensity across all visible wavelengths. In contrast, spectral changes in tissue autofluorescence profiles were much more distinct. The second important observation was that the presence of blood in microcirculation had a negligible effect on normalized autofluorescence profiles (compare normalized traces in Figs. 4 vs 5). This is because blood within vessels much larger than capillaries does not contribute significantly to the spectrum of returning light since virtually all visible light is absorbed during transit through large and medium-sized vessels by RBCs25. At the same time, the amount of RBCs in capillary circulation does not exceed <1% of total tissue volume25,26, so their spectral contribution is minimal.
The main limitation of autofluorescence HIS is its limited ability to sense lesion depth as UV light does not penetrate into muscle for more than a millimeter27. Yet several studies have suggested that surface visualization of the scar can be also important. Specifically, the outcomes of ventricular tachycardia ablation procedures in patients with post-myocardial infarction28 or arrhythmogenic right ventricular dysplasia29 were greatly improved by targeting the conducting channels within the scarred tissue near epi or endocardial surfaces. Almost 60% of these conductive channels were found within the first millimeters of ventricular wall17. This suggests that most of the arrhythmogenic substrate in patients with post-MI can be approached with RF delivery near the endocardial surface. In such cases, the ability of HSI to distinguish viable tissue within the scar with submillimeter spatial resolution can be extremely useful.
High resolution in-vivo imaging of scar surface can be useful to guide injections of stem cells derived cardiomyocytes into the scar boundary30. Shown spectral differences can also be used for the design of smart injection needles with fiberoptic sensor on the needle tip sensing surrounding tissue, including scar, blood vessel, or pool of injected dye-loaded cells.
Future clinical applications of HSI for noninvasive surgical guidance will require the manufacturing of specialized percutaneous visualization catheters or incorporation of the HSI into already existing cardiac visualization catheters4,5. Visual outcomes of a pilot version of the HSI catheter shown in Fig. 8A can be significantly improved by gating hypercube acquisition to R-R interval, optimization of optical ranges, and using more advanced unmixing algorithms.
In summary, our data suggests that an autofluorescence based, percutaneous HSI endoscope can be an excellent tool to reveal myocardial scar tissue in vivo. It can help reduce surgical time and improve the efficiency and effectiveness of several cardiac procedures. And since ablation procedures are commonly performed in other anatomical locations, the same principles can be also applied to many additional clinical targets for improved surgical guidance.
Supplementary Material
Acknowledgments
Funding: NHLBI R42HL120511 award
We are indebted to Drs. Omar Amirana, Marco Mercader and Terry Ransbury for insightful discussions.
Footnotes
Conflict of Interests:
Swift, Muselimyan, Asfour - none. Sarvazyan, Armstrong, Larson - LuxCath LLC stock options.
Publisher's Disclaimer: This is a PDF file of an unedited manuscript that has been accepted for publication. As a service to our customers we are providing this early version of the manuscript. The manuscript will undergo copyediting, typesetting, and review of the resulting proof before it is published in its final citable form. Please note that during the production process errors may be discovered which could affect the content, and all legal disclaimers that apply to the journal pertain.
References
- 1.Rijnierse MT, Allaart CP, Knaapen P. Principles and techniques of imaging in identifying the substrate of ventricular arrhythmia. J Nucl Cardiol. 2016;23:218–234. doi: 10.1007/s12350-015-0344-8. [DOI] [PMC free article] [PubMed] [Google Scholar]
- 2.Andreu D, Ortiz-Pérez JT, Boussy T, Fernández-Armenta J, de Caralt TM, Perea RJ, Prat-González S, Mont L, Brugada J, Berruezo A. Usefulness of contrast-enhanced cardiac magnetic resonance in identifying the ventricular arrhythmia substrate and the approach needed for ablation. Eur Heart J. 2014:35. doi: 10.1093/eurheartj/eht510. [DOI] [PubMed] [Google Scholar]
- 3.Melby SJ, Lee AM, Zierer A, Kaiser SP, Livhits MJ, Boineau JP, Schuessler RB, Damiano RJ. Atrial fibrillation propagates through gaps in ablation lines: implications for ablative treatment of atrial fibrillation. Heart Rhythm. 2008;5:1296–1301. doi: 10.1016/j.hrthm.2008.06.009. [DOI] [PMC free article] [PubMed] [Google Scholar]
- 4.Dukkipati SR, Cuoco F, Kutinsky I, Aryana A, Bahnson TD, Lakkireddy D, Woollett I, Issa ZF, Natale A, Reddy VY. Pulmonary Vein Isolation Using the Visually Guided Laser Balloon. J Am Coll Cardiol. 2015;66:1350–1360. doi: 10.1016/j.jacc.2015.07.036. [DOI] [PubMed] [Google Scholar]
- 5.Sacher F, Derval N, Jadidi A, Scherr D, Hocini M, Haissaguerre M, Dos Santos P, Jais P. Comparison of ventricular radiofrequency lesions in sheep using standard irrigated tip catheter versus catheter ablation enabling direct visualization. J Cardiovasc Electrophysiol. 2012;23:869–873. doi: 10.1111/j.1540-8167.2012.02338.x. [DOI] [PubMed] [Google Scholar]
- 6.Mercader M, Swift L, Jaimes R, III, Armstrong K, Ransburry T, Amirana O, Sarvazyan N, Kay M. Real-time NADH Fluorescence Imaging Catheter (LuxCath): A Novel Imaging System for Evaluation of Radiofrequency Ablation Lesions and Gaps. Heart Rhythm. 2013:A-9102. [Google Scholar]
- 7.Lin E, Alessio A. What are the basic concepts of temporal, contrast, and spatial resolution in cardiac CT? J Cardiovasc Comput Tomogr. 2009;3:403–408. doi: 10.1016/j.jcct.2009.07.003. [DOI] [PMC free article] [PubMed] [Google Scholar]
- 8.Mansfield JR, Gossage KW, Hoyt CC, Levenson RM. Autofluorescence removal, multiplexing, and automated analysis methods for in-vivo fluorescence imaging. J Biomed Opt International Society for Optics and Photonics. 2005;10:41207. doi: 10.1117/1.2032458. [DOI] [PubMed] [Google Scholar]
- 9.Gil DA, Swift LM, Asfour H, Muselimyan N, Mercader MA, Sarvazyan NA. Autofluorescence hyperspectral imaging of radiofrequency ablation lesions in porcine cardiac tissue. J Biophotonics. 2017;10:1008–1017. doi: 10.1002/jbio.201600071. [DOI] [PMC free article] [PubMed] [Google Scholar]
- 10.Koruth J, Kusa S, Dukkipati S, Neuzil P, Ransbury T, Armstrong K, Larson, Cinnamon Bowen L, Omar A, Mercader M, Sarvazyan N, Kay M, Reddy VY. Direct assessment of catheter-tissue contact and RF lesion formation: a novel approach using endogenous NADH fluorescence. Heart Rhythm. 2015:S111. [Google Scholar]
- 11.Armstrong K, Ransbury T, Reddy VY, Koruth J, Amirana O, Mercader MA, Sarvazyan N, Larson C, Bowen J. Comparison of optical tissue interrogation vs impedance measurement for real-time monitoring of catheter-tissue contact and RF lesion progression. Heart Rhythm. 2015:S117. [Google Scholar]
- 12.Swift L, Gil DAB, Jaimes R, Kay M, Mercader M, Sarvazyan N. Visualization of epicardial cryoablation lesions using endogenous tissue fluorescence. Circ Arrhythm Electrophysiol. 2014;7:929–937. doi: 10.1161/CIRCEP.114.001750. [DOI] [PMC free article] [PubMed] [Google Scholar]
- 13.Mercader M, Swift L, Sood S, Asfour H, Kay M, Sarvazyan N. Use of endogenous NADH fluorescence for real-time in situ visualization of epicardial radiofrequency ablation lesions and gaps. Am J Physiol Heart Circ Physiol. 2012;302:H2131–8. doi: 10.1152/ajpheart.01141.2011. [DOI] [PMC free article] [PubMed] [Google Scholar]
- 14.Demos SG, Sharareh S. Real time assessment of RF cardiac tissue ablation with optical spectroscopy. Opt Express. 2008;16:15286–15296. doi: 10.1364/oe.16.015286. [DOI] [PubMed] [Google Scholar]
- 15.Muselimyan N, Swift LM, Asfour H, Chahbazian T, Mazhari R, Mercader M, Sarvazyan N. Seeing the Invisible: Revealing Atrial Ablation Lesions Using Hyperspectral Imaging Approach. PLoS One. 2016;11:e0167760. doi: 10.1371/journal.pone.0167760. [DOI] [PMC free article] [PubMed] [Google Scholar]
- 16.Aldhoon B, Kučera T, Smorodinová N, Martínek J, Melenovský V, Kautzner J. Associations between cardiac fibrosis and permanent atrial fibrillation in advanced heart failure. Physiol Res. 2013;62:247–255. doi: 10.33549/physiolres.932409. [DOI] [PubMed] [Google Scholar]
- 17.Andreu D, Berruezo A, Ortiz-Pérez JT, Silva E, Mont L, Borràs R, de Caralt TM, Perea RJ, Fernández-Armenta J, Zeljko H, Brugada J. Integration of 3D Electroanatomic Maps and Magnetic Resonance Scar Characterization Into the Navigation System to Guide Ventricular Tachycardia Ablation Clinical Perspective. Circ Arrhythmia Electrophysiol. 2011;4:674–683. doi: 10.1161/CIRCEP.111.961946. [DOI] [PubMed] [Google Scholar]
- 18.Nazarian S, Beinart R. CMR-guided targeting of gaps after initial pulmonary vein isolation. JACC Cardiovasc Imaging. 2014;7:664–666. doi: 10.1016/j.jcmg.2014.02.006. [DOI] [PubMed] [Google Scholar]
- 19.Bunch TJ, Weiss JP, Crandall BG, Day JD, Dimarco JP, Ferguson JD, Mason PK, McDaniel G, Osborn JS, Wiggins D, Mahapatra S. Image integration using intracardiac ultrasound and 3D reconstruction for scar mapping and ablation of ventricular tachycardia. J Cardiovasc Electrophysiol Blackwell Publishing Inc. 2010;21:678–684. doi: 10.1111/j.1540-8167.2009.01680.x. [DOI] [PubMed] [Google Scholar]
- 20.Goergen CJ, Chen HH, Sakadžić S, Srinivasan VJ, Sosnovik DE. Microstructural characterization of myocardial infarction with optical coherence tractography and two-photon microscopy. Physiol Rep. 2016;4:e12894. doi: 10.14814/phy2.12894. [DOI] [PMC free article] [PubMed] [Google Scholar]
- 21.Gan Y, Fleming CP. Extracting three-dimensional orientation and tractography of myofibers using optical coherence tomography. Biomed Opt Express. 2013;4:2150. doi: 10.1364/BOE.4.002150. [DOI] [PMC free article] [PubMed] [Google Scholar]
- 22.Dana N, Di Biase L, Natale A, Emelianov S, Bouchard R. In vitro photoacoustic visualization of myocardial ablation lesions. Heart Rhythm. 2013;11:150–157. doi: 10.1016/j.hrthm.2013.09.071. [DOI] [PMC free article] [PubMed] [Google Scholar]
- 23.Ahmad I, Gribble A, Ikram M, Pop M, Vitkin A. Polarimetric assessment of healthy and radiofrequency ablated porcine myocardial tissue. J Biophotonics. 9:750–759. doi: 10.1002/jbio.201500184. [DOI] [PubMed] [Google Scholar]
- 24.Prabhu SD, Frangogiannis NG. The Biological Basis for Cardiac Repair After Myocardial Infarction. Circ Res. 2016;119:91–112. doi: 10.1161/CIRCRESAHA.116.303577. [DOI] [PMC free article] [PubMed] [Google Scholar]
- 25.Gandjbakhche AH, Bonner RF, Arai AE, Balaban RS. Visible-light photon migration through myocardium in vivo. Am J Physiol Heart Circ Physiol. 1999;277:H698–704. doi: 10.1152/ajpheart.1999.277.2.H698. [DOI] [PubMed] [Google Scholar]
- 26.Silverman DA, Rakusan K. Red blood cell spacing in rat coronary capillaries during the cardiac cycle. Microvasc Res. 1996;52:143–156. doi: 10.1006/mvre.1996.0050. [DOI] [PubMed] [Google Scholar]
- 27.Dana N, Asfour H, Emelianov S, Sarvazyan N. Surface Illumination and Autofluorescence Modeling for Assessment of Radiofrequency Ablation Lesions. Circulation. 2016;134:A18934. [Google Scholar]
- 28.Berruezo A, Fernandez-Armenta J, Andreu D, et al. Scar Dechanneling: New Method for Scar-Related Left Ventricular Tachycardia Substrate Ablation. Circ Arrhythmia Electrophysiol. 2015;8:326–336. doi: 10.1161/CIRCEP.114.002386. [DOI] [PubMed] [Google Scholar]
- 29.Berruezo A, Fernandez-Armenta J, Mont L, Zeljko H, Andreu D, Herczku C, Boussy T, Tolosana JM, Arbelo E, Brugada J. Combined Endocardial and Epicardial Catheter Ablation in Arrhythmogenic Right Ventricular Dysplasia Incorporating Scar Dechanneling Technique. Circ Arrhythmia Electrophysiol. 2012;5:111–121. doi: 10.1161/CIRCEP.110.960740. [DOI] [PubMed] [Google Scholar]
- 30.Shiba Y, Fernandes S, Zhu W-Z, et al. Human ES-cell-derived cardiomyocytes electrically couple and suppress arrhythmias in injured hearts. Nature. 2012;489:332–335. doi: 10.1038/nature11317. [DOI] [PMC free article] [PubMed] [Google Scholar]
Associated Data
This section collects any data citations, data availability statements, or supplementary materials included in this article.


