

Abstract
Background
A meta‐analysis was conducted to investigate the diagnostic performance of computed tomography (CT) imaging features of ground‐glass opacity (GGO) to predict invasiveness.
Methods
Two reviewers independently searched PubMed, Medline, Web of Science, Cochrane Embase and CNKI for relevant studies. CT imaging signs of bubble lucency, speculation, lobulated margin, and pleural indentation were used as diagnostic references to discriminate pre‐invasive and invasive disease. The sensitivity, specificity, diagnostic odds ratio (DOR), summary receiver operating characteristic (SROC) curves, and the area under the SROC curve (AUC) were calculated to evaluate diagnostic efficiency.
Results
Twelve studies were finally included. Diagnostic performance ranged from 0.41 to 0.52 for sensitivity and 0.56 to 0.63 for specificity. The diagnostic positive and negative likelihood ratios ranged from 1.03 to 2.13 and 0.52 to 1.05, respectively. The DORs of the GGO CT features for discriminating invasive disease ranged from 1.02 to 4.00. The area under the ROC curve was also low, with a range of 0.60 to 0.67 for discriminating pre‐invasive and invasive disease.
Conclusion
The diagnostic value of a single CT imaging sign of GGO, such as bubble lucency, speculation, lobulated margin, or pleural indentation is limited for discriminating pre‐invasive and invasive disease because of low sensitivity, specificity, and AUC.
Keywords: Bubble lucency, GGO, lobulated margin, pleural indentation, spiculation
Introduction
Lung cancer is the most commonly diagnosed malignant cancer and one of the leading causes of cancer‐related death globally.1 Epidemiology studies have revealed that although squamous cell carcinoma was initially the most common pathological subtype, adenocarcinoma has now become the dominant subtype.2 In 2011, the International Association for the Study of Lung Cancer (IASLC), the American Thoracic Society (ATS), and the European Respiratory Society (ERS) jointly published a new lung adenocarcinoma classification system. Bronchioloalveolar carcinoma was abandoned and the concept of minimally invasive adenocarcinoma was first introduced. Generally, pre‐invasive ground‐glass opacity (GGO) was included as atypical adenomatous hyperplasia (AAH) and adenocarcinoma in situ (AIS). Minimally invasive adenocarcinoma (MIA) and invasive adenocarcinoma were categorized as invasive disease. It is believed that the change from AAH to MIA is a continuous process. The five‐year survival rate has been reported at almost 100% for AAH, AIS, and MIA patients;3 however, the long‐term survival rate of patients with invasive adenocarcinoma remains poor. Therefore, early diagnosis of invasive adenocarcinoma and distinguishing between pre‐invasive and invasive lesions is important for the clinical management of GGO.
Clinically, high resolution CT (HRCT) examination is routinely performed to assess GGO lesions.4 Several imaging features, such as bubble lucency, speculation, lobulated margin, and pleural indentation, were commonly used to predict pathology type. However, the discrimination power of HRCT imaging features to discern pre‐invasive from invasive lesions is unclear. Therefore, we evaluated the diagnostic performance of CT imaging features of GGO to predict invasiveness.
Methods
Electronic publication search
Two reviewers independently searched PubMed, Medline, Web of Science, Cochrane Embase, and CNKI for relevant studies. The search terms included: computed tomography, ground‐glass nodule, ground‐glass opacity, atypical adenomatous hyperplasia, adenocarcinoma in situ, and minimally invasive adenocarcinoma. References of the included studies were also screened to locate additional relevant publications.
Inclusion and exclusion criteria
The inclusion criteria were: (i) studies related to CT imaging features to predict invasive and pre‐invasive disease; (ii) pathology or cytology examinations were used as the gold standard of diagnosis; and (iii) adequate data could be extracted from the original publication. Exclusion criteria: (i) duplicate publications or data; (ii) case reports or reviews; (iii) the original study did not provide a diagnostic gold standard; (iv) publication in languages other than English or Chinese; and (v) insufficient data available in the original publication.
Data extraction
Two reviewers independently reviewed the full text of each included study. Disagreement was resolved by discussion or consultation with a third reviewer. The first and corresponding author names, publication year and journal, the country in which the study was performed, GGO type, and sample size, were extracted. The number of GGO lesions located using CT imaging signs of bubble lucency, speculation, lobulated margin, and pleural indentation in pre‐invasive and invasive GGO were also extracted. All data were cross‐checked.
Statistical analysis
Diagnostic sensitivity and specificity were calculated using the formulas: sensitivity = true positive/(true positive + false negative); and specificity = true negative/(true negative + false positive). The area under the receiver operating characteristic (ROC) curve was used to evaluate the feasibility of CT imaging features for the diagnosis of pre‐invasive and invasive GGO. Publication bias was evaluated using Deek's funnel plot and Egger's line regression test. Two‐tailed P values of < 0.05 were considered statistically significant. All statistical analysis was performed using Stata version 12.0 (http://www.stata.com; Stata Corporation, College Station, TX, USA.)
Results
General features of the included studies
Initially, 1128 publications were identified; however, after applying the inclusion criteria, twelve studies were finally included in the meta‐analysis (Fig 1).5, 6, 7, 8, 9, 10, 11, 12, 13, 14, 15, 16 The characteristics of the included studies are shown in Table 1.
Figure 1.
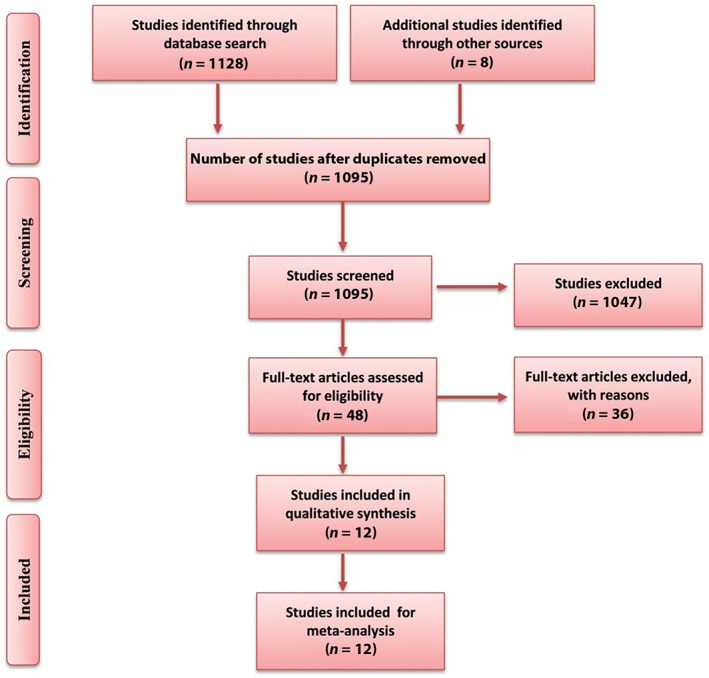
Publication screening flow chart.
Table 1.
Main characteristics of the included studies
| Study | Year | Country | Sample size | Invasive | Pre‐invasive | GGO type |
|---|---|---|---|---|---|---|
| Lee et al.5 | 2013 | Korea | 208 | 160 | 48 | pGGO/mGGO |
| Gao et al.6 | 2014 | China | 97 | 73 | 24 | pGGO |
| Zhang et al.7 | 2014 | China | 53 | 38 | 15 | pGGO/mGGO |
| Pan et al.8 | 2014 | China | 73 | 52 | 21 | pGGO |
| Jin et al.9 | 2014 | China | 94 | 73 | 21 | pGGO |
| Liu et al.10 | 2015 | China | 105 | 62 | 43 | pGGO |
| Shi et al.11 | 2016 | China | 82 | 43 | 39 | pGGO/mGGO |
| Pan et al.12 | 2016 | China | 99 | 20 | 79 | pGGO |
| Li et al.13 | 2016 | China | 80 | 21 | 59 | pGGO/mGGO |
| Lu et al.14 | 2017 | China | 41 | 24 | 17 | pGGO/mGGO |
| Tang et al.15 | 2017 | China | 34 | 20 | 14 | pGGO |
| Jing et al.16 | 2017 | China | 103 | 36 | 67 | pGGO |
mGGO, mixed ground‐glass opacity; pGGO, pure GGO.
Pooled diagnostic sensitivity and specificity
The diagnostic sensitivity and specificity using bubble lucency as a reference of invasive GGO discrimination was 0.52 (0.47–0.57) and 0.63 (0.58–0.67) respectively; For speculation, lobulated margin, and pleural indentation, the diagnostic sensitivity was 0.52 (0.46–0.58), 0.41(0.35–0.46), and 0.46 (0.41–0.51); and the specificity was 0.58 (0.54–0.60), 0.56 (0.51–0.60), and 0.60 (0.56–0.65), respectively (Table 2).
Table 2.
Pooled diagnostic sensitivity and specificity for CT imaging features of GGO (95% confidence interval)
| Diagnostic performance | Bubble lucency | Speculation | Lobulated margin | Pleural indentation |
|---|---|---|---|---|
| Sensitivity | 0.52 (0.47–0.57) | 0.52 (0.46–0.58) | 0.41 (0.35–0.46) | 0.46 (0.41–0.51) |
| Specificity | 0.63 (0.58–0.67) | 0.58 (0.54–0.60) | 0.56 (0.51–0.60) | 0.60 (0.56–0.65) |
CT, computed tomography; GGO, ground‐glass opacity.
Positive and negative likelihood and diagnostic odds ratios
The positive and negative likelihood ratios were 1.36 (1.20–1.54) and 0.79 (0.69–0.90) for bubble lucency; 1.57 (1.16–2.13) and 0.71 (0.52–0.95) for speculation; 1.44 (1.12–1.84) and 0.80 (0.64–1.01) for lobulated margin; and 1.45 (1.03–2.05) and 0.88(0.73–1.05) for pleural indentation, respectively (Table 3). The diagnostic odds ratios for bubble lucency, speculation, lobulated margin, and pleural indentation for discriminating invasive disease were 2.27 (1.59–3.24), 2.96 (1.54–5.67), 2.27 (1.29–4.00), and 1.90 (1.02–3.55), respectively.
Table 3.
Pooled likelihood ratios and DOR for CT imaging features of GGO (95% confidence interval)
| Diagnostic performance | Bubble lucency | Speculation | Lobulated margin | Pleural indentation |
|---|---|---|---|---|
| +lr | 1.36 (1.20–1.54) | 1.57 (1.16–2.13) | 1.44 (1.12–1.84) | 1.45 (1.03–2.05) |
| −lr | 0.79 (0.69–0.90) | 0.71 (0.52–0.95) | 0.80 (0.64–1.01) | 0.88 (0.73–1.05) |
| DOR | 2.27 (1.59–3.24) | 2.96 (1.54–5.67) | 2.27 (1.29–4.00) | 1.90 (1.02–3.55) |
+lr, positive likelihood ratio; ‐lr, negative likelihood ratio; CT, computed tomography; DOR, diagnostic odds ratio; GGO, ground‐glass opacity.
Pooled receiver operating characteristic curves
The pooled ROC curve was drawn by sensitivity against 1‐specificity using Stata version 12.0. The area under the ROC curve (AUC) values were 0.64, 0.67, 0.64, and 0.60 for bubble lucency, speculation, lobulated margin, and pleural indentation of GGO for discriminating pre‐invasive and invasive disease, respectively (Fig 2).
Figure 2.
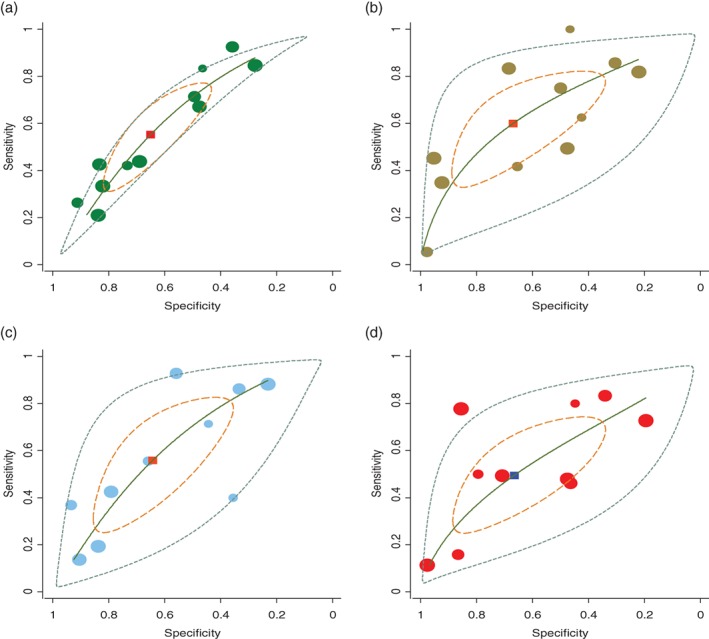
Pooled receiver operating characteristic (ROC) curves for computed tomography imaging signs to discriminate pre‐invasive and invasive disease: (a) bubble lucency ( ) study estimate, (
 ) Summary point, (
 ) HSROC curve, (
 ) 95% confidence region, and (
 ) 95% prediction region; (b) speculation (
 ) study estimate, (
 ) Summary point, (
 ) HSROC curve, (
 ) 95% confidence region, and () 95% prediction region; (c) lobulated margin (
 ) study estimate, (
 ) Summary point, (
 ) HSROC curve, (
 ) 95% confidence region, and () 95% prediction region; and (d) pleural indentation (
 ) study estimate, (
 ) Summary point, (
 ) HSROC curve, (
 ) 95% confidence region, and () 95% prediction region. HSROC, hierarchical summary receiver operating characteristic.
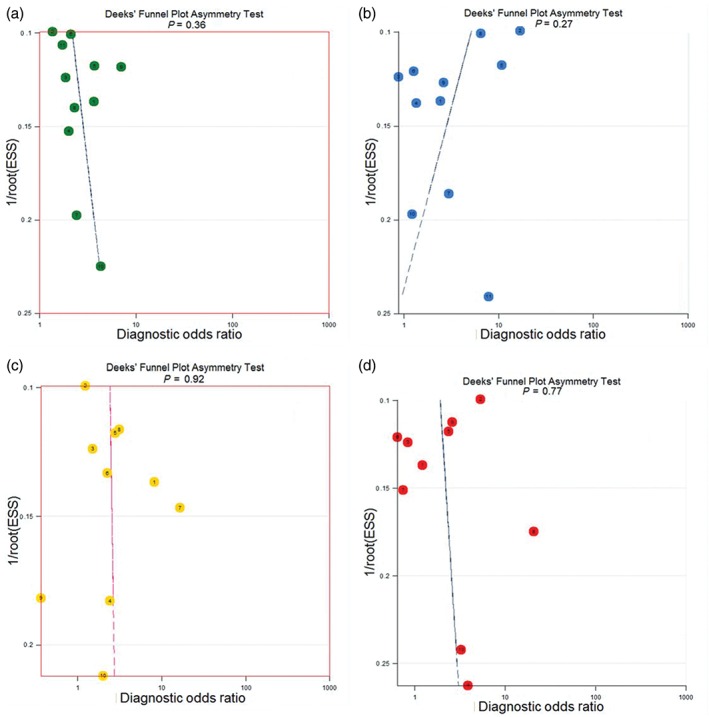
Publication analysis
Publication bias of GGO features in CT imaging to predict invasiveness was assessed by Deeks’ funnel plot and Egger's line regression test (Fig 3). No significant bias for bubble lucency (P = 0.36), speculation (P = 0.27), lobulated margin (P = 0.92), or pleural indentation (P = 0.78) was observed (Table 4).
Figure 3.
Publication bias evaluated by Deeks’ funnel plot for computed tomography features: (a) bubble lucency ( ) Study, and (
 ) Regression Line; (b) speculation (
 ) Study, and (
 ) Regression Line; (c) lobulated margin (
 ) Study, and (
 ) Regression Line; and (d) pleural indentation (
 ) Study, and (
 ) Regression Line.
Table 4.
Publication bias evaluation for CT features
| CT features | Coefficient | SE | t | P | 95% CI of coefficient |
|---|---|---|---|---|---|
| Bubble lucency | 5.22 | 5.45 | 0.96 | 0.36 | −7.10–17.54 |
| Speculation | −11.95 | 10.25 | −1.17 | 0.27 | −35.14–11.23 |
| Lobulated margin | 1.07 | 10.82 | 0.10 | 0.92 | −23.88–26.03 |
| Pleural indentation | 0.36 | 1.25 | 0.29 | 0.78 | −2.53–3.25 |
CI, confidence interval; CT, computed tomography; SE, standard error.
Discussion
Early stage lung adenocarcinoma is mainly expressed as GGO on HRCT. GGO is a non‐specific finding on CT scans that indicates a partial filling of air spaces in the lungs by exudate or transudate, as well as interstitial thickening or the partial collapse of lung alveoli.17 According to its composition, GGO is generally divided into pure GGO (pGGO) or mixed GGO (mGGO). It has been reported that about 18% of pGGO and 63% of mGGO can develop into malignant lesions.18 Sukki et al. found that about 59% of stable pGGOs developed into AIS or MIA.19 Studies have proven that the process from AAH to invasive adenocarcinoma is continuous and may take many years.
With developments in CT examination technology, such as the application of low‐dose mass screening and HRCT, GGO is now more commonly detected clinically.20, 21 The five‐year survival rate has been reported at almost 100% for AAH, AIS, and MIA patients;3 however, the long‐term survival rate of patients with invasive adenocarcinoma remains poor.22, 23, 24 Intensive follow‐up and CT scan examinations increase the cost of medical care and cause unnecessary patient concern. Thus, how to identify benign and malignant and pre‐invasive and invasive lesions remains a challenge for clinicians and radiologists.
Previous studies have evaluated the diagnostic performance of CT imaging features of GGO for discriminating pre‐invasive and invasive lesions; however, the results have been inconsistent or inconclusive.5, 10, 11 In the present study, we examined the results of previous studies of GGO CT imaging features and found low differential diagnostic performance, ranging from 0.41 to 0.52 for sensitivity and 0.56 to 0.63 for specificity. The AUC was also low, with a range of 0.60 to 0.67. These results indicate that the diagnostic performance of a single CT imaging sign for GGO is limited for discriminating pre‐invasive and invasive disease because of low sensitivity, specificity, and AUC.
There are some limitations to the present meta‐analysis: (i) the general quality of the included studies was relatively poor; (ii) only studies published in English or Chinese were included; and (iii) pooled combined CT imaging features, such as speculation, lobulated margin, and pleural indentation, were not calculated.
Our results indicate that a single CT imaging feature is inadequate to discriminate pre‐invasive from invasive disease in cases of GGO. A quantitative diagnostic mathematical model combining CT imagining features is needed to reevaluate diagnostic performance.
Disclosure
No authors report any conflict of interest.
References
- 1. Siegel RL, Miller KD, Jemal A. Cancer statistics, 2016. CA Cancer J Clin 2016; 66: 7–30. [DOI] [PubMed] [Google Scholar]
- 2. Torre LA, Siegel RL, Jemal A. Lung cancer statistics. Adv Exp Med Biol 2016; 893: 1–19. [DOI] [PubMed] [Google Scholar]
- 3. Wolf AS, Richards WG, Jaklitsch MT et al Lobectomy versus sublobar resection for small (2 cm or less) non‐small cell lung cancers. Ann Thorac Surg 2011; 92: 1819–23. [DOI] [PubMed] [Google Scholar]
- 4. Shah RM, Jimenez S, Wechsler R. Significance of ground‐glass opacity on HRCT in long‐term follow‐up of patients with systemic sclerosis. J Thorac Imaging 2007; 22: 120–4. [DOI] [PubMed] [Google Scholar]
- 5. Lee SM, Park CM, Goo JM, Lee HJ, Wi JY, Kang CH. Invasive pulmonary adenocarcinomas versus preinvasive lesions appearing as ground‐glass nodules: Differentiation by using CT features. Radiology 2013; 268: 265–73. [DOI] [PubMed] [Google Scholar]
- 6. Gao F, Ge XJ, Li M et al [CT diagnosis of different pathological types of ground‐glass nodules.] Chin J Oncol 2014; 36: 188–92. (In Chinese.) [PubMed] [Google Scholar]
- 7. Zhang HB, Xu X, Gong YJ, Wang SP. [CT imaging features of the malignant GGO.] Guangdong Med J 2014; 35: 3709–12. (In Chinese.) [Google Scholar]
- 8. Pan F, Liu Z, Yuan F et al [Comparative study of focal pulmonary ground glass nodule between findings of high resolution CT and pathology classiifcation of IASLC/ATS/ERS.] Chin J Med Imaging 2014; 815–9 23. (In Chinese.) [Google Scholar]
- 9. Jin Z, Zhao SH, Gao J et al Pathological classification and imaging characteristics of early‐stage lung adenocarcinoma with pure ground‐glass opacity. Chin J Radiol 2014; 48: 283–7. [Google Scholar]
- 10. Liu LH, Liu M, Wei R et al CT findings of persistent pure ground glass opacity: Can we predict the invasiveness. Asian Pac J Cancer Prev 2015; 16: 1925–8. [DOI] [PubMed] [Google Scholar]
- 11. Shi ZY, Sun Y, Wang J, Su TT. Diagnostic value of multi‐slice CT in diagnosis of focal pulmonary ground‐glass opacity nodules of 1 cm or less. J Reg Anat Oper Surg 2016; 25: 446–9. [Google Scholar]
- 12. Pan J, Zuo PD, Ying ML, Li L, Shi HQ, Shu J. [Differential diagnosis of pulmonary invasive adenocarcinoma and preinvasive lesions in pure ground‐glass nodules on high resolution targeted CT scan.] Zhe Med J 2016; 38: 826–8. (In Chinese.) [Google Scholar]
- 13. Li XM, Wu G. [A comparative analysis of solitary pulmonary GGN through high resolution CT manifestation with pathology in changes.] J Harbin Med Univ 2016; 50: 67–70. (In Chinese.) [Google Scholar]
- 14. Lu QY, Chen WF. [CT characteristic of different pathological types of ground‐glass nodules.] J Med Imaging (Bellingham) 2017; 27: 1084–7. (In Chinese.) [Google Scholar]
- 15. Tang M, Wu X, Guo T et al [Study on the clinical and imaging features of solitary pulmonary glass nodule.] Clin Med China 2017; 33: 895–9. (In Chinese.) [Google Scholar]
- 16. Jing N. [Value of multi‐slice spiral CT in differential diagnosis of pure ground‐glass nodule of 1 cm or less in lung infiltrating adenocarcinoma and before infiltration.] J Int Oncol 2017; 44: 573–7. (In Chinese.) [Google Scholar]
- 17. Jiang L, Situ D, Lin Y et al Clinical model to estimate the pretest probability of malignancy in patients with pulmonary focal ground‐glass opacity. Thorac Cancer 2013; 4: 380–4. [DOI] [PubMed] [Google Scholar]
- 18. Henschke CI, Yankelevitz DF, Mirtcheva R et al CT screening for lung cancer: Frequency and significance of part‐solid and nonsolid nodules. AJR Am J Roentgenol 2002; 178: 1053–7. [DOI] [PubMed] [Google Scholar]
- 19. Cho S, Yang H, Kim K, Jheon S. Pathology and prognosis of persistent stable pure ground‐glass opacity nodules after surgical resection. Ann Thorac Surg 2013; 96: 1190–5. [DOI] [PubMed] [Google Scholar]
- 20. Tsutsui S, Ashizawa K, Minami K et al Multiple focal pure ground‐glass opacities on high‐resolution CT images: Clinical significance in patients with lung cancer. AJR Am J Roentgenol 2010; 195: W131–8. [DOI] [PubMed] [Google Scholar]
- 21. Miller A, Markowitz S, Manowitz A, Miller JA. Lung cancer screening using low‐dose high‐resolution CT scanning in a high‐risk workforce: 3500 nuclear fuel workers in three US states. Chest 2004; 125 (5 Suppl): 152S–3S. [PubMed] [Google Scholar]
- 22. Pedersen JH, Saghir Z, Wille MM, Thomsen LH, Skov BG, Ashraf H. Ground‐glass opacity lung nodules in the era of lung cancer CT screening: Radiology, pathology, and clinical management. Oncology (Williston Park) 2016; 30: 266–74. [PubMed] [Google Scholar]
- 23. Kobayashi Y, Mitsudomi T. Management of ground‐glass opacities: Should all pulmonary lesions with ground‐glass opacity be surgically resected. Transl Lung Cancer Res 2013; 2: 354–63. [DOI] [PMC free article] [PubMed] [Google Scholar]
- 24. Kim HK, Choi YS, Kim J, Shim YM, Lee KS, Kim K. Management of multiple pure ground‐glass opacity lesions in patients with bronchioloalveolar carcinoma. J Thorac Oncol 2010; 5: 206–10. [DOI] [PubMed] [Google Scholar]