

Abstract
The distribution of parasites across mammalian hosts is complex and represents a differential ability or opportunity to infect different host species. Here, we take a macroecological approach to investigate factors influencing why some parasites show a tendency to infect species widely distributed in the host phylogeny (phylogenetic generalism) while others infect only closely related hosts. Using a database on over 1400 parasite species that have been documented to infect up to 69 terrestrial mammal host species, we characterize the phylogenetic generalism of parasites using standard effect sizes for three metrics: mean pairwise phylogenetic distance (PD), maximum PD and phylogenetic aggregation. We identify a trend towards phylogenetic specialism, though statistically host relatedness is most often equivalent to that expected from a random sample of host species. Bacteria and arthropod parasites are typically the most generalist, viruses and helminths exhibit intermediate generalism, and protozoa are on average the most specialist. While viruses and helminths have similar mean pairwise PD on average, the viruses exhibit higher variation as a group. Close-contact transmission is the transmission mode most associated with specialism. Most parasites exhibiting phylogenetic aggregation (associating with discrete groups of species dispersed across the host phylogeny) are helminths and viruses.
Keywords: parasite, multi-host, specialism, transmission mode, phylogenetic, macroecology
1. Introduction
Parasites that can infect a wide range of host species, i.e. generalist parasites, are often highlighted as threats to biodiversity conservation and public health due to their widespread impact and likelihood of emergence in novel hosts [1–5]. Conventionally, parasitologists quantify parasite generalism (or, conversely, specificity) by the taxonomic breadth of their host species, for instance, by number of host species that a parasite can infect [6–8]. Studies using such generalism metrics have provided important insights into the ecology and evolution of parasites, but have been less successful in identifying which host species are at greatest risk of future emergent infectious diseases, and which parasites are likely to cause those outbreaks. In part, this is because simple metrics do not fully characterize all dimensions of parasite generalism, and they are often not calibrated against null expectations. Parasite species can be contrasted by their average differences (e.g. the mean relatedness of all their hosts) or by their extreme differences (e.g. the maximum PD among their hosts). They may also differ in terms of their tendency to infect discrete clusters of host species—their tendency towards phylogenetic aggregation. Thus, a phylogenetic perspective contrasting observations to null expectations provides a powerful framework for exploring parasite generalism and the factors, such as parasite type and transmission mode, that underlie patterns of host–parasite associations. Considering multiple axes of generalism also provides opportunities for developing metrics for future work aimed, for example, at teasing apart the role of host-shifts and co-speciation in the evolutionary ecology shaping contemporary host–parasite dynamics [9] and predicting emerging threats to humans and wildlife [10].
One of the challenges for understanding the distribution of parasites is to account for how host species differ in their exposure and susceptibility to the same parasite [8,11], and how phylogeny predicts host–parasite associations through these effects. The rapid development in integrating information on evolutionary history into biodiversity research [12,13] has inspired recent research aimed at bringing an evolutionary perspective to the mechanisms underlying parasite generalism and for identifying unknown existing or potential host species [10,11,14,15]. For example, mammalian parasites capable of infecting multiple host species from disparate evolutionary lineages (i.e. distant relatives in a phylogeny) are more likely to cause zoonotic disease outbreaks than others [16]. Here, we quantify the phylogenetic relatedness among host species infected by the same parasite, i.e. a parasite's phylogenetic generalism (or phylogenetic host specificity), to identify the factors that determine host–parasite relationships at macroecological scales. We also present a novel index to characterize the distribution of a parasite on the host phylogeny. For example, parasites may exhibit patterns consistent with ‘creeping’ through the phylogeny via related hosts (potentially indicative of co-speciation), taking large ‘leaps’ across host clades (i.e. more consistent with host shifts) or some combination of these patterns. This macroecological perspective is not designed to definitely establish mechanisms associated with particular host or parasite species, but provides a common vocabulary to articulate parasite generalism and associates this with taxonomic and transmission mode parasite traits.
The distribution of parasites across host species has previously been shown to depend on the phylogenetic relatedness among host species [17–20]. Closely related host species share common evolutionary history, and thus common parasites, at least until their divergence [21,22]. They also show higher similarity in their biology than distantly related hosts [23–25], including characteristics associated with immune responses, and behaviours associated with encounter probabilities related with diet, that can modify the potential for host switching via exposure and susceptibility [26–28]. However, two recent studies, using relatively restricted datasets on parasites in different mammalian clades, uncovered substantial variation in the degree of phylogenetic generalism. Most parasites infecting multiple primate hosts appeared to be phylogenetic generalists [16], but for carnivores, many multi-host parasites were constrained by host phylogeny, especially helminths and viruses [18]. Earlier work also revealed that many helminth species tend to exhibit taxonomically restricted host ranges [7,11,29] but suggested that viruses, due to their rapid mutation rates, should more readily adapt to new hosts that are not necessarily closely related to existing hosts [30–32]. These mixed results presented in different systems invite a broader-scale investigation as to why some parasites overcome the physiological and ecological barriers between distantly related host species, while others are localized within a set of phylogenetically close relatives.
We address this challenge by analysing a large amount of data describing mammalian host–parasite associations in wild mammals of four orders: Artiodactyla, Carnivora, Perissodactyla and Primates. Approximately half of the parasite species studied (781/1490) infect at least two host species. We compare the phylogenetic generalism of these parasite species in relation to two main factors: the higher-taxon parasite group (i.e. arthropods, bacteria, helminths, protozoa and viruses) and the transmission modes of each parasite species (i.e. close-contact transmission, complex life cycle transmission, environmental transmission and vector-borne transmission). Our aim is to identify patterns of parasite sharing by different hosts in relation to host phylogeny, and the principles that govern these patterns. Our study is unparalleled in terms of the diversity of host and parasite species considered. This breadth is made possible by the newly published Global Mammal Parasite Database (GMPD) v. 2.0 [33], which includes an extensive record of parasite occurrence in free-ranging populations of over 400 mammal species from the focal orders, coupled with information on the taxonomy and characteristics of the parasite species. In addition to considering the host range of multi-host parasite species, we also examine a commonly neglected component of ecological parasitology—the number of single-host parasites in relation to parasite taxonomy and transmission mode, as well as the position of their host in the phylogeny.
2. Material and methods
Records of parasite associations with terrestrial mammals were obtained from the GMPD [33,34]. These records include Latin binomials and taxonomic classification for host and parasite species, and transmission mode for the majority of parasite species (80%). Transmission modes were assigned in the GMPD based on an extensive literature review [33,34], and comprise: close contact, environmental, vector-borne and complex life cycle transmission (i.e. with intermediate hosts transitioning parasites to definitive hosts, including via predator–prey interactions). Literature searches always included ‘parasite’, ‘pathogen’ or ‘disease’ to minimize the possibility of unintentionally including records of post-mortem colonization by opportunist organisms (especially bacteria and arthropods). The GMPD data were analysed in R [35] to establish the number and identity of parasite species per host species and the number and identity of host species per parasite species. The analysis includes 404 terrestrial mammal host species. Because Perissodactyla is under-represented, with only 10 species compared to 115, 178 and 101 for Carnivora, Primates and Artiodactyla, respectively, we combined this order with Artiodactyla to form an ‘ungulate’ group consisting of 111 species.
A published phylogeny of mammals [36,37] was used to obtain the phylogenetic distance (PD) between all pairs of hosts. Although more recent mammal phylogenies have been published, we use this version because it matched the mammal taxonomy in the GMPD. Previous work has demonstrated that pairwise distance metrics, which we use here, are not generally biased by small differences in phylogenetic topology [38]. For the set of hosts of each parasite species, the mean pairwise PD between hosts was calculated, as was its standard effect size [39]. The latter was obtained using the R package picante [40], under a null model in which the community data matrix (host–parasite associations) was randomized 1000 times with the independent swap algorithm [41], maintaining occurrence frequencies of host and parasite species, and weighting the PD of selected host pairs based on their abundance in the GMPD. This measure captures the average relatedness of the host species of a given parasite species on a standardized scale, allowing for easier comparison among parasites. Two further standard effect size metrics were calculated on each parasite species' host set assuming the same null: maximum PD of any two hosts in a parasite's set, and the ratio of the mean of the minimum PD (average nearest-neighbour distance) to the single maximum PD [42]. The former metric provides a standardized measure of each parasite's breadth across the host phylogenetic tree (hereafter termed ‘span’). The latter metric identifies the nearest host for each host in the parasite set, averages these overall hosts in the set, and then scales by the (single) maximum distance for whole group (i.e. span). Thus, it provides a measure of the tendency for the set of host species to exhibit an aggregated distribution within the span (hereafter termed ‘aggregation’).
The null model used in the main text is a weighted null model that uses a weighted mean for PD values of selected hosts pairs. The weighting is the relative frequency of the hosts in the GMPD, and, therefore, incorporates the potential sampling bias inherent in the GMPD; certain host species are more commonly studied. An alternative null model was also explored in the electronic supplementary material that does not use weighted means, allowing a comparison of results when including and ignoring the potential sampling bias. The raw values for each metric of phylogenetic specificity, i.e. before applying standard effect size calculations, are compared across parasite types in the electronic supplementary material.
The null modelling approach allows the calculation of standard effect sizes that return a z-score and a p-value, where z-scores below −1.96 (phylogenetically specialist parasites) represent significant differences from the null expectation, assuming the null model generates a normally distributed set of scores [43]. Scores in the interval −1.96 < z < +1.96 are equivalent to a random host set under the null model. While z-scores greater than +1.96 are theoretically possible, they do not occur under the null models considered. An important caveat is that at low host richness, which includes parasites that infect few host species and host–parasite associations that are under sampled, there is less power to detect patterns of phylogenetic specialism [16]. Therefore, it is important to consider trends in the data, such as a tendency to observe negative z-scores, in addition to statistical significance of individual randomizations.
Host evolutionary distinctiveness, measured as millions of years of evolutionary separation, was estimated directly from the mammal phylogeny [36,37] using the evol.distinct function in the R package picante [40], with the equal splits option in which shared branches are apportioned equally among descendant lineages [44]. The terminal branch length of each host was also recorded as an additional measure of evolutionary isolation.
3. Results
Host communities of a parasite exhibited a trend towards being more related than expected by chance, indicated by negative z-scores for mean pairwise PD between host species (figure 1). The global median standard effect size was −0.93, with 96% of parasites having negative standard effect sizes that are predicted for phylogenetic host specialists. However, only 12.4% of parasites have significantly negative standard effect sizes. No parasites were found to have significantly positive standard effect sizes.
Figure 1.
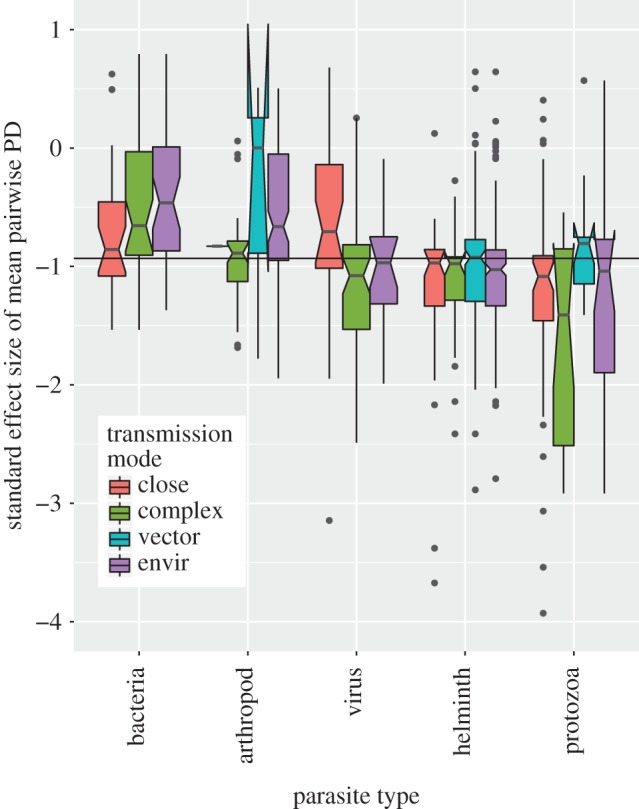
Boxplot of standard effect sizes of mean pairwise PD in each parasite group stratified by transmission mode. Negative values indicate that a parasite species tends to infect host species that are more closely related than expected by chance (under the null model). Conversely, positive values indicate the opposite. In terms of deviation from the null model, 12.4% of standard effect sizes are significantly negative (none of the positive values are statistically significant). Solid horizontal line indicates the global median standard effect size (−0.93).
The proportion of significantly negative standard effect sizes varies across parasite types, with smallest to largest proportions corresponding to bacteria, arthropods, helminths, viruses and protozoa, respectively (test for equality of proportions, p < 0.001, electronic supplementary material, figure S1 top panel). The proportion of significantly negative standard effect sizes is not significantly different across parasite transmission modes (test for equality of proportions, p = 0.65, at the 95% significance level, electronic supplementary material, figure S1 bottom panel). However, across the full range of standard effect sizes, each of the two covariates (parasite type and transmission mode) and their interaction explain significant differences between mean values (ANOVA: p < 0.001 for parasite type, transmission mode and interaction, details in electronic supplementary material, table S1). Additionally, we explored a less conservative null model that ignores the frequency of host records (unweighted) in the GMPD and compared patterns with the weighted null model used here (electronic supplementary material, figure S2). In general, standard effect sizes are highly correlated across the two null models, with more extreme negative effect sizes observed in the unweighted model, and viruses and bacteria being the parasite types most likely to be re-classified as phylogenetic specialists in an unweighted null model (electronic supplementary material, figure S2). Excluding parasite species with only one known host species does not bias results as the frequency of parasite types and transmission modes is congruent across single- and multi-host parasites (electronic supplementary material, figure S3).
Parasite type by transmission mode interactions are particularly driven by protozoa and viruses, and by close contact and vector-borne transmission (electronic supplementary material, figure S4). Close contact transmission is generally associated with extreme specialism in these groups and vector-borne transmission is generally associated with generalism. Parasites that infect hosts only within one group (carnivores, primates or ungulates) exhibit patterns of host relatedness that are qualitatively similar to the overall pattern (electronic supplementary material, figures S5 and S6). Departures from the general pattern include the observation of several specialist bacteria infecting carnivores (electronic supplementary material, figure S5) and the relative lack of importance of transmission mode on patterns of specialization for parasites infecting primates and ungulates (electronic supplementary material, figure S6).
Helminths and viruses have standard effect sizes for mean pairwise PD that are intermediate among the five parasite types, and their mean values are very close to each other. However, it is notable that viruses exhibit much wider variation in degree of generalism (figure 2), containing many extreme specialists (large, negative standard effect sizes) but also many generalists. By contrast, helminths tend to be more consistent in their degree of generalism, and contain relatively few species that are at either extreme of the generalism–specialism spectrum. This illustration underscores the importance of examining the variance in phylogenetic specialism of a parasite type in addition to its average level.
Figure 2.
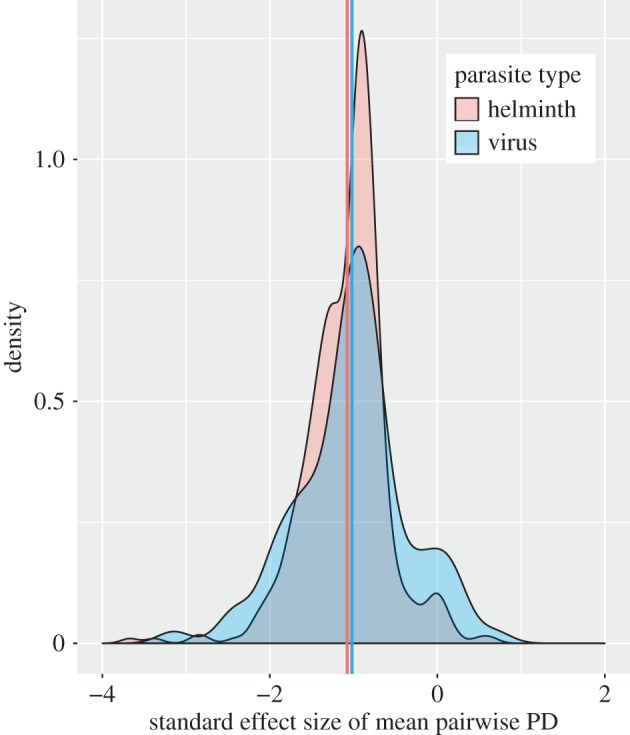
Probability density function of standard effect size of mean pairwise PD for helminths (red) and viruses (blue). The mean standard effect size is very close between the two types (group mean values denoted by colour-coded vertical lines), but the virus group contains more extreme parasites in terms of both specialism and generalism. The complete density plot for all five parasite types is presented in the electronic supplementary material (electronic supplementary material, figure S7).
In our investigations of span (maximum PD) and aggregation (the ratio of mean minimum to span), we found that parasite taxonomic groups exhibit variation in both of these metrics. Protozoa, viruses and helminths contain several parasite species whose span is significantly smaller than expected by chance (figure 3 points left of boxes in subplots). No parasite has a span that is bigger than expected by chance, which is not surprising because the spans associated with random host species selected in the null model are frequently large. Viruses and protozoa additionally contain some species whose hosts are more aggregated than expected by chance (figure 3, points below boxes in subplots). By contrast to parasite type, patterns of span and aggregation are similar across transmission modes (electronic supplementary material, figure S8). An example of two parasites, Leptospira interrogans and Trypanosoma cruzi, with similar span but very different aggregation patterns is provided in figure 4.
Figure 3.

Scatter plot showing both span and aggregation of parasites by type. The x-axes provide a standard effect size of maximum pairwise PD of a parasite's host set (span) and the y-axes provide a standard effect size of the ratio of mean minimum pairwise PD to maximum pairwise PD (aggregation). Circled bacterial and protozoan parasites are Leptospira interrogans and Trypanosoma cruzi. These parasites have a similar span (x ≈ 0), but very different host aggregation patterns (L. interrogans exhibiting a random distribution of host species, T. cruzi exhibiting an aggregated distribution of host species, illustrated further in figure 4). Boxes encompassing −1.96 < x, y < 1.96 contain parasites whose standard effect sizes are typical of those expected from a random set of hosts. Negative standard effect sizes lower than −1.96 are typical of host sets exhibiting a significantly small span (x-axis) and aggregated distribution (y-axis).
Figure 4.

Examples of aggregated (purple) and random (green) distributions of parasites of similar span in the host phylogeny. The parasites are Leptospira interrogans (green) and Trypanosoma cruzi (purple), coloured according to their groupings in figure 3. Black colouring indicates host species infected by both parasite species. The clade colours indicate primates (blue), ungulates (red) and carnivores (gold).
To investigate whether the evolutionary isolation of hosts influences host–parasite associations, we constructed a set of negative binomial generalized linear models, to accommodate over-dispersion in the number of parasite species per host species (variance to mean ratio approximately 25), meaning that a small number of host species are associated with a large number of parasite species. These models have the number of parasite species per host species as the response variable, and either host evolutionary distinctiveness or host terminal branch length as the main predictor variable (electronic supplementary material, figure S10). Each model was fitted with and without the inclusion of a second predictor variable, the number of host records in the GMPD, which was used to control for sampling bias. Only one model showed that more evolutionarily distinct hosts (but not those subtending from longer terminal branches, and not in models that included the number of host records) had significantly fewer parasite species (electronic supplementary material, table S2). Even ignoring the indication that these patterns appear to be largely driven by the number of host records (a measure of host sampling bias that was significant in all models in which it was applied), the data showed substantial noise in the negative relationship between evolutionary distinctiveness and parasitism, and the analyses revealed that, on average, a lineage loses one parasite species per million years (electronic supplementary material).
4. Discussion
We have shown that the vast majority of multi-host parasites in mammals have negative standard effect sizes for host pairwise phylogenetic distance, suggesting phylogenetic constraints on host breadth. However, individual parasites rarely have a phylogenetic host breadth that differs significantly from randomly sampled host communities. In addition, approximately half of the parasite species are only known to associate with a single-host species.
Of the five parasite types we consider, bacteria are the most generalist, while protozoa and viruses are more specialist. Transmission mode impacts the opportunity for parasites to encounter novel host species, for example, via low interspecific host contact rates, vector feeding preferences, disparate trophic links associated with complex life cycle transmission and low parasite survivorship in the environment. However, transmission mode was less influential in determining parasite generalism compared with parasite taxonomy, where taxonomy likely captures numerous biological traits for which data are currently lacking, such as mutation rates and immunogenicity. Additionally, there were interactions between parasite type and transmission mode; both protozoan and viral parasites exhibit specialism when transmission is through close contact, in agreement with primate parasite research that used taxonomy to classify host specificity [7]. Protozoan parasites that are environmentally transmitted are also often more specialist than expected by chance, whereas vector-borne protozoa are typically generalist. Some caution must be applied when jointly considering parasite type and transmission mode, as they are not truly independent predictors, with some transmission modes more characteristic of particular parasite types. An important area for future research will be to determine the extent to which apparent patterns of host specificity are controlled by intermediate hosts, paratenic hosts and vectors.
Previous research based on taxonomic definitions of generalism has suggested that viruses and protozoa are relatively generalist and helminths relatively specialist [7]. Some of the differences between these previous findings and the ones we present here emerge from our consideration of host phylogenetic breadth; taxonomic definitions may exaggerate rare but large host species jumps by classifying a parasite as, for instance, associating with hosts of multiple orders, even if that parasite is most often associated with hosts within the same genus (where we capture large jumps with the complementary standard effect size for span). In addition, and in contrast with purely taxonomic definitions of generalism, examining the standard effect sizes of host phylogenetic diversity metrics allows for continuous, standardized measures that facilitate comparison across parasite species and with null expectations thereby providing more robust hypotheses testing.
By using phylogeny rather than taxonomic definitions we found, for example, that while viruses often infect closely related hosts, as has been observed previously [18], they are also a group that contains several parasites whose hosts are distantly related. Similarly, previous research on a subset of primate helminths demonstrated strong patterns of co-speciation, with occasional cross-clade host switching [45]. This pattern of host–parasite association is reflected in our observation that the level of host specificity of several helminths is equivalent to that of random host sets, and these parasites may both ‘jump’ and ‘creep’ through host phylogeny, evidenced by several examples of large-span and high-aggregation helminths.
When interpreting patterns of phylogenetic host breadth, it is important to recognize that phylogenetic patterns in the hosts of parasites can represent multiple drivers of parasite sharing. These include the geographical ranges of hosts [17], although the relationship between host species relatedness and range overlap is complex [39]. Host behaviour and diet breadth may also correlate with degree of relatedness between host species. In primates, these traits were relatively weakly related to host phylogeny [46], but body size exhibited a strong phylogenetic signal, and is known to predict factors influencing parasite transmission in mammals, such as sociality and intensity of home range use [47]. The primates exhibit lower average body size than the other host taxa that we investigated, and if parasites differentially infect different sized hosts, this could account for some of the phylogenetic relatedness of a parasite's host set. Finally, related host species may exhibit similar immune responses or molecular similarities involved with entry of pathogens into cells, driven by comparable selection pressures [48], which could account for congruent parasite communities in related host species. We hope the patterns of host relatedness uncovered in this study will encourage future research aimed at establishing more mechanistic explanations for parasite sharing, although these may be complicated by confounded predictors.
While the underlying data in our analyses represent known host–parasite associations, they are not complete [49]. Nonetheless, our sample of multi-host parasites is not a taxonomically biased sample when compared to single-host parasites, and we have established the likely biases associated with well-studied host species, as well as which parasite types are most impacted by these biases by comparing null modelling approaches. We acknowledge that the associations between hosts and parasites are not necessarily indicative of parasite fitness, and certain parasite types may disproportionately represent low or near-zero fitness associations with hosts. For example, a helminth species with a paratenic host may obtain a rare ultimate host that is not technically a definitive host because no reproduction occurs. However, we assume the data, at minimum, reflect a correlation between the likelihood of observing a parasite with a putative mammal host species and that mammal species acting as a viable host.
The patterns of sharing of parasites among host species are controlled by several factors that are not measured explicitly and sharing may arise via several different mechanisms. Parasites may jump between host species, establishing in each, as demonstrated by rabies virus [50]. Parasites can also maintain themselves in some reservoir host species and occasionally spill over to others, as occurred, for example, in Middle East Respiratory Syndrome (MERS) coronovirus transmission from camels to humans [51]. In addition, some parasites that are apparently shared between hosts may be different species [52], while other multi-species parasite groups may be less speciose than currently acknowledged [53]. While the GMPD data use a standardized protocol for parasite nomenclature [33], it is possible that the tendency for taxa to be lumped versus split is different across the parasite types we consider, and this could ultimately impact the robustness of statistical analyses. The study of only four mammal orders opens the possibility that parasites that appear specialist, may infect other host species not considered here.
In addition to the taxonomic limitations of the data, variation in host richness across all parasite species may also bias and impact the power of statistical inference associated with the null modelling approach. If a parasite has only two host species, then picking many pairs of host species at random and comparing their relatedness to the relatedness of the observed pair may be more likely to result in the observation occurring towards the centre of the distribution of random relatedness. This is less likely to occur when the host richness of a parasite is high. For these reasons, we caution against over-interpreting the lack of significantly specialist parasites and emphasize the observation that the vast majority of parasites have negative effect sizes, suggesting phylogenetic constraints.
Another limitation concerns variation in sampling effort and host richness. The variation in richness may be partly attributed to the fact that some parasites are simply studied less than others, or hosts that harbour a particular parasite may be sampled less often. Even though we control for sampling effort using appropriate null models, this may not account for sampling effort perfectly, as assumptions are involved that may not be met. Collectively, the above caveats impact the inference we can draw on future potential for novel host acquisition from existing data based only on observations of presence, although promising statistical approaches have recently been put forward [54–56]. It is, however, worth speculating on some of the underlying drivers that might have given rise to contemporary observations, and identifying areas that warrant further study.
Plausibly, parasites with rapid evolution may be both good adaptors to, and explorers of, host space, as is indicated by many of the viruses, which exhibit associations with dispersed clusters of host species in the mammal phylogeny, perhaps indicative of taking occasional leaps to novel host species followed by subsequent colonization of closely related host species. For successful host shifts, there must also be the opportunity for host jumps: reservoir and naive hosts must come into contact, at least indirectly [57]. One obvious barrier to host shifts is geography. Host species geographical ranges have previously been shown to be one of the strongest predictors of viral parasite sharing among primates [17], but are only implicitly included here via the non-independence of range overlap and phylogenetic relatedness [58]. The explicit inclusion of geography is a promising line of macroecological inquiry that could provide further insights into parasite host range.
By extending taxonomic definitions of generalism, using a large set of host and parasite species, and using standard effect sizes for complementary measures of average host relatedness, span and aggregation in the host phylogeny, the nuanced patterns of host–parasite associations are clarified. Further biological interpretation will require extensive accumulation and accessibility of additional variables that are known to impact host specificity. These additional variables include the size of parasites, their mode of reproduction and mutation rates of these parasitic organisms [30,59]. Such data will provide a means to address outstanding questions. For example, is the low specificity of bacteria attributable to mutation rates, horizontal gene transfer or the need to maintain broadly acting virulence genes to compete with other microbes in the environment? [60]. Does virus architecture, as summarized by the Baltimore classification [61], influence host specificity directly and via the frequency of vector-borne transmission? Is helminth host specificity constrained by the number of intermediate hosts? [62].
The large number of parasite species included in this study allows us to propose some broad ‘rules’, for example, that bacteria are more generalist than protozoa. However, future studies on restricted subsets of related parasites will allow consideration of phylogenetic structure of the parasite species. Recent analyses in this spirit have shown that viral relatedness in the bat rabies system is an important factor partly controlling the sharing of parasite species among host species [63]. Addressing these questions will greatly improve our understanding of parasite diversity, and which potential host species, including humans, are at risk of acquiring novel parasites.
Supplementary Material
Data accessibility
This article has no additional data.
Authors' contributions
All authors were involved in conceiving and designing the study. A.W.P., M.J.F., J.P.S., S.H. and T.D. developed code and performed statistical analyses. All authors wrote the manuscript. All authors gave final approval for publication.
Competing interests
We declare we have no competing interests.
Funding
The Macroecology of Infectious Disease Research Coordination Network, funded by NSF (DEB 1316223) provided useful discussions and support for this work. M.F. is supported by a NSERC Vanier CGS. S.H. is supported by the Alexander von Humboldt Postdoctoral Fellowship. C.N. acknowledges NSF (BCS 1355902).
References
- 1.Cleaveland S, Laurenson MK, Taylor LH. 2001. Diseases of humans and their domestic mammals: pathogen characteristics, host range and the risk of emergence. Phil. Trans. R. Soc. B 356, 991–999. ( 10.1098/rstb.2001.0889) [DOI] [PMC free article] [PubMed] [Google Scholar]
- 2.Cleaveland S, Hess GR, Dobson AP, Laurenson MK, McCallum HI, Roberts MG, Woodroffe R. 2002. The role of pathogens in biological conservation. In The ecology of wildlife diseases (eds Hudson PJ, Rizzoli A, Grenfell BT, Heesterbeek H, Dobson AP), pp. 139–150. Oxford, UK: Oxford University Press. [Google Scholar]
- 3.Jones KE, Patel NG, Levy MA, Storeygard A, Balk D, Gittleman JL, Daszak P. 2008. Global trends in emerging infectious diseases. Nature 451, 990–993. ( 10.1038/nature06536) [DOI] [PMC free article] [PubMed] [Google Scholar]
- 4.Fuller T, Bensch S, Müller I, Novembre J, Pérez-Tris J, Ricklefs R, Smith T, Waldenström J. 2012. The ecology of emerging infectious diseases in migratory birds: an assessment of the role of climate change and priorities for future research. EcoHealth 9, 80–88. ( 10.1007/s10393-012-0750-1) [DOI] [PubMed] [Google Scholar]
- 5.Kreuder Johnson C, et al. 2015. Spillover and pandemic properties of zoonotic viruses with high host plasticity. Sci. Rep. 5, 14830 ( 10.1038/srep14830) [DOI] [PMC free article] [PubMed] [Google Scholar]
- 6.Poulin R. 1992. Determinants of host-specificity in parasites of freshwater fishes. Int. J. Parasitol. 22, 753–758. ( 10.1016/0020-7519(92)90124-4) [DOI] [PubMed] [Google Scholar]
- 7.Pedersen AB, Altizer S, Poss M, Cunningham AA, Nunn CL. 2005. Patterns of host specificity and transmission among parasites of wild primates. Int. J. Parasitol. 35, 647–657. ( 10.1016/j.ijpara.2005.01.005) [DOI] [PubMed] [Google Scholar]
- 8.Rohde K. 1980. Host specificity indices of parasites and their application. Experientia 36, 1369–1371. ( 10.1007/bf01960103) [DOI] [Google Scholar]
- 9.Paterson AM, Banks J. 2001. Analytical approaches to measuring cospeciation of host and parasites: through a glass, darkly. Int. J. Parasitol. 31, 1012–1022. ( 10.1016/S0020-7519(01)00199-0) [DOI] [PubMed] [Google Scholar]
- 10.Stephens PR, et al. 2016. The macroecology of infectious diseases: a new perspective on global-scale drivers of pathogen distributions and impacts. Ecol. Lett. 19, 1159–1171. ( 10.1111/ele.12644) [DOI] [PubMed] [Google Scholar]
- 11.Poulin R, Mouillot D. 2003. Parasite specialization from a phylogenetic perspective: a new index of host specificity. Parasitology 126, 473–480. ( 10.1017/S0031182003002993) [DOI] [PubMed] [Google Scholar]
- 12.Faith DP. 1992. Conservation evaluation and phylogenetic diversity. Biol. Conserv. 61, 1–10. ( 10.1016/0006-3207(92)91201-3) [DOI] [Google Scholar]
- 13.Purvis A, Hector A. 2000. Getting the measure of biodiversity. Nature 405, 212–219. ( 10.1038/35012221) [DOI] [PubMed] [Google Scholar]
- 14.Krasnov BR, Mouillot D, Shenbrot GI, Khokhlova IS, Poulin R. 2004. Geographical variation in host specificity of fleas (Siphonaptera) parasitic on small mammals: the influence of phylogeny and local environmental conditions. Ecography 27, 787–797. ( 10.1111/J.0906-7590.2004.04015.X) [DOI] [Google Scholar]
- 15.Poulin R, Krasnov BR, Mouillot D. 2011. Host specificity in phylogenetic and geographic space. Trends Parasitol. 27, 355–361. ( 10.1016/j.pt.2011.05.003) [DOI] [PubMed] [Google Scholar]
- 16.Cooper N, Griffin R, Franz M, Omotayo M, Nunn CL, Fryxell J. 2012. Phylogenetic host specificity and understanding parasite sharing in primates. Ecol. Lett. 15, 1370–1377. ( 10.1111/j.1461-0248.2012.01858.x) [DOI] [PubMed] [Google Scholar]
- 17.Davies TJ, Pedersen AB. 2008. Phylogeny and geography predict pathogen community similarity in wild primates and humans. Proc. R. Soc. B 275, 1695–1701. ( 10.1098/rspb.2008.0284) [DOI] [PMC free article] [PubMed] [Google Scholar]
- 18.Huang S, Bininda-Emonds ORP, Stephens PR, Gittleman JL, Altizer S. 2014. Phylogenetically related and ecologically similar carnivores harbour similar parasite assemblages. J. Anim. Ecol. 83, 671–680. ( 10.1111/1365-2656.12160) [DOI] [PubMed] [Google Scholar]
- 19.Poulin R. 2010. Decay of similarity with host phylogenetic distance in parasite faunas. Parasitology 137, 733–741. ( 10.1017/S0031182009991491) [DOI] [PubMed] [Google Scholar]
- 20.Presley SJ, Dallas T, Klingbeil BT, Willig MR. 2015. Phylogenetic signals in host-parasite associations for Neotropical bats and Nearctic desert rodents. Biol. J. Linn. Soc. 116, 312–327. ( 10.1111/bij.12601) [DOI] [Google Scholar]
- 21.Ricklefs RE, Fallon SM. 2002. Diversification and host switching in avian malaria parasites. Proc. R. Soc. Lond. B 269, 885–892. ( 10.1098/rspb.2001.1940) [DOI] [PMC free article] [PubMed] [Google Scholar]
- 22.Page RDM. 2003. Tangled trees: phylogeny, cospeciation, and coevolution. Chicago, IL: University of Chicago Press. [Google Scholar]
- 23.Harvey PH. 1996. Phylogenies for ecologists. J. Anim. Ecol. 65, 255–263. ( 10.2307/5872) [DOI] [Google Scholar]
- 24.Freckleton RP, Harvey PH, Pagel M. 2002. Phylogenetic analysis and comparative data: a test and review of evidence. Am. Nat. 160, 712 ( 10.1086/343873) [DOI] [PubMed] [Google Scholar]
- 25.Harvey PH, Pagel MD. 1991. The comparative method in evolutionary biology. Oxford, UK: Oxford University Press. [Google Scholar]
- 26.Pfennig DW. 2000. Effect of predator-prey phylogenetic similarity on the fitness consequences of predation: a trade-off between nutrition and disease? Am. Nat. 155, 335–345. [DOI] [PubMed] [Google Scholar]
- 27.Longdon B, Hadfield JD, Webster CL, Obbard DJ, Jiggins FM. 2011. Host phylogeny determines viral persistence and replication in novel hosts. PLoS Pathog. 7, e1002260 ( 10.1371/journal.ppat.1002260) [DOI] [PMC free article] [PubMed] [Google Scholar]
- 28.de Vienne DM, Hood ME, Giraud T. 2009. Phylogenetic determinants of potential host shifts in fungal pathogens. J. Evol. Biol. 22, 2532–2541. ( 10.1111/j.1420-9101.2009.01878.x) [DOI] [PubMed] [Google Scholar]
- 29.Rosas-Valdez R, León GP-P. 2010. Patterns of host specificity among the helminth parasite fauna of freshwater siluriforms: testing the biogeographical core parasite fauna hypothesis. Journal of Parasitology 97, 361–363. ( 10.1645/ge-2541.1) [DOI] [PubMed] [Google Scholar]
- 30.Woolhouse MEJ. 2001. Population biology of multihost pathogens. Science 292, 1109–1112. ( 10.1126/science.1059026) [DOI] [PubMed] [Google Scholar]
- 31.Parrish CR, Holmes EC, Morens DM, Park EC, Burke DS, Calisher CH, Laughlin CA, Saif LJ, Daszak P. 2008. Cross-species virus transmission and the emergence of new epidemic diseases. Microbiol. Mol. Biol. R. 72, 457 ( 10.1128/MMBR.00004-08) [DOI] [PMC free article] [PubMed] [Google Scholar]
- 32.Elena SF, Froissart R. 2010. New experimental and theoretical approaches towards the understanding of the emergence of viral infections. Phil. Trans. R. Soc. B 365, 1867–1869. ( 10.1098/rstb.2010.0088) [DOI] [PMC free article] [PubMed] [Google Scholar]
- 33.Stephens PR, et al. 2017. Global mammal parasite database version 2.0. Ecology 98, 1476 ( 10.1002/ecy.1799) [DOI] [PubMed] [Google Scholar]
- 34.Nunn CL, Altizer SM. 2005. The global mammal parasite database: an online resource for infectious disease records in wild primates. Evol. Anthropol. Issues News Rev. 14, 1–2. ( 10.1002/evan.20041) [DOI] [Google Scholar]
- 35.R Core Team. 2016. R: A Language and Environment for Statistical Computing.
- 36.Bininda-Emonds ORP, et al. 2007. The delayed rise of present-day mammals. Nature 446, 507–512. ( 10.1038/nature05634) [DOI] [PubMed] [Google Scholar]
- 37.Fritz SA, Bininda-Emonds ORP, Purvis A. 2009. Geographical variation in predictors of mammalian extinction risk: big is bad, but only in the tropics. Ecol. Lett. 12, 538–549. ( 10.1111/j.1461-0248.2009.01307.x) [DOI] [PubMed] [Google Scholar]
- 38.Swenson NG, Ackerly D, Kembel S, Zimmerman J, Zimmerman J. 2009. Phylogenetic resolution and quantifying the phylogenetic diversity and dispersion of communities. PLoS ONE 4, e4390 ( 10.1371/journal.pone.0004390) [DOI] [PMC free article] [PubMed] [Google Scholar]
- 39.Webb CO, Ackerly DD, McPeek MA, Donoghue MJ. 2002. Phylogenies and community ecology. Ann. Rev. Ecol. Syst. 33, 475–505. ( 10.1146/annurev.ecolsys.33.010802.150448) [DOI] [Google Scholar]
- 40.Kembel SW, Cowan PD, Helmus MR, Cornwell WK, Morlon H, Ackerly DD, Blomberg SP, Webb CO. 2010. Picante: {R} tools for integrating phylogenies and ecology. Bioinformatics 26, 1463–1464. ( 10.1093/bioinformatics/btq166) [DOI] [PubMed] [Google Scholar]
- 41.Gotelli NJ. 2000. Null model analysis of species co-occurrence patterns. Ecology 81, 2606–2621. ( 10.1890/0012-9658(2000)081%5B2606:NMAOSC%5D2.0.CO;2) [DOI] [Google Scholar]
- 42.Cooper N, Rodríguez J, Purvis A. 2008. A common tendency for phylogenetic overdispersion in mammalian assemblages. Proc. R. Soc. Lond. B 275, 2031–2037. ( 10.1098/rspb.2008.0420) [DOI] [PMC free article] [PubMed] [Google Scholar]
- 43.Ulrich W, Gotelli NJ. 2013. Pattern detection in null model analysis. Oikos 122, 2–18. ( 10.1111/j.1600-0706.2012.20325.x) [DOI] [Google Scholar]
- 44.Redding DW, Mooers AØ. 2006. Incorporating evolutionary measures into conservation prioritization. Conserv. Biol. 20, 1670–1678. ( 10.1111/j.1523-1739.2006.00555.x) [DOI] [PubMed] [Google Scholar]
- 45.Hugot JP. 1999. Primates and their pinworm parasites: the Cameron hypothesis revisited. Syst. Biol. 48, 523–546. ( 10.1080/106351599260120) [DOI] [PubMed] [Google Scholar]
- 46.Kamilar JM, Cooper N. 2013. Phylogenetic signal in primate behaviour, ecology and life history. Phil. Trans. R. Soc. B 368, 20120341 ( 10.1098/rstb.2012.0341) [DOI] [PMC free article] [PubMed] [Google Scholar]
- 47.Han BA, Park AW, Jolles AE, Altizer S. 2015. Infectious disease transmission and behavioural allometry in wild mammals. J. Anim. Ecol. 84, 637–646. ( 10.1111/1365-2656.12336) [DOI] [PubMed] [Google Scholar]
- 48.Altizer S, et al. 2003. Social organization and parasite risk in mammals: integrating theory and empirical studies. Annu. Rev. Ecol. Evol. Syst. 34, 517–547. ( 10.1146/annurev.ecolsys.34.030102.151725) [DOI] [Google Scholar]
- 49.Hopkins ME, Nunn CL. 2007. A global gap analysis of infectious agents in wild primates. Divers. Distrib. 13, 561–572. ( 10.1111/j.1472-4642.2007.00364.x) [DOI] [Google Scholar]
- 50.Holmes EC. 2009. The evolution and emergence of RNA viruses. Oxford, UK: OUP. [Google Scholar]
- 51.Mackay IM, Arden KE. 2015. MERS coronavirus: diagnostics, epidemiology and transmission. Virol. J. 12, 222 ( 10.1186/s12985-015-0439-5) [DOI] [PMC free article] [PubMed] [Google Scholar]
- 52.Dobson A, Lafferty KD, Kuris AM, Hechinger RF, Jetz W. 2008. Homage to linnaeus: how many parasites? How many hosts? Proc. Natl Acad. Sci. USA 105, 11 482–11 489. ( 10.1073/pnas.0803232105) [DOI] [PMC free article] [PubMed] [Google Scholar]
- 53.Schönian G, Mauricio I, Cupolillo E. 2010. Is it time to revise the nomenclature of Leishmania? Trends Parasitol. 26, 466–469. ( 10.1016/j.pt.2010.06.013) [DOI] [PubMed] [Google Scholar]
- 54.Han BA, Kramer AM, Drake JM. 2016. Global patterns of zoonotic disease in mammals. Trends Parasitol. 32, 565–577. ( 10.1016/j.pt.2016.04.007) [DOI] [PMC free article] [PubMed] [Google Scholar]
- 55.Dallas T, Park AW, Drake JM. 2017. Predicting cryptic links in host-parasite networks. PLoS Comput. Biol. 13, e1005557 ( 10.1371/journal.pcbi.1005557) [DOI] [PMC free article] [PubMed] [Google Scholar]
- 56.Dallas T, Park AW, Drake JM. 2017. Predictability of helminth parasite host range using information on geography, host traits and parasite community structure. Parasitology 144, 200–205. ( 10.1017/S0031182016001608) [DOI] [PubMed] [Google Scholar]
- 57.Wolfe ND, Dunavan CP, Diamond J. 2007. Origins of major human infectious diseases. Nature 447, 279–283. ( 10.1038/nature05775) [DOI] [PMC free article] [PubMed] [Google Scholar]
- 58.Poulin R, Keeney DB. 2008. Host specificity under molecular and experimental scrutiny. Trends Parasitol. 24, 24–28. ( 10.1016/j.pt.2007.10.002) [DOI] [PubMed] [Google Scholar]
- 59.Poulin R, Morand S. 2000. The diversity of parasites. Q. Rev. Biol. 75, 277–293. ( 10.1086/393500) [DOI] [PubMed] [Google Scholar]
- 60.Wilson BA, Salyers AA. 2003. Is the evolution of bacterial pathogens an out-of-body experience? Trends Microbiol. 11, 347–350. ( 10.1016/S0966-842X(03)00179-3) [DOI] [PubMed] [Google Scholar]
- 61.Baltimore D. 1971. Expression of animal virus genomes. Bacteriol. Rev. 35, 235–241. [DOI] [PMC free article] [PubMed] [Google Scholar]
- 62.Mouillot D, Krasnov RB, Shenbrot IG, Gaston JK, Poulin R. 2006. Conservatism of host specificity in parasites. Ecography 29, 596–602. ( 10.1111/j.0906-7590.2006.04507.x) [DOI] [Google Scholar]
- 63.Streicker DG, Turmelle AS, Vonhof MJ, Kuzmin IV, McCracken GF, Rupprecht CE. 2010. Host phylogeny constrains cross-species emergence and establishment of rabies virus in bats. Science 329, 676–679. ( 10.1126/science.1188836) [DOI] [PubMed] [Google Scholar]
Associated Data
This section collects any data citations, data availability statements, or supplementary materials included in this article.
Supplementary Materials
Data Availability Statement
This article has no additional data.